
World - Optical Fiber Cables - Market Analysis, Forecast, Size, Trends and Insights
Get instant access to more than 2 million reports, dashboards, and datasets on the IndexBox Platform.
View PricingGlobal Optical Fiber Cables Market to Witness Steady Growth with a CAGR of +3.9% from 2023 to 2030
IndexBox has just published a new report: World - Optical Fiber Cables - Market Analysis, Forecast, Size, Trends and Insights.
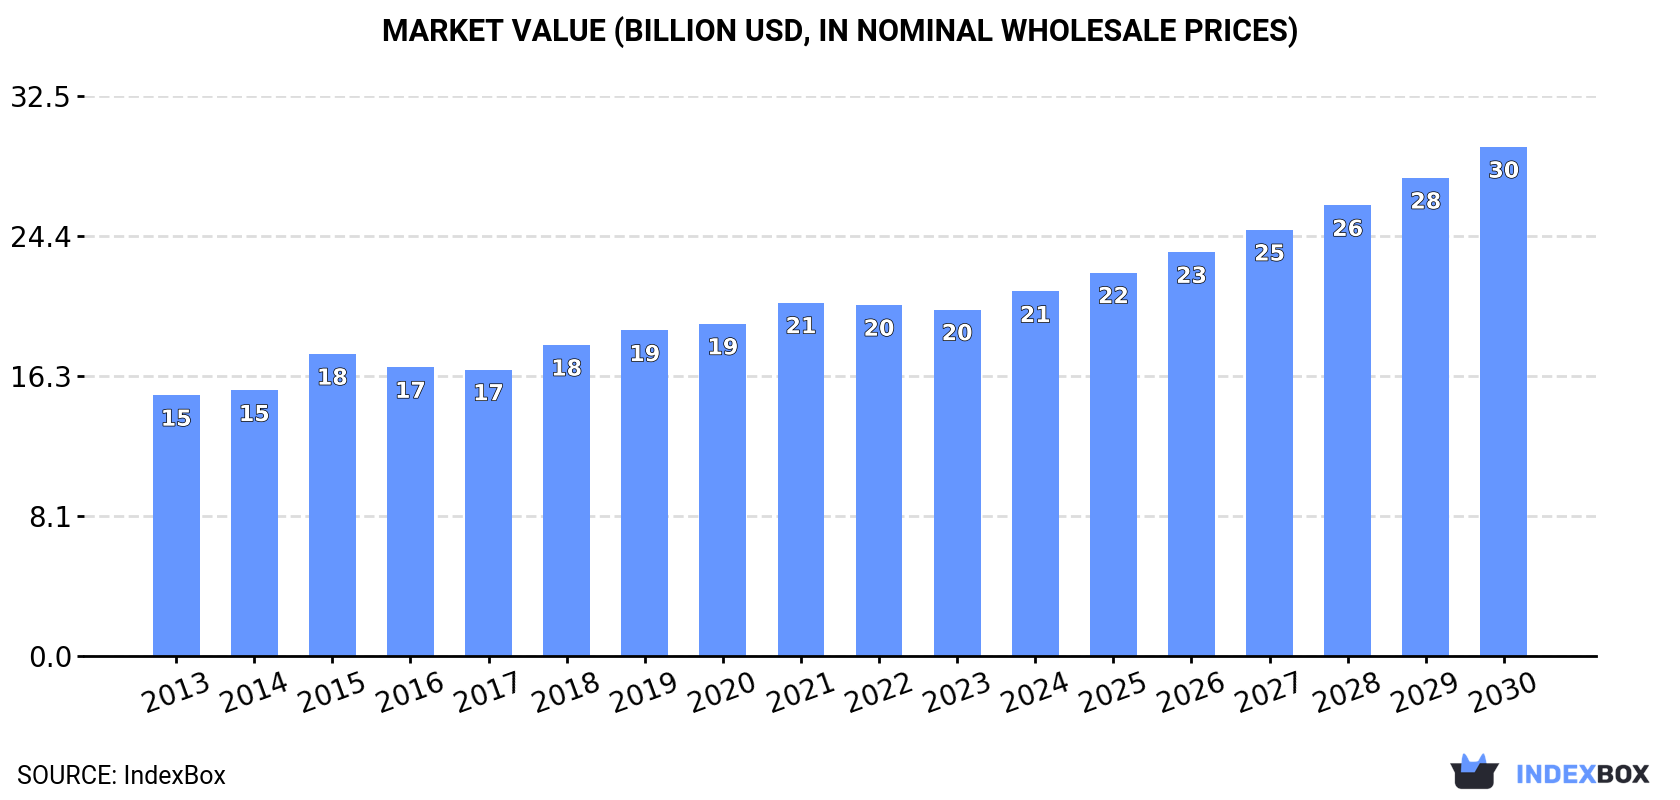
The article highlights the projected growth of the optical fiber cable market over the period from 2023 to 2030. With a steady increase in demand and market performance, the industry is forecasted to expand with a CAGR of +3.9% in volume and +5.7% in value. This growth trend is expected to bring the market volume to 2.2M tons and the market value to $29.6B by the end of 2030.
Market Forecast
Driven by increasing demand for optical fiber cables worldwide, the market is expected to continue an upward consumption trend over the next seven years. Market performance is forecast to retain its current trend pattern, expanding with an anticipated CAGR of +3.9% for the period from 2023 to 2030, which is projected to bring the market volume to 2.2M tons by the end of 2030.
In value terms, the market is forecast to increase with an anticipated CAGR of +5.7% for the period from 2023 to 2030, which is projected to bring the market value to $29.6B (in nominal wholesale prices) by the end of 2030.
Consumption
World Consumption of Optical Fiber Cables
After ten years of growth, consumption of optical fiber cables decreased by -10% to 1.7M tons in 2023. In general, the total consumption indicated noticeable growth from 2013 to 2023: its volume increased at an average annual rate of +3.8% over the last decade. The trend pattern, however, indicated some noticeable fluctuations being recorded throughout the analyzed period. Over the period under review, global consumption attained the maximum volume at 1.9M tons in 2022, and then declined in the following year.
The global optical fiber cables market value contracted slightly to $20.1B in 2023, approximately mirroring the previous year. This figure reflects the total revenues of producers and importers (excluding logistics costs, retail marketing costs, and retailers' margins, which will be included in the final consumer price). The market value increased at an average annual rate of +2.9% over the period from 2013 to 2023; however, the trend pattern indicated some noticeable fluctuations being recorded in certain years. Global consumption peaked at $20.5B in 2021; however, from 2022 to 2023, consumption stood at a somewhat lower figure.
Consumption By Country
The countries with the highest volumes of consumption in 2023 were China (354K tons), the United States (213K tons) and Brazil (108K tons), with a combined 40% share of global consumption. The UK, Russia, Kuwait, Pakistan, Canada, Indonesia, France, Turkey, Egypt and Iran lagged somewhat behind, together comprising a further 28%.
From 2013 to 2023, the most notable rate of growth in terms of consumption, amongst the key consuming countries, was attained by the UK (with a CAGR of +26.5%), while consumption for the other global leaders experienced more modest paces of growth.
In value terms, the largest optical fiber cables markets worldwide were the United States ($2.7B), China ($2.4B) and Turkey ($1.4B), together accounting for 32% of the global market. The UK, Russia, Kuwait, France, Egypt, Pakistan, Canada, Brazil, Indonesia and Iran lagged somewhat behind, together comprising a further 27%.
The UK, with a CAGR of +22.1%, recorded the highest rates of growth with regard to market size among the main consuming countries over the period under review, while market for the other global leaders experienced more modest paces of growth.
In 2023, the highest levels of optical fiber cables per capita consumption was registered in Kuwait (13 kg per person), followed by the UK (1.2 kg per person), Canada (1 kg per person) and the United States (0.6 kg per person), while the world average per capita consumption of optical fiber cables was estimated at 0.2 kg per person.
From 2013 to 2023, the average annual growth rate of the optical fiber cables per capita consumption in Kuwait amounted to -3.5%. In the other countries, the average annual rates were as follows: the UK (+25.7% per year) and Canada (+3.9% per year).
Production
World Production of Optical Fiber Cables
In 2023, global optical fiber cables production stood at 1.7M tons, surging by 3.1% compared with the year before. The total output volume increased at an average annual rate of +4.1% over the period from 2013 to 2023; however, the trend pattern indicated some noticeable fluctuations being recorded in certain years. The pace of growth was the most pronounced in 2020 with an increase of 13%. Over the period under review, global production attained the peak volume at 1.7M tons in 2021; afterwards, it flattened through to 2023.
In value terms, optical fiber cables production reached $17.9B in 2023 estimated in export price. The total output value increased at an average annual rate of +3.8% from 2013 to 2023; however, the trend pattern indicated some noticeable fluctuations being recorded throughout the analyzed period. The pace of growth was the most pronounced in 2018 when the production volume increased by 20%. Over the period under review, global production reached the maximum level at $19.3B in 2019; however, from 2020 to 2023, production remained at a lower figure.
Production By Country
China (708K tons) constituted the country with the largest volume of optical fiber cables production, accounting for 43% of total volume. Moreover, optical fiber cables production in China exceeded the figures recorded by the second-largest producer, the United States (206K tons), threefold. Brazil (62K tons) ranked third in terms of total production with a 3.8% share.
From 2013 to 2023, the average annual growth rate of volume in China totaled +8.9%. In the other countries, the average annual rates were as follows: the United States (+4.8% per year) and Brazil (+2.1% per year).
Imports
World Imports of Optical Fiber Cables
After three years of growth, purchases abroad of optical fiber cables decreased by -31.7% to 772K tons in 2023. Overall, imports, however, showed a prominent increase. The pace of growth appeared the most rapid in 2022 when imports increased by 37%. As a result, imports reached the peak of 1.1M tons, and then fell notably in the following year.
In value terms, optical fiber cables imports contracted rapidly to $9.5B in 2023. In general, imports, however, recorded a strong expansion. The pace of growth was the most pronounced in 2021 when imports increased by 31%. Global imports peaked at $11.4B in 2022, and then contracted rapidly in the following year.
Imports By Country
Mexico (71K tons), the UK (64K tons), Brazil (49K tons), France (43K tons), Indonesia (41K tons) and Canada (41K tons) represented roughly 40% of total imports in 2023. The following importers - Singapore (26K tons), the Philippines (21K tons), Hong Kong SAR (19K tons), Germany (17K tons), the United States (16K tons), the Netherlands (14K tons) and Denmark (14K tons) - together made up 16% of total imports.
From 2013 to 2023, the biggest increases were recorded for Brazil (with a CAGR of +32.4%), while purchases for the other global leaders experienced more modest paces of growth.
In value terms, the United States ($2.2B) constitutes the largest market for imported optical fiber cables worldwide, comprising 23% of global imports. The second position in the ranking was taken by Mexico ($770M), with an 8.1% share of global imports. It was followed by the UK, with a 5.1% share.
From 2013 to 2023, the average annual rate of growth in terms of value in the United States stood at +11.3%. In the other countries, the average annual rates were as follows: Mexico (+10.5% per year) and the UK (+12.0% per year).
Import Prices By Country
In 2023, the average optical fiber cables import price amounted to $12,330 per ton, picking up by 23% against the previous year. Overall, the import price showed a relatively flat trend pattern. Global import price peaked at $12,386 per ton in 2014; however, from 2015 to 2023, import prices stood at a somewhat lower figure.
Prices varied noticeably by country of destination: amid the top importers, the country with the highest price was the United States ($142,356 per ton), while Brazil ($3,354 per ton) was amongst the lowest.
From 2013 to 2023, the most notable rate of growth in terms of prices was attained by the United States (+29.3%), while the other global leaders experienced mixed trends in the import price figures.
Exports
World Exports of Optical Fiber Cables
In 2023, after seven years of growth, there was significant decline in shipments abroad of optical fiber cables, when their volume decreased by -14.2% to 722K tons. Over the period under review, exports, however, enjoyed a prominent increase. The pace of growth was the most pronounced in 2021 when exports increased by 31% against the previous year. The global exports peaked at 841K tons in 2022, and then declined in the following year.
In value terms, optical fiber cables exports shrank to $9.9B in 2023. Overall, total exports indicated a resilient increase from 2013 to 2023: its value increased at an average annual rate of +6.4% over the last decade. The trend pattern, however, indicated some noticeable fluctuations being recorded throughout the analyzed period. Based on 2023 figures, exports increased by +37.5% against 2020 indices. The most prominent rate of growth was recorded in 2021 when exports increased by 31%. The global exports peaked at $10.9B in 2022, and then shrank in the following year.
Exports By Country
China was the main exporting country with an export of about 357K tons, which resulted at 49% of total exports. Mexico (89K tons) held the second position in the ranking, followed by France (38K tons). All these countries together took approx. 18% share of total exports. The following exporters - Singapore (18K tons), South Korea (17K tons), Japan (17K tons), Poland (17K tons), Hong Kong SAR (15K tons), the Netherlands (13K tons), the UK (12K tons) and Germany (11K tons) - each recorded a 17% share of total exports.
From 2013 to 2023, average annual rates of growth with regard to optical fiber cables exports from China stood at +13.2%. At the same time, Hong Kong SAR (+17.2%), Mexico (+15.9%), Singapore (+13.1%), the Netherlands (+12.2%), Poland (+11.2%), France (+10.8%), the UK (+8.3%) and Japan (+7.3%) displayed positive paces of growth. Moreover, Hong Kong SAR emerged as the fastest-growing exporter exported in the world, with a CAGR of +17.2% from 2013-2023. By contrast, Germany (-2.6%) and South Korea (-4.2%) illustrated a downward trend over the same period. China (+21 p.p.), Mexico (+6.8 p.p.) and France (+1.5 p.p.) significantly strengthened its position in terms of the global exports, while Germany and South Korea saw its share reduced by -2.4% and -4.9% from 2013 to 2023, respectively. The shares of the other countries remained relatively stable throughout the analyzed period.
In value terms, China ($2.3B) remains the largest optical fiber cables supplier worldwide, comprising 24% of global exports. The second position in the ranking was taken by Mexico ($1.1B), with an 11% share of global exports. It was followed by France, with a 5.7% share.
In China, optical fiber cables exports expanded at an average annual rate of +8.5% over the period from 2013-2023. In the other countries, the average annual rates were as follows: Mexico (+8.2% per year) and France (+12.6% per year).
Export Prices By Country
In 2023, the average optical fiber cables export price amounted to $13,724 per ton, picking up by 5.8% against the previous year. Overall, the export price, however, showed a relatively flat trend pattern. The pace of growth appeared the most rapid in 2018 when the average export price increased by 10% against the previous year. As a result, the export price reached the peak level of $14,930 per ton. From 2019 to 2023, the average export prices failed to regain momentum.
Prices varied noticeably by country of origin: amid the top suppliers, the country with the highest price was Hong Kong SAR ($37,205 per ton), while Singapore ($6,294 per ton) was amongst the lowest.
From 2013 to 2023, the most notable rate of growth in terms of prices was attained by Hong Kong SAR (+6.4%), while the other global leaders experienced more modest paces of growth.
This report provides an in-depth analysis of the global optical fiber cables market. Within it, you will discover the latest data on market trends and opportunities by country, consumption, production and price developments, as well as the global trade (imports and exports). The forecast exhibits the market prospects through 2030.
Product coverage:
- Prodcom 27311100 - Optical fibre cables made up of individually sheathed fibres whether or not assembled with electric conductors or fitted with connectors
Country coverage:
Worldwide - the report contains statistical data for 200 countries and includes detailed profiles of the 50 largest consuming countries:
- USA
- China
- Japan
- Germany
- United Kingdom
- France
- Brazil
- Italy
- Russian Federation
- India
- Canada
- Australia
- Republic of Korea
- Spain
- Mexico
- Indonesia
- Netherlands
- Turkey
- Saudi Arabia
- Switzerland
- Sweden
- Nigeria
- Poland
- Belgium
- Argentina
- Norway
- Austria
- Thailand
- United Arab Emirates
- Colombia
- Denmark
- South Africa
- Malaysia
- Israel
- Singapore
- Egypt
- Philippines
- Finland
- Chile
- Ireland
- Pakistan
- Greece
- Portugal
- Kazakhstan
- Algeria
- Czech Republic
- Qatar
- Peru
- Romania
- Vietnam
+ the largest producing countries
Data coverage:
- Global market volume and value
- Per Capita consumption
- Forecast of the market dynamics in the medium term
- Global production, split by region and country
- Global trade (exports and imports)
- Export and import prices
- Market trends, drivers and restraints
- Key market players and their profiles
Company coverage:
Reasons to buy this report:
- Take advantage of the latest data
- Find deeper insights into current market developments
- Discover vital success factors affecting the market
This report is designed for manufacturers, distributors, importers, and wholesalers, as well as for investors, consultants and advisors.
In this report, you can find information that helps you to make informed decisions on the following issues:
- How to diversify your business and benefit from new market opportunities
- How to load your idle production capacity
- How to boost your sales on overseas markets
- How to increase your profit margins
- How to make your supply chain more sustainable
- How to reduce your production and supply chain costs
- How to outsource production to other countries
- How to prepare your business for global expansion
While doing this research, we combine the accumulated expertise of our analysts and the capabilities of artificial intelligence. The AI-based platform, developed by our data scientists, constitutes the key working tool for business analysts, empowering them to discover deep insights and ideas from the marketing data.
-
1. INTRODUCTION
Making Data-Driven Decisions to Grow Your Business
- REPORT DESCRIPTION
- RESEARCH METHODOLOGY AND AI PLATFORM
- DATA-DRIVEN DECISIONS FOR YOUR BUSINESS
- GLOSSARY AND SPECIFIC TERMS
-
2. EXECUTIVE SUMMARY
A Quick Overview of Market Performance
- KEY FINDINGS
- MARKET TRENDS This Chapter is Available Only for the Professional Edition PRO
-
3. MARKET OVERVIEW
Understanding the Current State of The Market and Its Prospects
- MARKET SIZE
- CONSUMPTION BY COUNTRY
- MARKET FORECAST TO 2030
-
4. MOST PROMISING PRODUCT
Finding New Products to Diversify Your Business
This Chapter is Available Only for the Professional Edition PRO- TOP PRODUCTS TO DIVERSIFY YOUR BUSINESS
- BEST-SELLING PRODUCTS
- MOST CONSUMED PRODUCT
- MOST TRADED PRODUCT
- MOST PROFITABLE PRODUCT FOR EXPORT
-
5. MOST PROMISING SUPPLYING COUNTRIES
Choosing the Best Countries to Establish Your Sustainable Supply Chain
This Chapter is Available Only for the Professional Edition PRO- TOP COUNTRIES TO SOURCE YOUR PRODUCT
- TOP PRODUCING COUNTRIES
- TOP EXPORTING COUNTRIES
- LOW-COST EXPORTING COUNTRIES
-
6. MOST PROMISING OVERSEAS MARKETS
Choosing the Best Countries to Boost Your Exports
This Chapter is Available Only for the Professional Edition PRO- TOP OVERSEAS MARKETS FOR EXPORTING YOUR PRODUCT
- TOP CONSUMING MARKETS
- UNSATURATED MARKETS
- TOP IMPORTING MARKETS
- MOST PROFITABLE MARKETS
7. GLOBAL PRODUCTION
The Latest Trends and Insights into The Industry
- PRODUCTION VOLUME AND VALUE
- PRODUCTION BY COUNTRY
8. GLOBAL IMPORTS
The Largest Importers on The Market and How They Succeed
- IMPORTS FROM 2012–2023
- IMPORTS BY COUNTRY
- IMPORT PRICES BY COUNTRY
9. GLOBAL EXPORTS
The Largest Exporters on The Market and How They Succeed
- EXPORTS FROM 2012–2023
- EXPORTS BY COUNTRY
- EXPORT PRICES BY COUNTRY
-
10. PROFILES OF MAJOR PRODUCERS
The Largest Producers on The Market and Their Profiles
This Chapter is Available Only for the Professional Edition PRO -
11. COUNTRY PROFILES
The Largest Markets And Their Profiles
This Chapter is Available Only for the Professional Edition PRO- United States
- China
- Japan
- Germany
- United Kingdom
- France
- Brazil
- Italy
- Russian Federation
- India
- Canada
- Australia
- Republic of Korea
- Spain
- Mexico
- Indonesia
- Netherlands
- Turkey
- Saudi Arabia
- Switzerland
- Sweden
- Nigeria
- Poland
- Belgium
- Argentina
- Norway
- Austria
- Thailand
- United Arab Emirates
- Colombia
- Denmark
- South Africa
- Malaysia
- Israel
- Singapore
- Egypt
- Philippines
- Finland
- Chile
- Ireland
- Pakistan
- Greece
- Portugal
- Kazakhstan
- Algeria
- Czech Republic
- Qatar
- Peru
- Romania
- Vietnam
-
LIST OF TABLES
- Key Findings In 2023
- Market Volume, In Physical Terms, 2012–2023
- Market Value, 2012–2023
- Per Capita Consumption, By Country, 2018–2023
- Production, In Physical Terms, By Country, 2012–2023
- Imports, In Physical Terms, By Country, 2012–2023
- Imports, In Value Terms, By Country, 2012–2023
- Import Prices, By Country Of Destination, 2012–2023
- Exports, In Physical Terms, By Country, 2012–2023
- Exports, In Value Terms, By Country, 2012–2023
- Export Prices, By Country Of Origin, 2012–2023
-
LIST OF FIGURES
- Market Volume, In Physical Terms, 2012–2023
- Market Value, 2012–2023
- Consumption, By Country, 2023
- Market Volume Forecast to 2030
- Market Value Forecast to 2030
- Products: Market Size And Growth, By Type
- Products: Average Per Capita Consumption, By Type
- Products: Exports And Growth, By Type
- Products: Export Prices And Growth, By Type
- Production Volume And Growth
- Exports And Growth
- Export Prices And Growth
- Market Size And Growth
- Per Capita Consumption
- Imports And Growth
- Import Prices
- Production, In Physical Terms, 2012–2023
- Production, In Value Terms, 2012–2023
- Production, By Country, 2023
- Production, In Physical Terms, By Country, 2012–2023
- Imports, In Physical Terms, 2012–2023
- Imports, In Value Terms, 2012–2023
- Imports, In Physical Terms, By Country, 2023
- Imports, In Physical Terms, By Country, 2012–2023
- Imports, In Value Terms, By Country, 2012–2023
- Import Prices, By Country, 2012–2023
- Exports, In Physical Terms, 2012–2023
- Exports, In Value Terms, 2012–2023
- Exports, In Physical Terms, By Country, 2023
- Exports, In Physical Terms, By Country, 2012–2023
- Exports, In Value Terms, By Country, 2012–2023
- Export Prices, 2012–2023


