
World - Dried, Undried And Frozen Pasta And Pasta Products - Market Analysis, Forecast, Size, Trends And Insights
Get instant access to more than 2 million reports, dashboards, and datasets on the IndexBox Platform.
View PricingGlobal Pasta Market: Increasing Consumption Trend Expected to Reach 10M Tons and $21.8B by 2030
IndexBox has just published a new report: World - Dried, Undried And Frozen Pasta And Pasta Products - Market Analysis, Forecast, Size, Trends And Insights.
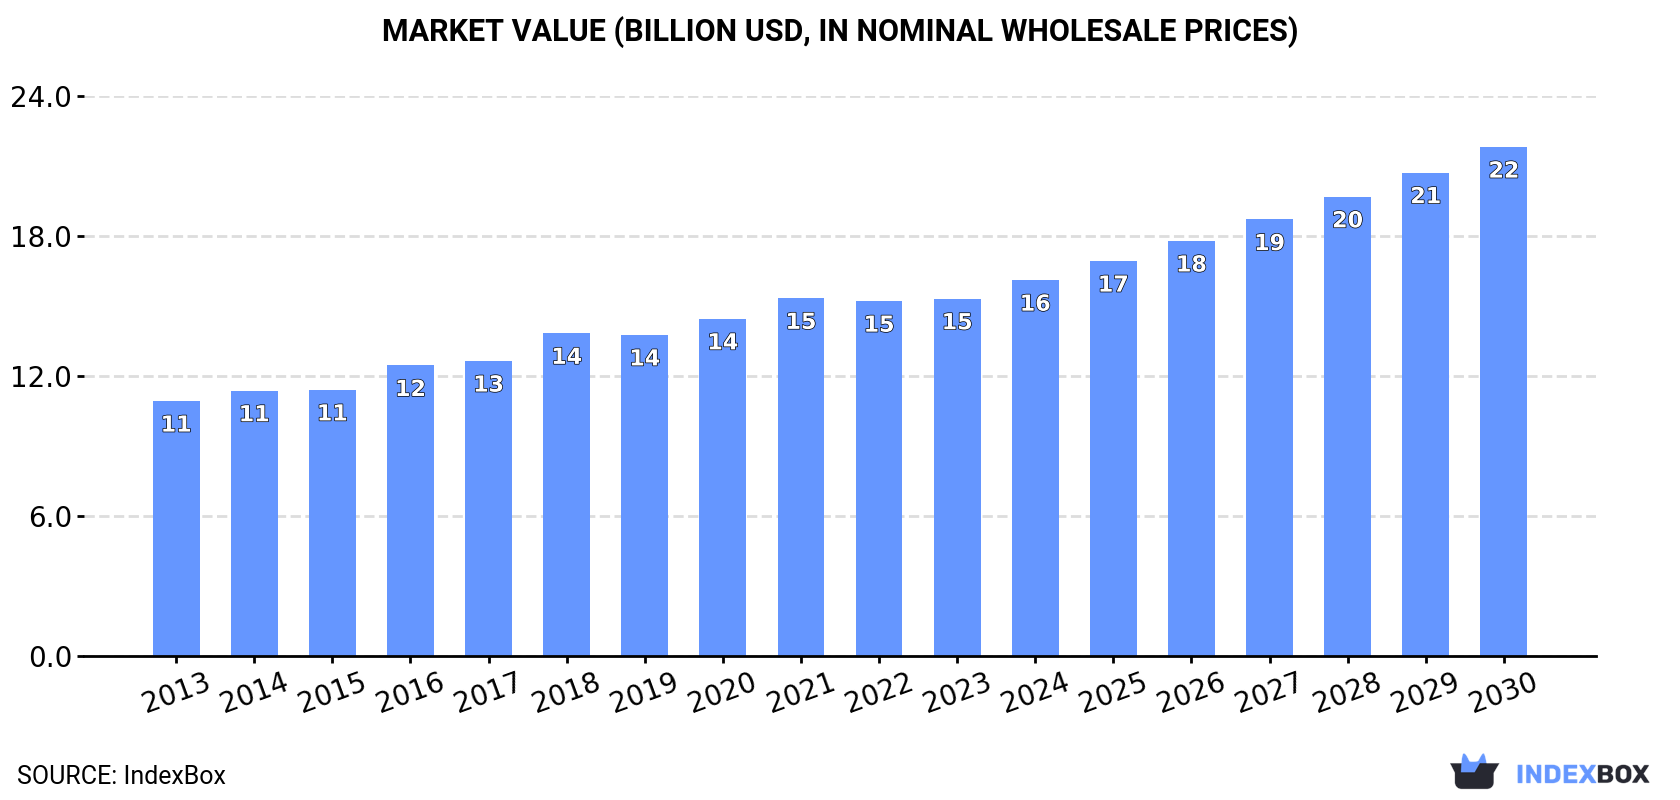
The global pasta market is expected to see sustained growth over the period from 2023 to 2030, with an anticipated CAGR of +3.4% in market volume and +5.2% in market value. By the end of 2030, the market volume is projected to reach 10 million tons, with a market value of $21.8 billion in nominal prices.
Market Forecast
Driven by increasing demand for dried, undried and frozen pasta and pasta products worldwide, the market is expected to continue an upward consumption trend over the next seven-year period. Market performance is forecast to retain its current trend pattern, expanding with an anticipated CAGR of +3.4% for the period from 2023 to 2030, which is projected to bring the market volume to 10M tons by the end of 2030.
In value terms, the market is forecast to increase with an anticipated CAGR of +5.2% for the period from 2023 to 2030, which is projected to bring the market value to $21.8B (in nominal wholesale prices) by the end of 2030.
Consumption
World Consumption of Dried, Undried And Frozen Pasta And Pasta Products
In 2023, the amount of dried, undried and frozen pasta and pasta products consumed worldwide amounted to 7.9M tons, leveling off at the year before. The total consumption volume increased at an average annual rate of +2.8% from 2013 to 2023; however, the trend pattern indicated some noticeable fluctuations being recorded in certain years. The most prominent rate of growth was recorded in 2018 when the consumption volume increased by 8.7%. Global consumption peaked at 8.2M tons in 2021; however, from 2022 to 2023, consumption stood at a somewhat lower figure.
The global pasta products market value was estimated at $15.3B in 2023, therefore, remained relatively stable against the previous year. This figure reflects the total revenues of producers and importers (excluding logistics costs, retail marketing costs, and retailers' margins, which will be included in the final consumer price). The market value increased at an average annual rate of +3.4% from 2013 to 2023; however, the trend pattern indicated some noticeable fluctuations being recorded in certain years. The pace of growth appeared the most rapid in 2018 when the market value increased by 9.4%. Over the period under review, the global market hit record highs at $15.3B in 2021; afterwards, it flattened through to 2023.
Consumption By Country
China (1.2M tons) remains the largest pasta products consuming country worldwide, accounting for 15% of total volume. Moreover, pasta products consumption in China exceeded the figures recorded by the second-largest consumer, the United States (572K tons), twofold. India (487K tons) ranked third in terms of total consumption with a 6.1% share.
In China, pasta products consumption increased at an average annual rate of +2.4% over the period from 2013-2023. In the other countries, the average annual rates were as follows: the United States (+5.8% per year) and India (+2.3% per year).
In value terms, China ($1.9B), the United States ($1.3B) and Japan ($949M) were the countries with the highest levels of market value in 2023, together accounting for 27% of the global market. India, Germany, Nigeria, Pakistan, the UK, Brazil, Indonesia, Bangladesh, Russia and Mexico lagged somewhat behind, together comprising a further 29%.
Among the main consuming countries, Pakistan, with a CAGR of +15.9%, saw the highest rates of growth with regard to market size over the period under review, while market for the other global leaders experienced more modest paces of growth.
The countries with the highest levels of pasta products per capita consumption in 2023 were the UK (2.6 kg per person), Germany (2.2 kg per person) and Japan (2 kg per person).
From 2013 to 2023, the biggest increases were recorded for Pakistan (with a CAGR of +11.7%), while consumption for the other global leaders experienced more modest paces of growth.
Production
World Production of Dried, Undried And Frozen Pasta And Pasta Products
In 2023, the amount of dried, undried and frozen pasta and pasta products produced worldwide stood at 8.1M tons, approximately equating the year before. The total output volume increased at an average annual rate of +3.1% from 2013 to 2023; however, the trend pattern indicated some noticeable fluctuations being recorded throughout the analyzed period. The most prominent rate of growth was recorded in 2018 when the production volume increased by 9.4% against the previous year. Global production peaked at 8.1M tons in 2021; afterwards, it flattened through to 2023.
In value terms, pasta products production totaled $15.9B in 2023 estimated in export price. The total output value increased at an average annual rate of +3.3% over the period from 2013 to 2023; however, the trend pattern indicated some noticeable fluctuations being recorded in certain years. The growth pace was the most rapid in 2016 when the production volume increased by 9.5%. Over the period under review, global production attained the maximum level at $16B in 2021; however, from 2022 to 2023, production stood at a somewhat lower figure.
Production By Country
China (1.6M tons) constituted the country with the largest volume of pasta products production, comprising approx. 20% of total volume. Moreover, pasta products production in China exceeded the figures recorded by the second-largest producer, the United States (524K tons), threefold. The third position in this ranking was taken by India (492K tons), with a 6.1% share.
In China, pasta products production expanded at an average annual rate of +2.2% over the period from 2013-2023. In the other countries, the average annual rates were as follows: the United States (+4.3% per year) and India (+2.3% per year).
Imports
World Imports of Dried, Undried And Frozen Pasta And Pasta Products
In 2023, approx. 2M tons of dried, undried and frozen pasta and pasta products were imported worldwide; remaining relatively unchanged against the previous year's figure. Over the period under review, total imports indicated a measured expansion from 2013 to 2023: its volume increased at an average annual rate of +3.9% over the last decade. The trend pattern, however, indicated some noticeable fluctuations being recorded throughout the analyzed period. Based on 2023 figures, imports decreased by -1.7% against 2021 indices. The pace of growth was the most pronounced in 2017 when imports increased by 19%. Over the period under review, global imports attained the maximum at 2.1M tons in 2021; however, from 2022 to 2023, imports stood at a somewhat lower figure.
In value terms, pasta products imports rose slightly to $4.8B in 2023. Overall, imports continue to indicate strong growth. The growth pace was the most rapid in 2017 with an increase of 23% against the previous year. Global imports peaked in 2023 and are expected to retain growth in the near future.
Imports By Country
The countries with the highest levels of pasta products imports in 2023 were the United States (124K tons), Germany (106K tons), the UK (100K tons), China (98K tons), Malaysia (94K tons), the Netherlands (90K tons), South Korea (87K tons), Hong Kong SAR (87K tons), Canada (77K tons), Australia (77K tons), Togo (71K tons) and France (66K tons), together reaching 53% of total import. Belgium (65K tons) followed a long way behind the leaders.
From 2013 to 2023, the biggest increases were recorded for Togo (with a CAGR of +13.7%), while purchases for the other global leaders experienced more modest paces of growth.
In value terms, the largest pasta products importing markets worldwide were the United States ($416M), China ($320M) and Germany ($308M), together accounting for 22% of global imports.
China, with a CAGR of +16.9%, saw the highest growth rate of the value of imports, among the main importing countries over the period under review, while purchases for the other global leaders experienced more modest paces of growth.
Import Prices By Country
The average pasta products import price stood at $2,350 per ton in 2023, picking up by 3.1% against the previous year. Over the last decade, it increased at an average annual rate of +3.4%. The pace of growth appeared the most rapid in 2022 when the average import price increased by 11%. Over the period under review, average import prices attained the maximum in 2023 and is expected to retain growth in the immediate term.
There were significant differences in the average prices amongst the major importing countries. In 2023, amid the top importers, the country with the highest price was the United States ($3,346 per ton), while Togo ($334 per ton) was amongst the lowest.
From 2013 to 2023, the most notable rate of growth in terms of prices was attained by the UK (+8.1%), while the other global leaders experienced more modest paces of growth.
Exports
World Exports of Dried, Undried And Frozen Pasta And Pasta Products
In 2023, overseas shipments of dried, undried and frozen pasta and pasta products increased by 2.7% to 2.2M tons, rising for the seventh year in a row after two years of decline. In general, total exports indicated a resilient increase from 2013 to 2023: its volume increased at an average annual rate of +5.3% over the last decade. The trend pattern, however, indicated some noticeable fluctuations being recorded throughout the analyzed period. Based on 2023 figures, exports increased by +80.0% against 2016 indices. The most prominent rate of growth was recorded in 2017 with an increase of 26%. The global exports peaked in 2023 and are expected to retain growth in years to come.
In value terms, pasta products exports rose modestly to $5.2B in 2023. Over the period under review, exports showed a strong expansion. The pace of growth was the most pronounced in 2017 with an increase of 16%. The global exports peaked in 2023 and are expected to retain growth in years to come.
Exports By Country
In 2023, China (527K tons), distantly followed by South Korea (245K tons), Indonesia (166K tons) and Thailand (135K tons) were the key exporters of dried, undried and frozen pasta and pasta products, together committing 49% of total exports. Vietnam (96K tons), Italy (88K tons), Turkey (86K tons), the United States (76K tons), the Netherlands (58K tons), Germany (54K tons), Russia (53K tons), Malaysia (43K tons) and Kazakhstan (43K tons) followed a long way behind the leaders.
Exports from China increased at an average annual rate of +2.9% from 2013 to 2023. At the same time, South Korea (+15.6%), Vietnam (+14.9%), the Netherlands (+12.8%), Kazakhstan (+11.6%), Thailand (+5.6%), Turkey (+5.5%), Russia (+4.4%), Germany (+3.5%), Indonesia (+3.2%), Italy (+2.1%) and the United States (+1.8%) displayed positive paces of growth. Moreover, South Korea emerged as the fastest-growing exporter exported in the world, with a CAGR of +15.6% from 2013-2023. Malaysia experienced a relatively flat trend pattern. South Korea (+6.8 p.p.) and Vietnam (+2.6 p.p.) significantly strengthened its position in terms of the global exports, while Indonesia and China saw its share reduced by -1.7% and -6.2% from 2013 to 2023, respectively. The shares of the other countries remained relatively stable throughout the analyzed period.
In value terms, China ($899M), South Korea ($816M) and Thailand ($420M) appeared to be the countries with the highest levels of exports in 2023, together accounting for 41% of global exports. Indonesia, Italy, the Netherlands, Vietnam, the United States, Germany, Malaysia, Turkey, Russia and Kazakhstan lagged somewhat behind, together accounting for a further 32%.
Vietnam, with a CAGR of +19.2%, recorded the highest growth rate of the value of exports, in terms of the main exporting countries over the period under review, while shipments for the other global leaders experienced more modest paces of growth.
Export Prices By Country
In 2023, the average pasta products export price amounted to $2,389 per ton, approximately reflecting the previous year. Over the period from 2013 to 2023, it increased at an average annual rate of +2.4%. The most prominent rate of growth was recorded in 2016 an increase of 16% against the previous year. Over the period under review, the average export prices hit record highs in 2023 and is likely to continue growth in the immediate term.
Prices varied noticeably by country of origin: amid the top suppliers, the country with the highest price was the Netherlands ($4,256 per ton), while Turkey ($914 per ton) was amongst the lowest.
From 2013 to 2023, the most notable rate of growth in terms of prices was attained by Kazakhstan (+6.7%), while the other global leaders experienced more modest paces of growth.
This report provides an in-depth analysis of the global pasta products market. Within it, you will discover the latest data on market trends and opportunities by country, consumption, production and price developments, as well as the global trade (imports and exports). The forecast exhibits the market prospects through 2030.
Product coverage:
- Prodcom 10851430 - Dried, undried and frozen pasta and pasta products (including prepared dishes) (excluding uncooked pasta, stuffed pasta)
Country coverage:
Worldwide - the report contains statistical data for 200 countries and includes detailed profiles of the 50 largest consuming countries:
- USA
- China
- Japan
- Germany
- United Kingdom
- France
- Brazil
- Italy
- Russian Federation
- India
- Canada
- Australia
- Republic of Korea
- Spain
- Mexico
- Indonesia
- Netherlands
- Turkey
- Saudi Arabia
- Switzerland
- Sweden
- Nigeria
- Poland
- Belgium
- Argentina
- Norway
- Austria
- Thailand
- United Arab Emirates
- Colombia
- Denmark
- South Africa
- Malaysia
- Israel
- Singapore
- Egypt
- Philippines
- Finland
- Chile
- Ireland
- Pakistan
- Greece
- Portugal
- Kazakhstan
- Algeria
- Czech Republic
- Qatar
- Peru
- Romania
- Vietnam
+ the largest producing countries
Data coverage:
- Global market volume and value
- Per Capita consumption
- Forecast of the market dynamics in the medium term
- Global production, split by region and country
- Global trade (exports and imports)
- Export and import prices
- Market trends, drivers and restraints
- Key market players and their profiles
Reasons to buy this report:
- Take advantage of the latest data
- Find deeper insights into current market developments
- Discover vital success factors affecting the market
This report is designed for manufacturers, distributors, importers, and wholesalers, as well as for investors, consultants and advisors.
In this report, you can find information that helps you to make informed decisions on the following issues:
- How to diversify your business and benefit from new market opportunities
- How to load your idle production capacity
- How to boost your sales on overseas markets
- How to increase your profit margins
- How to make your supply chain more sustainable
- How to reduce your production and supply chain costs
- How to outsource production to other countries
- How to prepare your business for global expansion
While doing this research, we combine the accumulated expertise of our analysts and the capabilities of artificial intelligence. The AI-based platform, developed by our data scientists, constitutes the key working tool for business analysts, empowering them to discover deep insights and ideas from the marketing data.
-
1. INTRODUCTION
Making Data-Driven Decisions to Grow Your Business
- REPORT DESCRIPTION
- RESEARCH METHODOLOGY AND AI PLATFORM
- DATA-DRIVEN DECISIONS FOR YOUR BUSINESS
- GLOSSARY AND SPECIFIC TERMS
-
2. EXECUTIVE SUMMARY
A Quick Overview of Market Performance
- KEY FINDINGS
- MARKET TRENDS This Chapter is Available Only for the Professional Edition PRO
-
3. MARKET OVERVIEW
Understanding the Current State of The Market and Its Prospects
- MARKET SIZE
- CONSUMPTION BY COUNTRY
- MARKET FORECAST TO 2030
-
4. MOST PROMISING PRODUCT
Finding New Products to Diversify Your Business
This Chapter is Available Only for the Professional Edition PRO- TOP PRODUCTS TO DIVERSIFY YOUR BUSINESS
- BEST-SELLING PRODUCTS
- MOST CONSUMED PRODUCT
- MOST TRADED PRODUCT
- MOST PROFITABLE PRODUCT FOR EXPORT
-
5. MOST PROMISING SUPPLYING COUNTRIES
Choosing the Best Countries to Establish Your Sustainable Supply Chain
This Chapter is Available Only for the Professional Edition PRO- TOP COUNTRIES TO SOURCE YOUR PRODUCT
- TOP PRODUCING COUNTRIES
- TOP EXPORTING COUNTRIES
- LOW-COST EXPORTING COUNTRIES
-
6. MOST PROMISING OVERSEAS MARKETS
Choosing the Best Countries to Boost Your Exports
This Chapter is Available Only for the Professional Edition PRO- TOP OVERSEAS MARKETS FOR EXPORTING YOUR PRODUCT
- TOP CONSUMING MARKETS
- UNSATURATED MARKETS
- TOP IMPORTING MARKETS
- MOST PROFITABLE MARKETS
7. GLOBAL PRODUCTION
The Latest Trends and Insights into The Industry
- PRODUCTION VOLUME AND VALUE
- PRODUCTION BY COUNTRY
8. GLOBAL IMPORTS
The Largest Importers on The Market and How They Succeed
- IMPORTS FROM 2012–2023
- IMPORTS BY COUNTRY
- IMPORT PRICES BY COUNTRY
9. GLOBAL EXPORTS
The Largest Exporters on The Market and How They Succeed
- EXPORTS FROM 2012–2023
- EXPORTS BY COUNTRY
- EXPORT PRICES BY COUNTRY
-
10. PROFILES OF MAJOR PRODUCERS
The Largest Producers on The Market and Their Profiles
This Chapter is Available Only for the Professional Edition PRO -
11. COUNTRY PROFILES
The Largest Markets And Their Profiles
This Chapter is Available Only for the Professional Edition PRO- United States
- China
- Japan
- Germany
- United Kingdom
- France
- Brazil
- Italy
- Russian Federation
- India
- Canada
- Australia
- Republic of Korea
- Spain
- Mexico
- Indonesia
- Netherlands
- Turkey
- Saudi Arabia
- Switzerland
- Sweden
- Nigeria
- Poland
- Belgium
- Argentina
- Norway
- Austria
- Thailand
- United Arab Emirates
- Colombia
- Denmark
- South Africa
- Malaysia
- Israel
- Singapore
- Egypt
- Philippines
- Finland
- Chile
- Ireland
- Pakistan
- Greece
- Portugal
- Kazakhstan
- Algeria
- Czech Republic
- Qatar
- Peru
- Romania
- Vietnam
-
LIST OF TABLES
- Key Findings In 2023
- Market Volume, In Physical Terms, 2012–2023
- Market Value, 2012–2023
- Per Capita Consumption, By Country, 2018–2023
- Production, In Physical Terms, By Country, 2012–2023
- Imports, In Physical Terms, By Country, 2012–2023
- Imports, In Value Terms, By Country, 2012–2023
- Import Prices, By Country Of Destination, 2012–2023
- Exports, In Physical Terms, By Country, 2012–2023
- Exports, In Value Terms, By Country, 2012–2023
- Export Prices, By Country Of Origin, 2012–2023
-
LIST OF FIGURES
- Market Volume, In Physical Terms, 2012–2023
- Market Value, 2012–2023
- Consumption, By Country, 2023
- Market Volume Forecast to 2030
- Market Value Forecast to 2030
- Products: Market Size And Growth, By Type
- Products: Average Per Capita Consumption, By Type
- Products: Exports And Growth, By Type
- Products: Export Prices And Growth, By Type
- Production Volume And Growth
- Exports And Growth
- Export Prices And Growth
- Market Size And Growth
- Per Capita Consumption
- Imports And Growth
- Import Prices
- Production, In Physical Terms, 2012–2023
- Production, In Value Terms, 2012–2023
- Production, By Country, 2023
- Production, In Physical Terms, By Country, 2012–2023
- Imports, In Physical Terms, 2012–2023
- Imports, In Value Terms, 2012–2023
- Imports, In Physical Terms, By Country, 2023
- Imports, In Physical Terms, By Country, 2012–2023
- Imports, In Value Terms, By Country, 2012–2023
- Import Prices, By Country, 2012–2023
- Exports, In Physical Terms, 2012–2023
- Exports, In Value Terms, 2012–2023
- Exports, In Physical Terms, By Country, 2023
- Exports, In Physical Terms, By Country, 2012–2023
- Exports, In Value Terms, By Country, 2012–2023
- Export Prices, 2012–2023


