
World - Patent Leather, Patent Laminated Leather And Metallised Leather - Market Analysis, Forecast, Size, Trends And Insights
Get instant access to more than 2 million reports, dashboards, and datasets on the IndexBox Platform.
View PricingGlobal Patent Leather Market to See Slow but Steady Growth with CAGR of +1.6% from 2023-2030
IndexBox has just published a new report: World - Patent Leather, Patent Laminated Leather And Metallised Leather - Market Analysis, Forecast, Size, Trends And Insights.
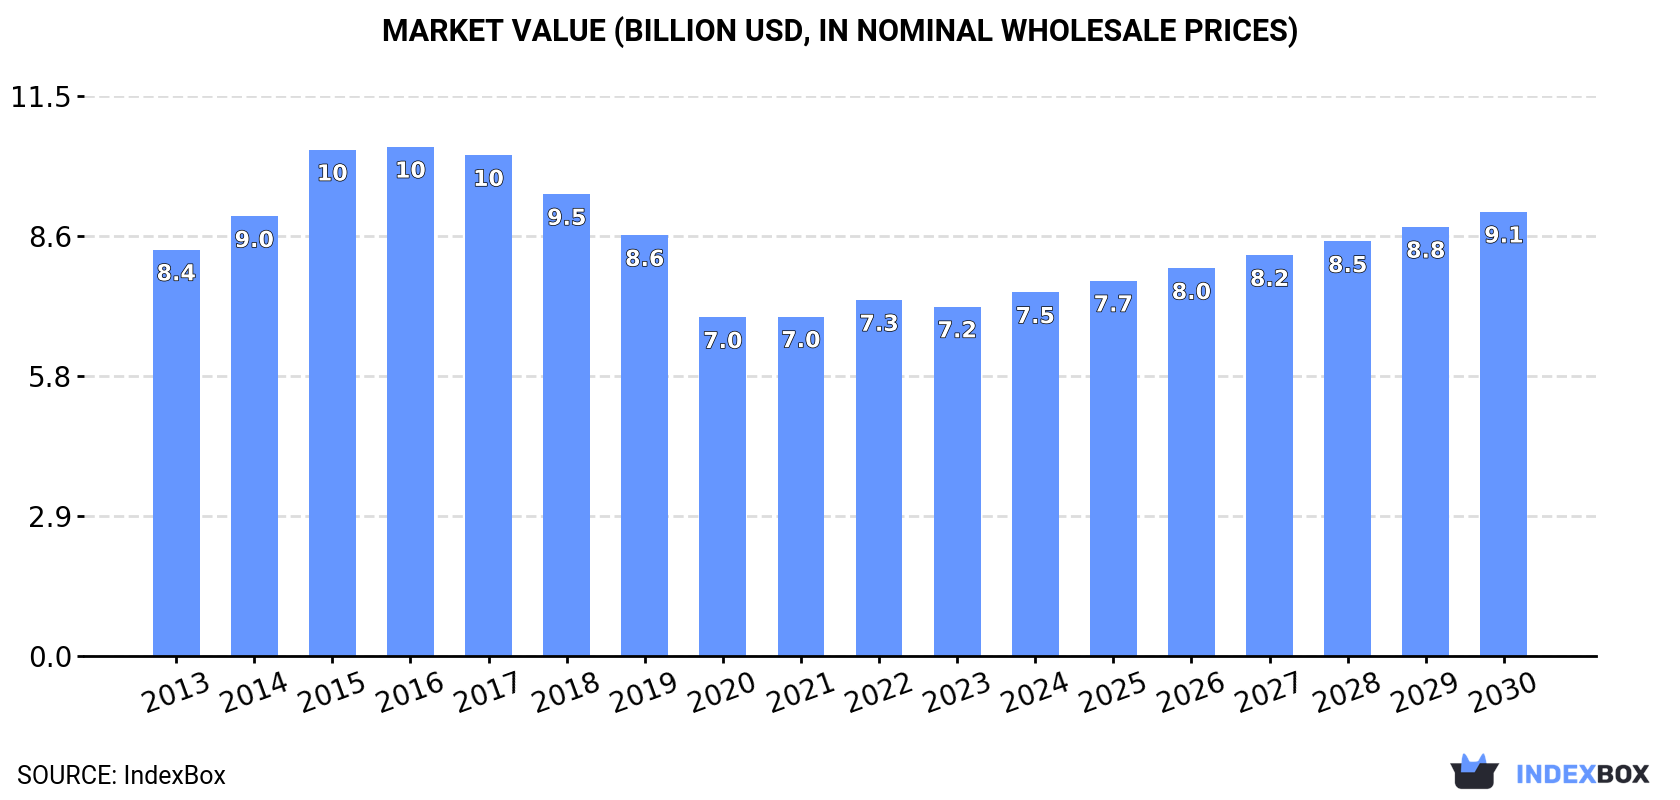
The patent leather market is projected to see a slight increase in performance, with a forecasted CAGR of +1.6% in volume and +3.5% in value from 2023 to 2030. By the end of 2030, market volume is expected to reach 418M square meters and market value is anticipated to hit $9.1B in nominal prices.
Market Forecast
Driven by rising demand for patent leather worldwide, the market is expected to start an upward consumption trend over the next seven years. The performance of the market is forecast to increase slightly, with an anticipated CAGR of +1.6% for the period from 2023 to 2030, which is projected to bring the market volume to 418M square meters by the end of 2030.
In value terms, the market is forecast to increase with an anticipated CAGR of +3.5% for the period from 2023 to 2030, which is projected to bring the market value to $9.1B (in nominal wholesale prices) by the end of 2030.
Consumption
World Consumption of Patent Leather, Patent Laminated Leather and Metallised Leather
In 2023, the amount of patent leather, patent laminated leather and metallised leather consumed worldwide shrank modestly to 374M square meters, which is down by -3.4% compared with the year before. Overall, consumption recorded a noticeable slump. The most prominent rate of growth was recorded in 2017 when the consumption volume increased by 9.3%. Global consumption peaked at 540M square meters in 2014; however, from 2015 to 2023, consumption failed to regain momentum.
The global patent leather market revenue dropped to $7.2B in 2023, which is down by -1.9% against the previous year. This figure reflects the total revenues of producers and importers (excluding logistics costs, retail marketing costs, and retailers' margins, which will be included in the final consumer price). Over the period under review, consumption recorded a mild reduction. Global consumption peaked at $10.5B in 2016; however, from 2017 to 2023, consumption stood at a somewhat lower figure.
Consumption By Country
The countries with the highest volumes of consumption in 2023 were China (59M square meters), Italy (56M square meters) and the United States (37M square meters), together accounting for 41% of global consumption.
From 2013 to 2023, the biggest increases were recorded for the United States (with a CAGR of +0.9%), while consumption for the other global leaders experienced more modest paces of growth.
In value terms, Italy ($1.4B), Japan ($709M) and the United States ($642M) were the countries with the highest levels of market value in 2023, together accounting for 38% of the global market. China, India, Germany, the UK, France, Brazil, Pakistan, Bangladesh and Indonesia lagged somewhat behind, together comprising a further 35%.
India, with a CAGR of -0.8%, recorded the highest growth rate of market size among the main consuming countries over the period under review, while market for the other global leaders experienced a decline in the market figures.
In 2023, the highest levels of patent leather per capita consumption was registered in Italy (949 square meters per 1000 persons), followed by Germany (113 square meters per 1000 persons), the United States (111 square meters per 1000 persons) and the UK (97 square meters per 1000 persons), while the world average per capita consumption of patent leather was estimated at 47 square meters per 1000 persons.
From 2013 to 2023, the average annual growth rate of the patent leather per capita consumption in Italy stood at -3.8%. In the other countries, the average annual rates were as follows: Germany (-4.4% per year) and the United States (+0.3% per year).
Production
World Production of Patent Leather, Patent Laminated Leather and Metallised Leather
Global patent leather production contracted modestly to 375M square meters in 2023, with a decrease of -3.3% on the previous year. Overall, production recorded a pronounced downturn. The growth pace was the most rapid in 2014 when the production volume increased by 8.8%. As a result, production reached the peak volume of 528M square meters. From 2015 to 2023, global production growth failed to regain momentum.
In value terms, patent leather production fell slightly to $7.4B in 2023 estimated in export price. In general, production continues to indicate a mild slump. The growth pace was the most rapid in 2015 when the production volume increased by 21%. Over the period under review, global production hit record highs at $11B in 2016; however, from 2017 to 2023, production stood at a somewhat lower figure.
Production By Country
The countries with the highest volumes of production in 2023 were Italy (63M square meters), China (59M square meters) and the United States (38M square meters), together accounting for 43% of global production.
From 2013 to 2023, the most notable rate of growth in terms of production, amongst the key producing countries, was attained by China (with a CAGR of +1.4%), while production for the other global leaders experienced more modest paces of growth.
Imports
World Imports of Patent Leather, Patent Laminated Leather and Metallised Leather
For the sixth consecutive year, the global market recorded decline in supplies from abroad of patent leather, patent laminated leather and metallised leather, which decreased by -12.6% to 15M square meters in 2023. Over the period under review, imports recorded a deep reduction. The growth pace was the most rapid in 2017 when imports increased by 5.5% against the previous year. Global imports peaked at 29M square meters in 2014; however, from 2015 to 2023, imports remained at a lower figure.
In value terms, patent leather imports declined to $258M in 2023. In general, imports continue to indicate a deep setback. The pace of growth was the most pronounced in 2022 when imports increased by 6.2% against the previous year. Over the period under review, global imports attained the peak figure at $596M in 2014; however, from 2015 to 2023, imports remained at a lower figure.
Imports By Country
Tunisia (2.5M square meters) and Vietnam (1.9M square meters) represented the major importers of patent leather, patent laminated leather and metallised leather in 2023, accounting for approx. 17% and 13% of total imports, respectively. China (1,125K square meters) held the next position in the ranking, followed by Indonesia (1,077K square meters), Romania (929K square meters) and Portugal (749K square meters). All these countries together held near 27% share of total imports. Morocco (610K square meters), Italy (460K square meters), Albania (459K square meters), Serbia (439K square meters), Mexico (415K square meters), Spain (395K square meters) and Chile (385K square meters) followed a long way behind the leaders.
From 2013 to 2023, the most notable rate of growth in terms of purchases, amongst the leading importing countries, was attained by Chile (with a CAGR of +59.5%), while imports for the other global leaders experienced more modest paces of growth.
In value terms, Tunisia ($42M), Vietnam ($32M) and China ($32M) constituted the countries with the highest levels of imports in 2023, together accounting for 41% of global imports. Romania, Indonesia, Portugal, Morocco, Spain, Mexico, Serbia, Albania, Italy and Chile lagged somewhat behind, together accounting for a further 37%.
Chile, with a CAGR of +27.8%, saw the highest growth rate of the value of imports, among the main importing countries over the period under review, while purchases for the other global leaders experienced more modest paces of growth.
Import Prices By Country
The average patent leather import price stood at $18 per square meter in 2023, increasing by 5.5% against the previous year. Over the period under review, the import price, however, saw a mild setback. The most prominent rate of growth was recorded in 2022 when the average import price increased by 11%. Over the period under review, average import prices hit record highs at $20 per square meter in 2014; however, from 2015 to 2023, import prices remained at a lower figure.
There were significant differences in the average prices amongst the major importing countries. In 2023, amid the top importers, the country with the highest price was China ($28 per square meter), while Chile ($3.7 per square meter) was amongst the lowest.
From 2013 to 2023, the most notable rate of growth in terms of prices was attained by Albania (+8.3%), while the other global leaders experienced more modest paces of growth.
Exports
World Exports of Patent Leather, Patent Laminated Leather and Metallised Leather
In 2023, overseas shipments of patent leather, patent laminated leather and metallised leather decreased by -11% to 15M square meters, falling for the eighth year in a row after three years of growth. In general, exports, however, continue to indicate a relatively flat trend pattern. The pace of growth was the most pronounced in 2015 when exports increased by 92%. As a result, the exports reached the peak of 32M square meters. From 2016 to 2023, the growth of the global exports remained at a somewhat lower figure.
In value terms, patent leather exports declined to $308M in 2023. Over the period under review, exports, however, saw a measured increase. The pace of growth was the most pronounced in 2015 when exports increased by 126%. As a result, the exports attained the peak of $591M. From 2016 to 2023, the growth of the global exports remained at a lower figure.
Exports By Country
Italy represented the major exporting country with an export of about 7.8M square meters, which reached 51% of total exports. South Korea (2.6M square meters) held a 17% share (based on physical terms) of total exports, which put it in second place, followed by Taiwan (Chinese) (5.6%) and Vietnam (5.6%). The following exporters - Spain (664K square meters), China (492K square meters), the United States (481K square meters), Tunisia (345K square meters) and Morocco (313K square meters) - together made up 15% of total exports.
Exports from Italy decreased at an average annual rate of -7.9% from 2013 to 2023. At the same time, Spain (+24.8%), Vietnam (+22.7%), Tunisia (+2.9%) and Morocco (+2.8%) displayed positive paces of growth. Moreover, Spain emerged as the fastest-growing exporter exported in the world, with a CAGR of +24.8% from 2013-2023. Taiwan (Chinese) experienced a relatively flat trend pattern. By contrast, the United States (-3.9%), China (-4.3%) and South Korea (-9.7%) illustrated a downward trend over the same period. While the share of Italy (+51 p.p.), Vietnam (+4.8 p.p.) and Spain (+3.9 p.p.) increased significantly in terms of the global exports from 2013-2023, the share of the United States (-1.6 p.p.), China (-1.8 p.p.) and South Korea (-30 p.p.) displayed negative dynamics. The shares of the other countries remained relatively stable throughout the analyzed period.
In value terms, Italy ($193M) remains the largest patent leather supplier worldwide, comprising 62% of global exports. The second position in the ranking was held by South Korea ($36M), with a 12% share of global exports. It was followed by Taiwan (Chinese), with a 3.5% share.
In Italy, patent leather exports plunged by an average annual rate of -6.8% over the period from 2013-2023. The remaining exporting countries recorded the following average annual rates of exports growth: South Korea (-9.8% per year) and Taiwan (Chinese) (+0.6% per year).
Export Prices By Country
In 2023, the average patent leather export price amounted to $20 per square meter, surging by 6.6% against the previous year. Over the last decade, it increased at an average annual rate of +2.7%. The growth pace was the most rapid in 2021 an increase of 33%. Over the period under review, the average export prices reached the maximum in 2023 and is likely to continue growth in the immediate term.
There were significant differences in the average prices amongst the major exporting countries. In 2023, amid the top suppliers, the country with the highest price was Morocco ($30 per square meter), while Spain ($10 per square meter) was amongst the lowest.
From 2013 to 2023, the most notable rate of growth in terms of prices was attained by Tunisia (+5.1%), while the other global leaders experienced more modest paces of growth.
This report provides an in-depth analysis of the global patent leather market. Within it, you will discover the latest data on market trends and opportunities by country, consumption, production and price developments, as well as the global trade (imports and exports). The forecast exhibits the market prospects through 2030.
Product coverage:
- Prodcom 15112200 - Patent leather, patent laminated leather and metallised leather
Country coverage:
Worldwide - the report contains statistical data for 200 countries and includes detailed profiles of the 50 largest consuming countries:
- USA
- China
- Japan
- Germany
- United Kingdom
- France
- Brazil
- Italy
- Russian Federation
- India
- Canada
- Australia
- Republic of Korea
- Spain
- Mexico
- Indonesia
- Netherlands
- Turkey
- Saudi Arabia
- Switzerland
- Sweden
- Nigeria
- Poland
- Belgium
- Argentina
- Norway
- Austria
- Thailand
- United Arab Emirates
- Colombia
- Denmark
- South Africa
- Malaysia
- Israel
- Singapore
- Egypt
- Philippines
- Finland
- Chile
- Ireland
- Pakistan
- Greece
- Portugal
- Kazakhstan
- Algeria
- Czech Republic
- Qatar
- Peru
- Romania
- Vietnam
+ the largest producing countries
Data coverage:
- Global market volume and value
- Per Capita consumption
- Forecast of the market dynamics in the medium term
- Global production, split by region and country
- Global trade (exports and imports)
- Export and import prices
- Market trends, drivers and restraints
- Key market players and their profiles
Reasons to buy this report:
- Take advantage of the latest data
- Find deeper insights into current market developments
- Discover vital success factors affecting the market
This report is designed for manufacturers, distributors, importers, and wholesalers, as well as for investors, consultants and advisors.
In this report, you can find information that helps you to make informed decisions on the following issues:
- How to diversify your business and benefit from new market opportunities
- How to load your idle production capacity
- How to boost your sales on overseas markets
- How to increase your profit margins
- How to make your supply chain more sustainable
- How to reduce your production and supply chain costs
- How to outsource production to other countries
- How to prepare your business for global expansion
While doing this research, we combine the accumulated expertise of our analysts and the capabilities of artificial intelligence. The AI-based platform, developed by our data scientists, constitutes the key working tool for business analysts, empowering them to discover deep insights and ideas from the marketing data.
-
1. INTRODUCTION
Making Data-Driven Decisions to Grow Your Business
- REPORT DESCRIPTION
- RESEARCH METHODOLOGY AND AI PLATFORM
- DATA-DRIVEN DECISIONS FOR YOUR BUSINESS
- GLOSSARY AND SPECIFIC TERMS
-
2. EXECUTIVE SUMMARY
A Quick Overview of Market Performance
- KEY FINDINGS
- MARKET TRENDS This Chapter is Available Only for the Professional Edition PRO
-
3. MARKET OVERVIEW
Understanding the Current State of The Market and Its Prospects
- MARKET SIZE
- CONSUMPTION BY COUNTRY
- MARKET FORECAST TO 2030
-
4. MOST PROMISING PRODUCT
Finding New Products to Diversify Your Business
This Chapter is Available Only for the Professional Edition PRO- TOP PRODUCTS TO DIVERSIFY YOUR BUSINESS
- BEST-SELLING PRODUCTS
- MOST CONSUMED PRODUCT
- MOST TRADED PRODUCT
- MOST PROFITABLE PRODUCT FOR EXPORT
-
5. MOST PROMISING SUPPLYING COUNTRIES
Choosing the Best Countries to Establish Your Sustainable Supply Chain
This Chapter is Available Only for the Professional Edition PRO- TOP COUNTRIES TO SOURCE YOUR PRODUCT
- TOP PRODUCING COUNTRIES
- TOP EXPORTING COUNTRIES
- LOW-COST EXPORTING COUNTRIES
-
6. MOST PROMISING OVERSEAS MARKETS
Choosing the Best Countries to Boost Your Exports
This Chapter is Available Only for the Professional Edition PRO- TOP OVERSEAS MARKETS FOR EXPORTING YOUR PRODUCT
- TOP CONSUMING MARKETS
- UNSATURATED MARKETS
- TOP IMPORTING MARKETS
- MOST PROFITABLE MARKETS
7. GLOBAL PRODUCTION
The Latest Trends and Insights into The Industry
- PRODUCTION VOLUME AND VALUE
- PRODUCTION BY COUNTRY
8. GLOBAL IMPORTS
The Largest Importers on The Market and How They Succeed
- IMPORTS FROM 2012–2023
- IMPORTS BY COUNTRY
- IMPORT PRICES BY COUNTRY
9. GLOBAL EXPORTS
The Largest Exporters on The Market and How They Succeed
- EXPORTS FROM 2012–2023
- EXPORTS BY COUNTRY
- EXPORT PRICES BY COUNTRY
-
10. PROFILES OF MAJOR PRODUCERS
The Largest Producers on The Market and Their Profiles
This Chapter is Available Only for the Professional Edition PRO -
11. COUNTRY PROFILES
The Largest Markets And Their Profiles
This Chapter is Available Only for the Professional Edition PRO- United States
- China
- Japan
- Germany
- United Kingdom
- France
- Brazil
- Italy
- Russian Federation
- India
- Canada
- Australia
- Republic of Korea
- Spain
- Mexico
- Indonesia
- Netherlands
- Turkey
- Saudi Arabia
- Switzerland
- Sweden
- Nigeria
- Poland
- Belgium
- Argentina
- Norway
- Austria
- Thailand
- United Arab Emirates
- Colombia
- Denmark
- South Africa
- Malaysia
- Israel
- Singapore
- Egypt
- Philippines
- Finland
- Chile
- Ireland
- Pakistan
- Greece
- Portugal
- Kazakhstan
- Algeria
- Czech Republic
- Qatar
- Peru
- Romania
- Vietnam
-
LIST OF TABLES
- Key Findings In 2023
- Market Volume, In Physical Terms, 2012–2023
- Market Value, 2012–2023
- Per Capita Consumption, By Country, 2018–2023
- Production, In Physical Terms, By Country, 2012–2023
- Imports, In Physical Terms, By Country, 2012–2023
- Imports, In Value Terms, By Country, 2012–2023
- Import Prices, By Country Of Destination, 2012–2023
- Exports, In Physical Terms, By Country, 2012–2023
- Exports, In Value Terms, By Country, 2012–2023
- Export Prices, By Country Of Origin, 2012–2023
-
LIST OF FIGURES
- Market Volume, In Physical Terms, 2012–2023
- Market Value, 2012–2023
- Consumption, By Country, 2023
- Market Volume Forecast to 2030
- Market Value Forecast to 2030
- Products: Market Size And Growth, By Type
- Products: Average Per Capita Consumption, By Type
- Products: Exports And Growth, By Type
- Products: Export Prices And Growth, By Type
- Production Volume And Growth
- Exports And Growth
- Export Prices And Growth
- Market Size And Growth
- Per Capita Consumption
- Imports And Growth
- Import Prices
- Production, In Physical Terms, 2012–2023
- Production, In Value Terms, 2012–2023
- Production, By Country, 2023
- Production, In Physical Terms, By Country, 2012–2023
- Imports, In Physical Terms, 2012–2023
- Imports, In Value Terms, 2012–2023
- Imports, In Physical Terms, By Country, 2023
- Imports, In Physical Terms, By Country, 2012–2023
- Imports, In Value Terms, By Country, 2012–2023
- Import Prices, By Country, 2012–2023
- Exports, In Physical Terms, 2012–2023
- Exports, In Value Terms, 2012–2023
- Exports, In Physical Terms, By Country, 2023
- Exports, In Physical Terms, By Country, 2012–2023
- Exports, In Value Terms, By Country, 2012–2023
- Export Prices, 2012–2023


