
World - Personal Weighing Machines - Market Analysis, Forecast, Size, Trends And Insights
Get instant access to more than 2 million reports, dashboards, and datasets on the IndexBox Platform.
View PricingGlobal Personal Weighing Machines Market to Witness Steady Growth with CAGR of +1.7% through 2030
IndexBox has just published a new report: World - Personal Weighing Machines - Market Analysis, Forecast, Size, Trends And Insights.
The global market for personal weighing machines is expected to see steady growth, with a projected increase in market volume to 328M units and market value to $2.9B by the end of 2030. Anticipated CAGR rates suggest a positive outlook for the industry, driven by increasing demand worldwide.
Market Forecast
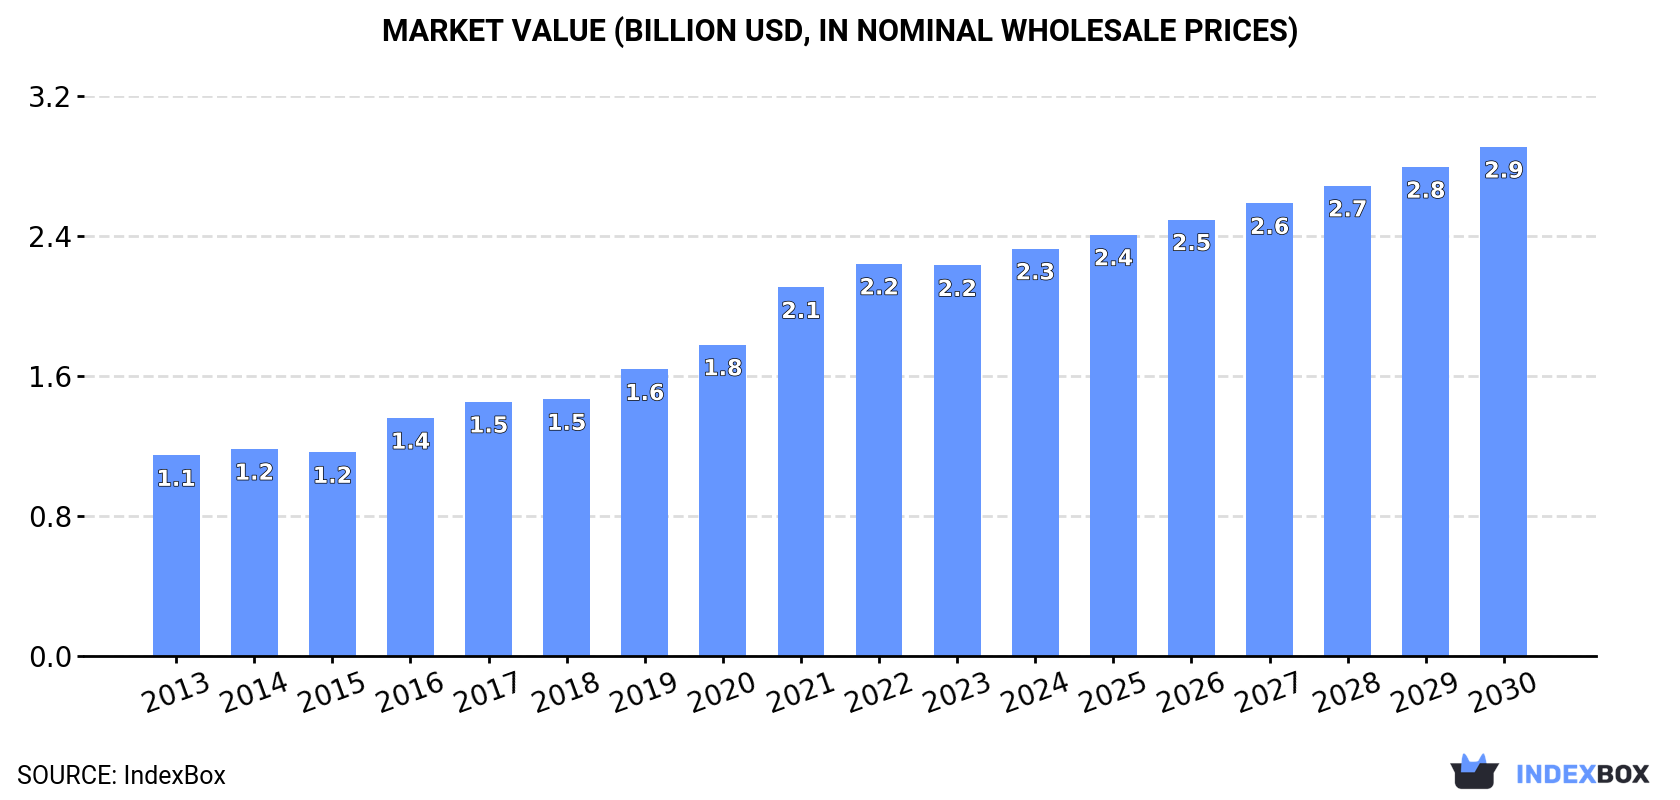
Driven by increasing demand for personal weighing machines worldwide, the market is expected to continue an upward consumption trend over the next seven years. Market performance is forecast to decelerate, expanding with an anticipated CAGR of +1.7% for the period from 2023 to 2030, which is projected to bring the market volume to 328M units by the end of 2030.
In value terms, the market is forecast to increase with an anticipated CAGR of +3.9% for the period from 2023 to 2030, which is projected to bring the market value to $2.9B (in nominal wholesale prices) by the end of 2030.
Consumption
World Consumption of Personal Weighing Machines
In 2023, approx. 291M units of personal weighing machines were consumed worldwide; stabilizing at the year before. Over the period under review, consumption showed a buoyant increase. Global consumption peaked in 2023 and is likely to see gradual growth in the near future.
The global personal weighing machine market value reduced modestly to $2.2B in 2023, approximately reflecting the previous year. This figure reflects the total revenues of producers and importers (excluding logistics costs, retail marketing costs, and retailers' margins, which will be included in the final consumer price). Overall, the total consumption indicated a resilient increase from 2013 to 2023: its value increased at an average annual rate of +6.9% over the last decade. The trend pattern, however, indicated some noticeable fluctuations being recorded throughout the analyzed period. Based on 2023 figures, consumption increased by +94.5% against 2013 indices. Over the period under review, the global market reached the peak level at $2.2B in 2022, and then fell modestly in the following year.
Consumption By Country
China (97M units) remains the largest personal weighing machine consuming country worldwide, comprising approx. 34% of total volume. Moreover, personal weighing machine consumption in China exceeded the figures recorded by the second-largest consumer, the United States (37M units), threefold. The third position in this ranking was held by India (26M units), with an 8.8% share.
In China, personal weighing machine consumption increased at an average annual rate of +10.7% over the period from 2013-2023. The remaining consuming countries recorded the following average annual rates of consumption growth: the United States (+6.8% per year) and India (+5.9% per year).
In value terms, the largest personal weighing machine markets worldwide were China ($567M), India ($284M) and the United States ($230M), together accounting for 48% of the global market.
Among the main consuming countries, China, with a CAGR of +11.3%, recorded the highest growth rate of market size over the period under review, while market for the other global leaders experienced more modest paces of growth.
The countries with the highest levels of personal weighing machine per capita consumption in 2023 were the United States (109 units per 1000 persons), South Korea (98 units per 1000 persons) and Germany (95 units per 1000 persons).
From 2013 to 2023, the most notable rate of growth in terms of consumption, amongst the leading consuming countries, was attained by Brazil (with a CAGR of +13.7%), while consumption for the other global leaders experienced more modest paces of growth.
Production
World Production of Personal Weighing Machines
Global personal weighing machine production reached 319M units in 2023, surging by 3.4% compared with the previous year. In general, production posted a strong expansion. The pace of growth was the most pronounced in 2018 when the production volume increased by 39%. Global production peaked at 330M units in 2021; however, from 2022 to 2023, production remained at a lower figure.
In value terms, personal weighing machine production expanded modestly to $2.5B in 2023 estimated in export price. Over the period under review, production posted a buoyant increase. The pace of growth was the most pronounced in 2019 with an increase of 32% against the previous year. Global production peaked in 2023 and is likely to continue growth in the near future.
Production By Country
The country with the largest volume of personal weighing machine production was China (262M units), accounting for 82% of total volume. Moreover, personal weighing machine production in China exceeded the figures recorded by the second-largest producer, India (15M units), more than tenfold.
In China, personal weighing machine production expanded at an average annual rate of +7.4% over the period from 2013-2023. In the other countries, the average annual rates were as follows: India (+1.2% per year) and Japan (+12.3% per year).
Imports
World Imports of Personal Weighing Machines
In 2023, global imports of personal weighing machines rose significantly to 168M units, growing by 10% against the previous year's figure. In general, total imports indicated a prominent expansion from 2013 to 2023: its volume increased at an average annual rate of +5.4% over the last decade. The trend pattern, however, indicated some noticeable fluctuations being recorded throughout the analyzed period. Based on 2023 figures, imports decreased by -14.0% against 2021 indices. The pace of growth was the most pronounced in 2020 with an increase of 20%. Over the period under review, global imports attained the peak figure at 196M units in 2021; however, from 2022 to 2023, imports remained at a lower figure.
In value terms, personal weighing machine imports reduced modestly to $1B in 2023. Overall, total imports indicated pronounced growth from 2013 to 2023: its value increased at an average annual rate of +2.9% over the last decade. The trend pattern, however, indicated some noticeable fluctuations being recorded throughout the analyzed period. Based on 2023 figures, imports decreased by -22.6% against 2021 indices. The most prominent rate of growth was recorded in 2020 with an increase of 21%. Global imports peaked at $1.3B in 2021; however, from 2022 to 2023, imports remained at a lower figure.
Imports By Country
In 2023, the United States (37M units) represented the main importer of personal weighing machines, making up 22% of total imports. India (10M units) ranks second in terms of the total imports with a 6.2% share, followed by Brazil (6%), Russia (5.9%), Germany (5.1%) and Greece (4.6%). France (6.7M units), Japan (5.5M units), the UK (5.3M units), Italy (3.9M units), the Netherlands (3.8M units), Poland (3.8M units) and Spain (3.4M units) followed a long way behind the leaders.
From 2013 to 2023, average annual rates of growth with regard to personal weighing machine imports into the United States stood at +6.8%. At the same time, Greece (+33.6%), India (+24.7%), Brazil (+14.2%), Poland (+10.1%), Russia (+8.8%), Japan (+6.8%), Spain (+2.2%) and France (+1.6%) displayed positive paces of growth. Moreover, Greece emerged as the fastest-growing importer imported in the world, with a CAGR of +33.6% from 2013-2023. Italy experienced a relatively flat trend pattern. By contrast, the Netherlands (-1.4%), Germany (-2.2%) and the UK (-3.3%) illustrated a downward trend over the same period. From 2013 to 2023, the share of India, Greece, Brazil, the United States, Italy and Russia increased by +5, +4.1, +3.3, +2.8, +2.3 and +1.6 percentage points, respectively. The shares of the other countries remained relatively stable throughout the analyzed period.
In value terms, the United States ($218M) constitutes the largest market for imported personal weighing machines worldwide, comprising 22% of global imports. The second position in the ranking was taken by Germany ($80M), with a 7.9% share of global imports. It was followed by France, with a 6.3% share.
From 2013 to 2023, the average annual growth rate of value in the United States stood at +3.4%. The remaining importing countries recorded the following average annual rates of imports growth: Germany (-0.7% per year) and France (+2.8% per year).
Import Prices By Country
The average personal weighing machine import price stood at $6 per unit in 2023, which is down by -12.9% against the previous year. Over the period under review, the import price saw a perceptible decline. The growth pace was the most rapid in 2022 when the average import price increased by 3.2% against the previous year. Global import price peaked at $7.7 per unit in 2015; however, from 2016 to 2023, import prices failed to regain momentum.
There were significant differences in the average prices amongst the major importing countries. In 2023, amid the top importers, the country with the highest price was France ($9.5 per unit), while Brazil ($919 per thousand units) was amongst the lowest.
From 2013 to 2023, the most notable rate of growth in terms of prices was attained by Poland (+4.1%), while the other global leaders experienced more modest paces of growth.
Exports
World Exports of Personal Weighing Machines
Global personal weighing machine exports expanded markedly to 197M units in 2023, increasing by 13% compared with the previous year. Overall, exports enjoyed a strong increase. The most prominent rate of growth was recorded in 2018 with an increase of 56% against the previous year. Over the period under review, the global exports reached the peak figure at 245M units in 2021; however, from 2022 to 2023, the exports remained at a lower figure.
In value terms, personal weighing machine exports amounted to $1.3B in 2023. In general, exports showed resilient growth. The growth pace was the most rapid in 2020 with an increase of 54% against the previous year. Over the period under review, the global exports attained the maximum at $1.7B in 2021; however, from 2022 to 2023, the exports failed to regain momentum.
Exports By Country
China dominates exports structure, recording 165M units, which was near 84% of total exports in 2023. The following exporters - Greece (6.8M units), Germany (5.2M units), the Netherlands (3.8M units) and Poland (3.8M units) - together made up 9.9% of total exports.
From 2013 to 2023, average annual rates of growth with regard to personal weighing machine exports from China stood at +5.9%. At the same time, Greece (+74.8%), Poland (+36.4%), the Netherlands (+5.4%) and Germany (+1.1%) displayed positive paces of growth. Moreover, Greece emerged as the fastest-growing exporter exported in the world, with a CAGR of +74.8% from 2013-2023. From 2013 to 2023, the share of Greece and Poland increased by +3.4 and +1.8 percentage points, respectively. The shares of the other countries remained relatively stable throughout the analyzed period.
In value terms, China ($936M) remains the largest personal weighing machine supplier worldwide, comprising 73% of global exports. The second position in the ranking was taken by Germany ($80M), with a 6.2% share of global exports. It was followed by the Netherlands, with a 3.4% share.
In China, personal weighing machine exports increased at an average annual rate of +7.1% over the period from 2013-2023. In the other countries, the average annual rates were as follows: Germany (-0.1% per year) and the Netherlands (+4.1% per year).
Export Prices By Country
In 2023, the average personal weighing machine export price amounted to $6.5 per unit, shrinking by -11% against the previous year. Over the period under review, the export price showed a relatively flat trend pattern. The most prominent rate of growth was recorded in 2015 when the average export price increased by 47% against the previous year. The global export price peaked at $12 per unit in 2016; however, from 2017 to 2023, the export prices stood at a somewhat lower figure.
There were significant differences in the average prices amongst the major exporting countries. In 2023, amid the top suppliers, the country with the highest price was Germany ($15 per unit), while Greece ($1.3 per unit) was amongst the lowest.
From 2013 to 2023, the most notable rate of growth in terms of prices was attained by Poland (+1.9%), while the other global leaders experienced mixed trends in the export price figures.
This report provides an in-depth analysis of the global personal weighing machine market. Within it, you will discover the latest data on market trends and opportunities by country, consumption, production and price developments, as well as the global trade (imports and exports). The forecast exhibits the market prospects through 2030.
Product coverage:
- Prodcom 28293200 - Personal weighing machines, including baby scales, h ousehold scales
Country coverage:
Worldwide - the report contains statistical data for 200 countries and includes detailed profiles of the 50 largest consuming countries:
- USA
- China
- Japan
- Germany
- United Kingdom
- France
- Brazil
- Italy
- Russian Federation
- India
- Canada
- Australia
- Republic of Korea
- Spain
- Mexico
- Indonesia
- Netherlands
- Turkey
- Saudi Arabia
- Switzerland
- Sweden
- Nigeria
- Poland
- Belgium
- Argentina
- Norway
- Austria
- Thailand
- United Arab Emirates
- Colombia
- Denmark
- South Africa
- Malaysia
- Israel
- Singapore
- Egypt
- Philippines
- Finland
- Chile
- Ireland
- Pakistan
- Greece
- Portugal
- Kazakhstan
- Algeria
- Czech Republic
- Qatar
- Peru
- Romania
- Vietnam
+ the largest producing countries
Data coverage:
- Global market volume and value
- Per Capita consumption
- Forecast of the market dynamics in the medium term
- Global production, split by region and country
- Global trade (exports and imports)
- Export and import prices
- Market trends, drivers and restraints
- Key market players and their profiles
Reasons to buy this report:
- Take advantage of the latest data
- Find deeper insights into current market developments
- Discover vital success factors affecting the market
This report is designed for manufacturers, distributors, importers, and wholesalers, as well as for investors, consultants and advisors.
In this report, you can find information that helps you to make informed decisions on the following issues:
- How to diversify your business and benefit from new market opportunities
- How to load your idle production capacity
- How to boost your sales on overseas markets
- How to increase your profit margins
- How to make your supply chain more sustainable
- How to reduce your production and supply chain costs
- How to outsource production to other countries
- How to prepare your business for global expansion
While doing this research, we combine the accumulated expertise of our analysts and the capabilities of artificial intelligence. The AI-based platform, developed by our data scientists, constitutes the key working tool for business analysts, empowering them to discover deep insights and ideas from the marketing data.
-
1. INTRODUCTION
Making Data-Driven Decisions to Grow Your Business
- REPORT DESCRIPTION
- RESEARCH METHODOLOGY AND AI PLATFORM
- DATA-DRIVEN DECISIONS FOR YOUR BUSINESS
- GLOSSARY AND SPECIFIC TERMS
-
2. EXECUTIVE SUMMARY
A Quick Overview of Market Performance
- KEY FINDINGS
- MARKET TRENDS This Chapter is Available Only for the Professional Edition PRO
-
3. MARKET OVERVIEW
Understanding the Current State of The Market and Its Prospects
- MARKET SIZE
- CONSUMPTION BY COUNTRY
- MARKET FORECAST TO 2030
-
4. MOST PROMISING PRODUCT
Finding New Products to Diversify Your Business
This Chapter is Available Only for the Professional Edition PRO- TOP PRODUCTS TO DIVERSIFY YOUR BUSINESS
- BEST-SELLING PRODUCTS
- MOST CONSUMED PRODUCT
- MOST TRADED PRODUCT
- MOST PROFITABLE PRODUCT FOR EXPORT
-
5. MOST PROMISING SUPPLYING COUNTRIES
Choosing the Best Countries to Establish Your Sustainable Supply Chain
This Chapter is Available Only for the Professional Edition PRO- TOP COUNTRIES TO SOURCE YOUR PRODUCT
- TOP PRODUCING COUNTRIES
- TOP EXPORTING COUNTRIES
- LOW-COST EXPORTING COUNTRIES
-
6. MOST PROMISING OVERSEAS MARKETS
Choosing the Best Countries to Boost Your Exports
This Chapter is Available Only for the Professional Edition PRO- TOP OVERSEAS MARKETS FOR EXPORTING YOUR PRODUCT
- TOP CONSUMING MARKETS
- UNSATURATED MARKETS
- TOP IMPORTING MARKETS
- MOST PROFITABLE MARKETS
7. GLOBAL PRODUCTION
The Latest Trends and Insights into The Industry
- PRODUCTION VOLUME AND VALUE
- PRODUCTION BY COUNTRY
8. GLOBAL IMPORTS
The Largest Importers on The Market and How They Succeed
- IMPORTS FROM 2012–2023
- IMPORTS BY COUNTRY
- IMPORT PRICES BY COUNTRY
9. GLOBAL EXPORTS
The Largest Exporters on The Market and How They Succeed
- EXPORTS FROM 2012–2023
- EXPORTS BY COUNTRY
- EXPORT PRICES BY COUNTRY
-
10. PROFILES OF MAJOR PRODUCERS
The Largest Producers on The Market and Their Profiles
This Chapter is Available Only for the Professional Edition PRO -
11. COUNTRY PROFILES
The Largest Markets And Their Profiles
This Chapter is Available Only for the Professional Edition PRO- United States
- China
- Japan
- Germany
- United Kingdom
- France
- Brazil
- Italy
- Russian Federation
- India
- Canada
- Australia
- Republic of Korea
- Spain
- Mexico
- Indonesia
- Netherlands
- Turkey
- Saudi Arabia
- Switzerland
- Sweden
- Nigeria
- Poland
- Belgium
- Argentina
- Norway
- Austria
- Thailand
- United Arab Emirates
- Colombia
- Denmark
- South Africa
- Malaysia
- Israel
- Singapore
- Egypt
- Philippines
- Finland
- Chile
- Ireland
- Pakistan
- Greece
- Portugal
- Kazakhstan
- Algeria
- Czech Republic
- Qatar
- Peru
- Romania
- Vietnam
-
LIST OF TABLES
- Key Findings In 2023
- Market Volume, In Physical Terms, 2012–2023
- Market Value, 2012–2023
- Per Capita Consumption, By Country, 2018–2023
- Production, In Physical Terms, By Country, 2012–2023
- Imports, In Physical Terms, By Country, 2012–2023
- Imports, In Value Terms, By Country, 2012–2023
- Import Prices, By Country Of Destination, 2012–2023
- Exports, In Physical Terms, By Country, 2012–2023
- Exports, In Value Terms, By Country, 2012–2023
- Export Prices, By Country Of Origin, 2012–2023
-
LIST OF FIGURES
- Market Volume, In Physical Terms, 2012–2023
- Market Value, 2012–2023
- Consumption, By Country, 2023
- Market Volume Forecast to 2030
- Market Value Forecast to 2030
- Products: Market Size And Growth, By Type
- Products: Average Per Capita Consumption, By Type
- Products: Exports And Growth, By Type
- Products: Export Prices And Growth, By Type
- Production Volume And Growth
- Exports And Growth
- Export Prices And Growth
- Market Size And Growth
- Per Capita Consumption
- Imports And Growth
- Import Prices
- Production, In Physical Terms, 2012–2023
- Production, In Value Terms, 2012–2023
- Production, By Country, 2023
- Production, In Physical Terms, By Country, 2012–2023
- Imports, In Physical Terms, 2012–2023
- Imports, In Value Terms, 2012–2023
- Imports, In Physical Terms, By Country, 2023
- Imports, In Physical Terms, By Country, 2012–2023
- Imports, In Value Terms, By Country, 2012–2023
- Import Prices, By Country, 2012–2023
- Exports, In Physical Terms, 2012–2023
- Exports, In Value Terms, 2012–2023
- Exports, In Physical Terms, By Country, 2023
- Exports, In Physical Terms, By Country, 2012–2023
- Exports, In Value Terms, By Country, 2012–2023
- Export Prices, 2012–2023


