
World - Plastic Fittings For Furniture - Market Analysis, Forecast, Size, Trends And Insights
Get instant access to more than 2 million reports, dashboards, and datasets on the IndexBox Platform.
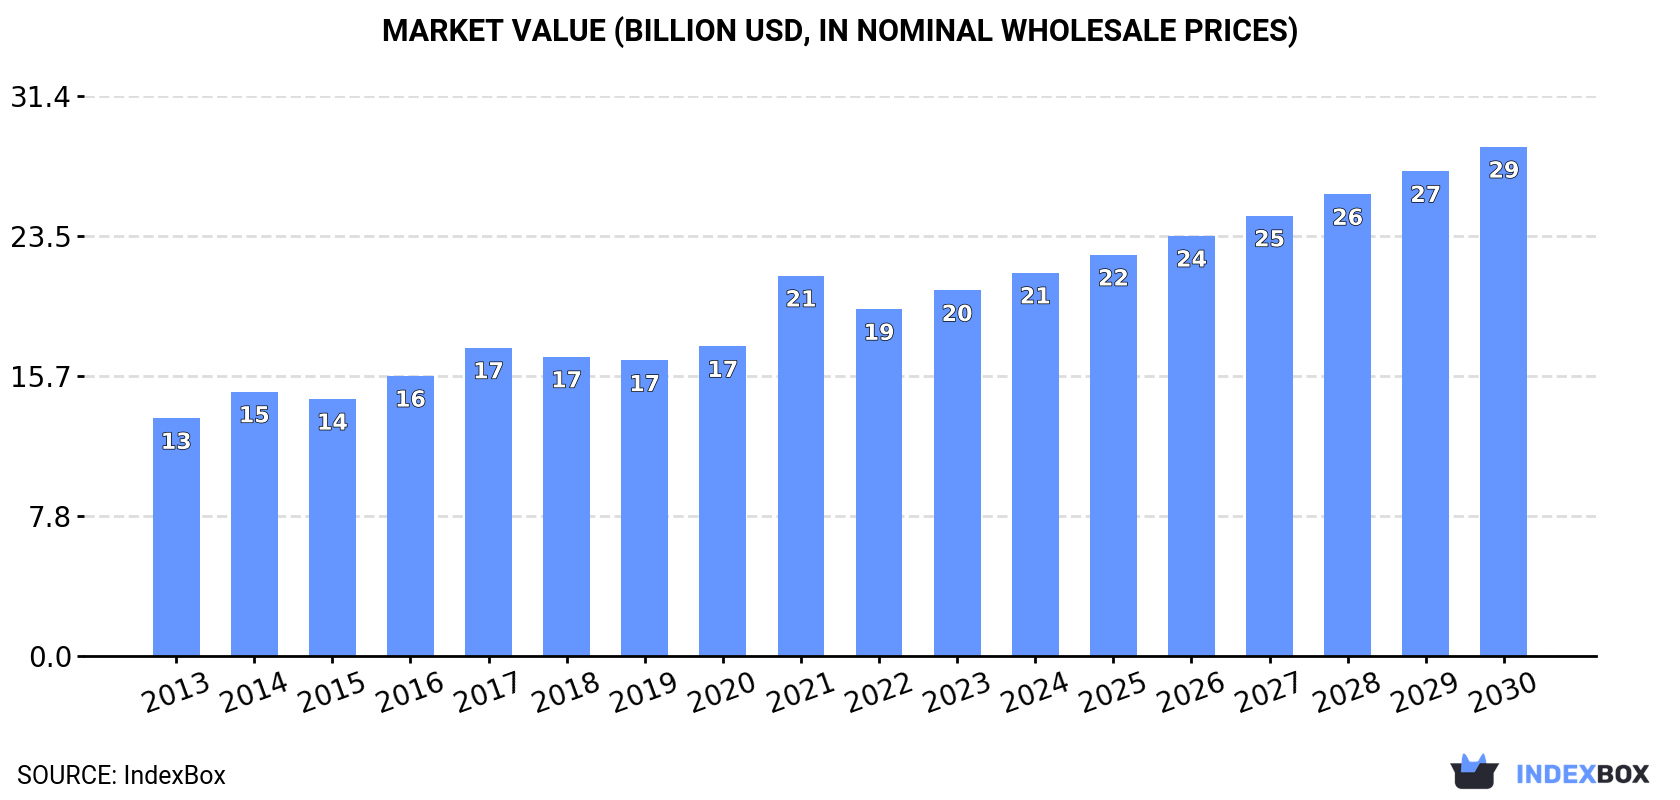
View PricingGlobal Plastic Fittings for Furniture Market to Reach 2.7M Tons in Volume and $28.5B in Value by 2030
IndexBox has just published a new report: World - Plastic Fittings For Furniture - Market Analysis, Forecast, Size, Trends And Insights.
The demand for plastic fittings for furniture is on the rise worldwide, leading to a positive outlook for the market from 2023 to 2030. With a projected CAGR of +3.0% in volume and +4.8% in value, market performance is expected to maintain its upward trend. This growth is driven by factors such as increased urbanization, changing consumer preferences, and the growing furniture industry.
Market Forecast
Driven by increasing demand for plastic fittings for furniture worldwide, the market is expected to continue an upward consumption trend over the next seven years. Market performance is forecast to retain its current trend pattern, expanding with an anticipated CAGR of +3.0% for the period from 2023 to 2030, which is projected to bring the market volume to 2.7M tons by the end of 2030.
In value terms, the market is forecast to increase with an anticipated CAGR of +4.8% for the period from 2023 to 2030, which is projected to bring the market value to $28.5B (in nominal wholesale prices) by the end of 2030.
Consumption
World Consumption of Plastic Fittings For Furniture
In 2023, the amount of plastic fittings for furniture consumed worldwide rose modestly to 2.2M tons, with an increase of 4.4% compared with 2022 figures. The total consumption volume increased at an average annual rate of +3.3% from 2013 to 2023; however, the trend pattern indicated some noticeable fluctuations being recorded in certain years. As a result, consumption reached the peak volume of 2.3M tons. From 2022 to 2023, the growth of the global consumption remained at a lower figure.
The global plastic furniture fittings market revenue expanded remarkably to $20.5B in 2023, picking up by 5.4% against the previous year. This figure reflects the total revenues of producers and importers (excluding logistics costs, retail marketing costs, and retailers' margins, which will be included in the final consumer price). The market value increased at an average annual rate of +4.4% from 2013 to 2023; however, the trend pattern indicated some noticeable fluctuations being recorded throughout the analyzed period. As a result, consumption reached the peak level of $21.3B. From 2022 to 2023, the growth of the global market remained at a lower figure.
Consumption By Country
The countries with the highest volumes of consumption in 2023 were China (450K tons), the United States (226K tons) and India (163K tons), with a combined 38% share of global consumption. Russia, Japan, Brazil, the UK, Italy, Mexico, Turkey, South Korea, Canada and France lagged somewhat behind, together comprising a further 33%.
From 2013 to 2023, the most notable rate of growth in terms of consumption, amongst the key consuming countries, was attained by Mexico (with a CAGR of +18.5%), while consumption for the other global leaders experienced more modest paces of growth.
In value terms, the largest plastic furniture fittings markets worldwide were Japan ($2.8B), China ($2.4B) and the United States ($2.3B), with a combined 37% share of the global market. Brazil, Turkey, India, Russia, Mexico, South Korea, Canada, the UK, Italy and France lagged somewhat behind, together accounting for a further 29%.
Among the main consuming countries, Mexico, with a CAGR of +18.7%, saw the highest rates of growth with regard to market size over the period under review, while market for the other global leaders experienced more modest paces of growth.
The countries with the highest levels of plastic furniture fittings per capita consumption in 2023 were Canada (1,061 kg per 1000 persons), Italy (1,051 kg per 1000 persons) and Russia (1,046 kg per 1000 persons).
From 2013 to 2023, the most notable rate of growth in terms of consumption, amongst the main consuming countries, was attained by Mexico (with a CAGR of +17.2%), while consumption for the other global leaders experienced more modest paces of growth.
Production
World Production of Plastic Fittings For Furniture
In 2023, approx. 2.2M tons of plastic fittings for furniture were produced worldwide; surging by 4.2% on 2022 figures. The total output volume increased at an average annual rate of +3.5% over the period from 2013 to 2023; however, the trend pattern indicated some noticeable fluctuations being recorded throughout the analyzed period. The most prominent rate of growth was recorded in 2021 with an increase of 21% against the previous year. As a result, production attained the peak volume of 2.3M tons. From 2022 to 2023, global production growth remained at a lower figure.
In value terms, plastic furniture fittings production rose markedly to $18.1B in 2023 estimated in export price. The total output value increased at an average annual rate of +2.6% from 2013 to 2023; however, the trend pattern indicated some noticeable fluctuations being recorded in certain years. The most prominent rate of growth was recorded in 2021 when the production volume increased by 27% against the previous year. As a result, production reached the peak level of $19B. From 2022 to 2023, global production growth remained at a somewhat lower figure.
Production By Country
China (554K tons) remains the largest plastic furniture fittings producing country worldwide, comprising approx. 25% of total volume. Moreover, plastic furniture fittings production in China exceeded the figures recorded by the second-largest producer, the United States (168K tons), threefold. The third position in this ranking was held by India (162K tons), with a 7.4% share.
In China, plastic furniture fittings production expanded at an average annual rate of +7.4% over the period from 2013-2023. In the other countries, the average annual rates were as follows: the United States (+2.0% per year) and India (+6.4% per year).
Imports
World Imports of Plastic Fittings For Furniture
In 2023, the amount of plastic fittings for furniture imported worldwide rose sharply to 446K tons, increasing by 7.9% against the previous year. The total import volume increased at an average annual rate of +2.8% over the period from 2013 to 2023; however, the trend pattern indicated some noticeable fluctuations being recorded in certain years. The most prominent rate of growth was recorded in 2017 with an increase of 20% against the previous year. Over the period under review, global imports reached the maximum at 472K tons in 2018; however, from 2019 to 2023, imports remained at a lower figure.
In value terms, plastic furniture fittings imports rose markedly to $5.3B in 2023. The total import value increased at an average annual rate of +4.6% from 2013 to 2023; however, the trend pattern indicated some noticeable fluctuations being recorded throughout the analyzed period. The most prominent rate of growth was recorded in 2017 when imports increased by 21% against the previous year. Global imports peaked in 2023 and are likely to see steady growth in years to come.
Imports By Country
In 2023, the United States (87K tons), distantly followed by Germany (35K tons), Mexico (30K tons), the Czech Republic (25K tons), Poland (25K tons), Slovakia (23K tons) and Spain (22K tons) represented the key importers of plastic fittings for furniture, together mixing up 56% of total imports. The UK (14K tons), Vietnam (14K tons), France (14K tons), Canada (13K tons), Hungary (13K tons) and Belgium (7K tons) followed a long way behind the leaders.
From 2013 to 2023, average annual rates of growth with regard to plastic furniture fittings imports into the United States stood at +13.7%. At the same time, Vietnam (+29.9%), Spain (+11.2%), Mexico (+6.6%), the Czech Republic (+5.0%), Canada (+2.5%), France (+1.8%) and Hungary (+1.5%) displayed positive paces of growth. Moreover, Vietnam emerged as the fastest-growing importer imported in the world, with a CAGR of +29.9% from 2013-2023. Germany and the UK experienced a relatively flat trend pattern. By contrast, Poland (-2.2%), Belgium (-2.4%) and Slovakia (-5.8%) illustrated a downward trend over the same period. While the share of the United States (+12 p.p.), Vietnam (+2.8 p.p.), Spain (+2.7 p.p.) and Mexico (+2.1 p.p.) increased significantly in terms of the global imports from 2013-2023, the share of Germany (-1.8 p.p.), Poland (-3.6 p.p.) and Slovakia (-7.1 p.p.) displayed negative dynamics. The shares of the other countries remained relatively stable throughout the analyzed period.
In value terms, the United States ($847M), Germany ($799M) and Poland ($276M) were the countries with the highest levels of imports in 2023, together comprising 36% of global imports. Mexico, Slovakia, the Czech Republic, Vietnam, Hungary, Spain, France, the UK, Belgium and Canada lagged somewhat behind, together accounting for a further 37%.
In terms of the main importing countries, Vietnam, with a CAGR of +37.9%, recorded the highest rates of growth with regard to the value of imports, over the period under review, while purchases for the other global leaders experienced more modest paces of growth.
Import Prices By Country
In 2023, the average plastic furniture fittings import price amounted to $11,972 per ton, rising by 4.2% against the previous year. Over the period from 2013 to 2023, it increased at an average annual rate of +1.7%. The most prominent rate of growth was recorded in 2014 an increase of 12%. Global import price peaked in 2023 and is expected to retain growth in years to come.
There were significant differences in the average prices amongst the major importing countries. In 2023, amid the top importers, the country with the highest price was Germany ($23,069 per ton), while Canada ($8,410 per ton) was amongst the lowest.
From 2013 to 2023, the most notable rate of growth in terms of prices was attained by Slovakia (+8.3%), while the other global leaders experienced more modest paces of growth.
Exports
World Exports of Plastic Fittings For Furniture
In 2023, global plastic furniture fittings exports expanded remarkably to 453K tons, increasing by 6.3% on the previous year. The total export volume increased at an average annual rate of +3.6% from 2013 to 2023; however, the trend pattern indicated some noticeable fluctuations being recorded throughout the analyzed period. The most prominent rate of growth was recorded in 2018 with an increase of 16%. As a result, the exports reached the peak of 454K tons. From 2019 to 2023, the growth of the global exports remained at a somewhat lower figure.
In value terms, plastic furniture fittings exports rose rapidly to $5.4B in 2023. The total export value increased at an average annual rate of +4.3% over the period from 2013 to 2023; however, the trend pattern indicated some noticeable fluctuations being recorded in certain years. The pace of growth was the most pronounced in 2021 with an increase of 18% against the previous year. The global exports peaked in 2023 and are expected to retain growth in the immediate term.
Exports By Country
China (106K tons) and Poland (77K tons) represented the major exporters of plastic fittings for furniture in 2023, recording approx. 23% and 17% of total exports, respectively. Germany (35K tons) took a 7.8% share (based on physical terms) of total exports, which put it in second place, followed by the United States (6.5%), Slovakia (6.1%), the Czech Republic (5%) and Mexico (4.7%). France (15K tons), South Korea (14K tons), Portugal (11K tons), Hungary (10K tons), Italy (7.8K tons) and Japan (7.2K tons) held a relatively small share of total exports.
From 2013 to 2023, the most notable rate of growth in terms of shipments, amongst the main exporting countries, was attained by Mexico (with a CAGR of +15.6%), while the other global leaders experienced more modest paces of growth.
In value terms, Germany ($899M), Poland ($781M) and China ($688M) constituted the countries with the highest levels of exports in 2023, with a combined 44% share of global exports. The Czech Republic, Slovakia, France, the United States, South Korea, Mexico, Portugal, Hungary, Japan and Italy lagged somewhat behind, together accounting for a further 37%.
Among the main exporting countries, Mexico, with a CAGR of +15.9%, recorded the highest growth rate of the value of exports, over the period under review, while shipments for the other global leaders experienced more modest paces of growth.
Export Prices By Country
In 2023, the average plastic furniture fittings export price amounted to $11,950 per ton, picking up by 4.8% against the previous year. Over the period under review, the export price showed a relatively flat trend pattern. The pace of growth was the most pronounced in 2014 when the average export price increased by 6.3%. The global export price peaked in 2023 and is expected to retain growth in years to come.
There were significant differences in the average prices amongst the major exporting countries. In 2023, amid the top suppliers, the country with the highest price was Germany ($25,474 per ton), while China ($6,499 per ton) was amongst the lowest.
From 2013 to 2023, the most notable rate of growth in terms of prices was attained by the Czech Republic (+5.5%), while the other global leaders experienced more modest paces of growth.
This report provides an in-depth analysis of the global plastic furniture fittings market. Within it, you will discover the latest data on market trends and opportunities by country, consumption, production and price developments, as well as the global trade (imports and exports). The forecast exhibits the market prospects through 2030.
Product coverage:
- Prodcom 22292610 - Plastic fittings for furniture, coachwork or the like
Country coverage:
Worldwide - the report contains statistical data for 200 countries and includes detailed profiles of the 50 largest consuming countries:
- USA
- China
- Japan
- Germany
- United Kingdom
- France
- Brazil
- Italy
- Russian Federation
- India
- Canada
- Australia
- Republic of Korea
- Spain
- Mexico
- Indonesia
- Netherlands
- Turkey
- Saudi Arabia
- Switzerland
- Sweden
- Nigeria
- Poland
- Belgium
- Argentina
- Norway
- Austria
- Thailand
- United Arab Emirates
- Colombia
- Denmark
- South Africa
- Malaysia
- Israel
- Singapore
- Egypt
- Philippines
- Finland
- Chile
- Ireland
- Pakistan
- Greece
- Portugal
- Kazakhstan
- Algeria
- Czech Republic
- Qatar
- Peru
- Romania
- Vietnam
+ the largest producing countries
Data coverage:
- Global market volume and value
- Per Capita consumption
- Forecast of the market dynamics in the medium term
- Global production, split by region and country
- Global trade (exports and imports)
- Export and import prices
- Market trends, drivers and restraints
- Key market players and their profiles
Reasons to buy this report:
- Take advantage of the latest data
- Find deeper insights into current market developments
- Discover vital success factors affecting the market
This report is designed for manufacturers, distributors, importers, and wholesalers, as well as for investors, consultants and advisors.
In this report, you can find information that helps you to make informed decisions on the following issues:
- How to diversify your business and benefit from new market opportunities
- How to load your idle production capacity
- How to boost your sales on overseas markets
- How to increase your profit margins
- How to make your supply chain more sustainable
- How to reduce your production and supply chain costs
- How to outsource production to other countries
- How to prepare your business for global expansion
While doing this research, we combine the accumulated expertise of our analysts and the capabilities of artificial intelligence. The AI-based platform, developed by our data scientists, constitutes the key working tool for business analysts, empowering them to discover deep insights and ideas from the marketing data.
-
1. INTRODUCTION
Making Data-Driven Decisions to Grow Your Business
- REPORT DESCRIPTION
- RESEARCH METHODOLOGY AND AI PLATFORM
- DATA-DRIVEN DECISIONS FOR YOUR BUSINESS
- GLOSSARY AND SPECIFIC TERMS
-
2. EXECUTIVE SUMMARY
A Quick Overview of Market Performance
- KEY FINDINGS
- MARKET TRENDS This Chapter is Available Only for the Professional Edition PRO
-
3. MARKET OVERVIEW
Understanding the Current State of The Market and Its Prospects
- MARKET SIZE
- CONSUMPTION BY COUNTRY
- MARKET FORECAST TO 2030
-
4. MOST PROMISING PRODUCT
Finding New Products to Diversify Your Business
This Chapter is Available Only for the Professional Edition PRO- TOP PRODUCTS TO DIVERSIFY YOUR BUSINESS
- BEST-SELLING PRODUCTS
- MOST CONSUMED PRODUCT
- MOST TRADED PRODUCT
- MOST PROFITABLE PRODUCT FOR EXPORT
-
5. MOST PROMISING SUPPLYING COUNTRIES
Choosing the Best Countries to Establish Your Sustainable Supply Chain
This Chapter is Available Only for the Professional Edition PRO- TOP COUNTRIES TO SOURCE YOUR PRODUCT
- TOP PRODUCING COUNTRIES
- TOP EXPORTING COUNTRIES
- LOW-COST EXPORTING COUNTRIES
-
6. MOST PROMISING OVERSEAS MARKETS
Choosing the Best Countries to Boost Your Exports
This Chapter is Available Only for the Professional Edition PRO- TOP OVERSEAS MARKETS FOR EXPORTING YOUR PRODUCT
- TOP CONSUMING MARKETS
- UNSATURATED MARKETS
- TOP IMPORTING MARKETS
- MOST PROFITABLE MARKETS
7. GLOBAL PRODUCTION
The Latest Trends and Insights into The Industry
- PRODUCTION VOLUME AND VALUE
- PRODUCTION BY COUNTRY
8. GLOBAL IMPORTS
The Largest Importers on The Market and How They Succeed
- IMPORTS FROM 2012–2023
- IMPORTS BY COUNTRY
- IMPORT PRICES BY COUNTRY
9. GLOBAL EXPORTS
The Largest Exporters on The Market and How They Succeed
- EXPORTS FROM 2012–2023
- EXPORTS BY COUNTRY
- EXPORT PRICES BY COUNTRY
-
10. PROFILES OF MAJOR PRODUCERS
The Largest Producers on The Market and Their Profiles
This Chapter is Available Only for the Professional Edition PRO -
11. COUNTRY PROFILES
The Largest Markets And Their Profiles
This Chapter is Available Only for the Professional Edition PRO- United States
- China
- Japan
- Germany
- United Kingdom
- France
- Brazil
- Italy
- Russian Federation
- India
- Canada
- Australia
- Republic of Korea
- Spain
- Mexico
- Indonesia
- Netherlands
- Turkey
- Saudi Arabia
- Switzerland
- Sweden
- Nigeria
- Poland
- Belgium
- Argentina
- Norway
- Austria
- Thailand
- United Arab Emirates
- Colombia
- Denmark
- South Africa
- Malaysia
- Israel
- Singapore
- Egypt
- Philippines
- Finland
- Chile
- Ireland
- Pakistan
- Greece
- Portugal
- Kazakhstan
- Algeria
- Czech Republic
- Qatar
- Peru
- Romania
- Vietnam
-
LIST OF TABLES
- Key Findings In 2023
- Market Volume, In Physical Terms, 2012–2023
- Market Value, 2012–2023
- Per Capita Consumption, By Country, 2018–2023
- Production, In Physical Terms, By Country, 2012–2023
- Imports, In Physical Terms, By Country, 2012–2023
- Imports, In Value Terms, By Country, 2012–2023
- Import Prices, By Country Of Destination, 2012–2023
- Exports, In Physical Terms, By Country, 2012–2023
- Exports, In Value Terms, By Country, 2012–2023
- Export Prices, By Country Of Origin, 2012–2023
-
LIST OF FIGURES
- Market Volume, In Physical Terms, 2012–2023
- Market Value, 2012–2023
- Consumption, By Country, 2023
- Market Volume Forecast to 2030
- Market Value Forecast to 2030
- Products: Market Size And Growth, By Type
- Products: Average Per Capita Consumption, By Type
- Products: Exports And Growth, By Type
- Products: Export Prices And Growth, By Type
- Production Volume And Growth
- Exports And Growth
- Export Prices And Growth
- Market Size And Growth
- Per Capita Consumption
- Imports And Growth
- Import Prices
- Production, In Physical Terms, 2012–2023
- Production, In Value Terms, 2012–2023
- Production, By Country, 2023
- Production, In Physical Terms, By Country, 2012–2023
- Imports, In Physical Terms, 2012–2023
- Imports, In Value Terms, 2012–2023
- Imports, In Physical Terms, By Country, 2023
- Imports, In Physical Terms, By Country, 2012–2023
- Imports, In Value Terms, By Country, 2012–2023
- Import Prices, By Country, 2012–2023
- Exports, In Physical Terms, 2012–2023
- Exports, In Value Terms, 2012–2023
- Exports, In Physical Terms, By Country, 2023
- Exports, In Physical Terms, By Country, 2012–2023
- Exports, In Value Terms, By Country, 2012–2023
- Export Prices, 2012–2023


