Poland's Stationery Product Export Surges by 3%, Reaching $323 Million in 2023
Poland Stationery Product Exports
In 2023, overseas shipments of stationery products decreased by -14.4% to 77K tons for the first time since 2020, thus ending a two-year rising trend. Over the period under review, total exports indicated resilient growth from 2013 to 2023: its volume increased at an average annual rate of +5.3% over the last decade. The trend pattern, however, indicated some noticeable fluctuations being recorded throughout the analyzed period. The growth pace was the most rapid in 2021 when exports increased by 28%. Over the period under review, the exports attained the maximum at 90K tons in 2022, and then dropped in the following year.
In value terms, stationery product exports rose slightly to $323M (IndexBox estimates) in 2023. In general, exports, however, saw a remarkable increase. The most prominent rate of growth was recorded in 2021 with an increase of 30%. Over the period under review, the exports reached the maximum in 2023 and are expected to retain growth in years to come.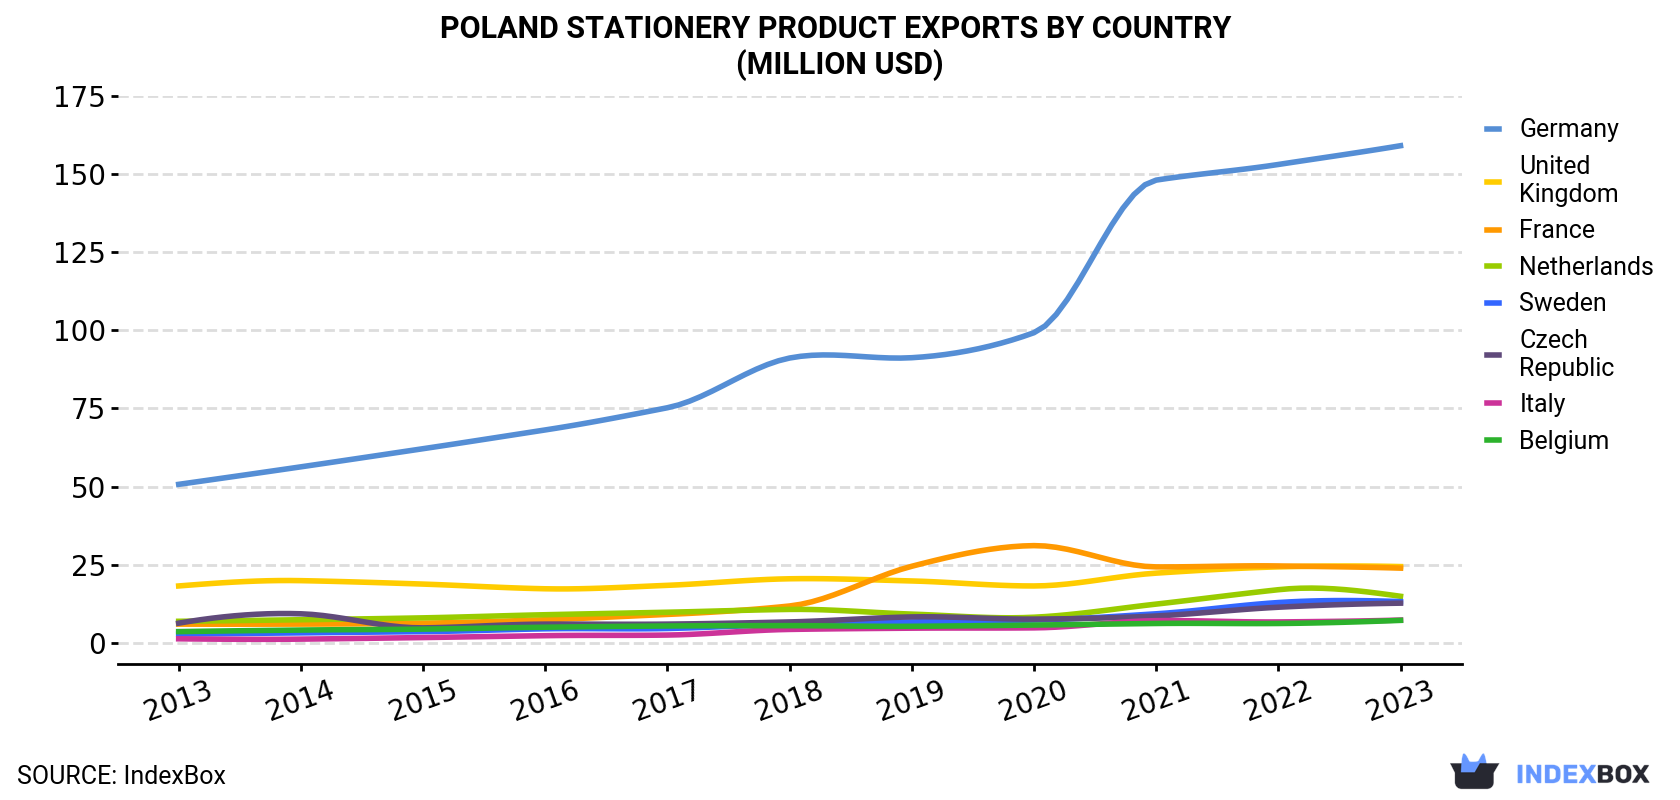
| COUNTRY | Export Value of Stationery Product in Poland (million USD) | ||||||||||
|---|---|---|---|---|---|---|---|---|---|---|---|
| 2013 | 2014 | 2015 | 2016 | 2017 | 2018 | 2019 | 2020 | 2021 | 2022 | 2023 | |
| Germany | 50.7 | 56.3 | 62.1 | 68.1 | 75.2 | 91.1 | 91.2 | 99.2 | 148 | 153 | 159 |
| United Kingdom | 18.2 | 19.9 | 18.8 | 17.3 | 18.4 | 20.5 | 19.8 | 18.2 | 22.3 | 24.3 | 24.4 |
| France | 6.0 | 6.0 | 6.3 | 7.4 | 9.1 | 11.8 | 24.5 | 31.1 | 24.3 | 24.6 | 23.9 |
| Netherlands | 6.9 | 7.4 | 8.0 | 9.0 | 9.8 | 10.7 | 9.2 | 8.2 | 12.4 | 17.0 | 14.9 |
| Sweden | 2.8 | 3.2 | 3.6 | 4.5 | 4.6 | 5.9 | 6.7 | 7.3 | 9.3 | 12.9 | 13.2 |
| Czech Republic | 6.3 | 9.3 | 4.8 | 6.0 | 6.0 | 6.7 | 8.3 | 7.6 | 8.6 | 11.4 | 12.7 |
| Italy | 1.3 | 1.2 | 1.7 | 2.3 | 2.5 | 4.3 | 4.7 | 4.8 | 7.1 | 6.7 | 7.3 |
| Belgium | 3.6 | 4.1 | 4.4 | 5.0 | 5.4 | 5.5 | 5.3 | 5.7 | 6.2 | 6.2 | 7.2 |
| Others | 29.7 | 28.7 | 27.3 | 30.7 | 30.9 | 41.2 | 43.9 | 42.5 | 53.5 | 57.4 | 60.2 |
| Total | 125 | 136 | 137 | 150 | 162 | 198 | 214 | 225 | 292 | 313 | 323 |
Exports by Country
Germany (38K tons) was the main destination for stationery product exports from Poland, accounting for a 49% share of total exports. Moreover, stationery product exports to Germany exceeded the volume sent to the second major destination, the UK (8.1K tons), fivefold. The third position in this ranking was held by the Netherlands (4.3K tons), with a 5.5% share.
From 2013 to 2023, the average annual growth rate of volume to Germany totaled +6.6%. Exports to the other major destinations recorded the following average annual rates of exports growth: the UK (-1.5% per year) and the Netherlands (+6.6% per year).
In value terms, Germany ($159M) remains the key foreign market for stationery products exports from Poland, comprising 49% of total exports. The second position in the ranking was taken by the UK ($24M), with a 7.6% share of total exports. It was followed by France, with a 7.4% share.
From 2013 to 2023, the average annual growth rate of value to Germany amounted to +12.1%. Exports to the other major destinations recorded the following average annual rates of exports growth: the UK (+3.0% per year) and France (+14.9% per year).
Exports by Type
Envelopes (40K tons) was the largest type of stationery products exported from Poland, with a 52% share of total exports. Moreover, envelopes exceeded the volume of the second product type, paper binders, folders and file covers (17K tons), twofold. Registers, account books, order books and receipt books (15K tons) ranked third in terms of total exports with a 19% share.
From 2013 to 2023, the average annual rate of growth in terms of the volume of envelopes exports stood at +4.6%. With regard to the other exported products, the following average annual rates of growth were recorded: paper binders, folders and file covers (+9.8% per year) and registers, account books, order books and receipt books (+7.0% per year).
In value terms, stationery products with the largest exports in Poland were registers, account books, order books and receipt books ($127M), envelopes ($113M) and paper binders, folders and file covers ($57M), together accounting for 92% of total exports. Albums for samples, collections, stamps or photographs, blotting pads and book covers, uncoated paper and paperboard in square with one side > 435 mm or with one side <= 435 mm and the other side > 297 mm in the unfolded state, manifold business forms and interleaved carbon sets, boxes, pouches, wallets and writing compendiums of paper, uncoated paper and paperboard; in square or rectangular sheets with one side <= 435 mm and the other side <= 297 mm in the unfolded state, letter cards, plain postcards and correspondence cards and handmade paper and paperboard lagged somewhat behind, together comprising a further 8%.
Uncoated paper and paperboard; in square or rectangular sheets with one side <= 435 mm and the other side <= 297 mm in the unfolded state, with a CAGR of +28.6%, saw the highest growth rate of the value of exports, among the main product categories over the period under review, while shipments for the other products experienced more modest paces of growth.
Export Prices by Country
In 2023, the stationery product price amounted to $4,189 per ton (FOB, Poland), growing by 21% against the previous year. In general, export price indicated moderate growth from 2013 to 2023: its price increased at an average annual rate of +4.4% over the last decade. The trend pattern, however, indicated some noticeable fluctuations being recorded throughout the analyzed period. Based on 2023 figures, stationery product export price increased by +69.5% against 2016 indices. As a result, the export price reached the peak level and is likely to continue growth in the immediate term.
There were significant differences in the average prices for the major export markets. In 2023, amid the top suppliers, the country with the highest price was France ($6,601 per ton), while the average price for exports to the UK ($3,000 per ton) was amongst the lowest.
From 2013 to 2023, the most notable rate of growth in terms of prices was recorded for supplies to Germany (+5.2%), while the prices for the other major destinations experienced more modest paces of growth.
-
1. INTRODUCTION
Making Data-Driven Decisions to Grow Your Business
- REPORT DESCRIPTION
- RESEARCH METHODOLOGY AND AI PLATFORM
- DATA-DRIVEN DECISIONS FOR YOUR BUSINESS
- GLOSSARY AND SPECIFIC TERMS
-
2. EXECUTIVE SUMMARY
A Quick Overview of Market Performance
- KEY FINDINGS
- MARKET TRENDS This Chapter is Available Only for the Professional Edition PRO
-
3. MARKET OVERVIEW
Understanding the Current State of The Market and Its Prospects
- MARKET SIZE
- MARKET STRUCTURE
- TRADE BALANCE
- PER CAPITA CONSUMPTION
- MARKET FORECAST TO 2030
-
4. MOST PROMISING PRODUCT
Finding New Products to Diversify Your Business
This Chapter is Available Only for the Professional Edition PRO- TOP PRODUCTS TO DIVERSIFY YOUR BUSINESS
- BEST-SELLING PRODUCTS
- MOST CONSUMED PRODUCT
- MOST TRADED PRODUCT
- MOST PROFITABLE PRODUCT FOR EXPORT
-
5. MOST PROMISING SUPPLYING COUNTRIES
Choosing the Best Countries to Establish Your Sustainable Supply Chain
This Chapter is Available Only for the Professional Edition PRO- TOP COUNTRIES TO SOURCE YOUR PRODUCT
- TOP PRODUCING COUNTRIES
- TOP EXPORTING COUNTRIES
- LOW-COST EXPORTING COUNTRIES
-
6. MOST PROMISING OVERSEAS MARKETS
Choosing the Best Countries to Boost Your Exports
This Chapter is Available Only for the Professional Edition PRO- TOP OVERSEAS MARKETS FOR EXPORTING YOUR PRODUCT
- TOP CONSUMING MARKETS
- UNSATURATED MARKETS
- TOP IMPORTING MARKETS
- MOST PROFITABLE MARKETS
7. PRODUCTION
The Latest Trends and Insights into The Industry
- PRODUCTION VOLUME AND VALUE
8. IMPORTS
The Largest Import Supplying Countries
- IMPORTS FROM 2012–2023
- IMPORTS BY COUNTRY
- IMPORT PRICES BY COUNTRY
9. EXPORTS
The Largest Destinations for Exports
- EXPORTS FROM 2012–2023
- EXPORTS BY COUNTRY
- EXPORT PRICES BY COUNTRY
-
10. PROFILES OF MAJOR PRODUCERS
The Largest Producers on The Market and Their Profiles
This Chapter is Available Only for the Professional Edition PRO -
LIST OF TABLES
- Key Findings In 2023
- Market Volume, In Physical Terms, 2012–2023
- Market Value, 2012–2023
- Per Capita Consumption In 2012-2023
- Imports, In Physical Terms, By Country, 2012–2023
- Imports, In Value Terms, By Country, 2012–2023
- Import Prices, By Country Of Origin, 2012–2023
- Exports, In Physical Terms, By Country, 2012–2023
- Exports, In Value Terms, By Country, 2012–2023
- Export Prices, By Country Of Destination, 2012–2023
-
LIST OF FIGURES
- Market Volume, In Physical Terms, 2012–2023
- Market Value, 2012–2023
- Market Structure – Domestic Supply vs. Imports, In Physical Terms, 2012-2023
- Market Structure – Domestic Supply vs. Imports, In Value Terms, 2012-2023
- Trade Balance, In Physical Terms, 2012-2023
- Trade Balance, In Value Terms, 2012-2023
- Per Capita Consumption, 2012-2023
- Market Volume Forecast to 2030
- Market Value Forecast to 2030
- Products: Market Size And Growth, By Type
- Products: Average Per Capita Consumption, By Type
- Products: Exports And Growth, By Type
- Products: Export Prices And Growth, By Type
- Production Volume And Growth
- Exports And Growth
- Export Prices And Growth
- Market Size And Growth
- Per Capita Consumption
- Imports And Growth
- Import Prices
- Production, In Physical Terms, 2012–2023
- Production, In Value Terms, 2012–2023
- Imports, In Physical Terms, 2012–2023
- Imports, In Value Terms, 2012–2023
- Imports, In Physical Terms, By Country, 2023
- Imports, In Physical Terms, By Country, 2012–2023
- Imports, In Value Terms, By Country, 2012–2023
- Import Prices, By Country Of Origin, 2012–2023
- Exports, In Physical Terms, 2012–2023
- Exports, In Value Terms, 2012–2023
- Exports, In Physical Terms, By Country, 2023
- Exports, In Physical Terms, By Country, 2012–2023
- Exports, In Value Terms, By Country, 2012–2023
- Export Prices, By Country Of Destination, 2012–2023


