
Poland - Tufted Carpets And Other Tufted Textile Floor Coverings - Market Analysis, Forecast, Size, Trends And Insights
Get instant access to more than 2 million reports, dashboards, and datasets on the IndexBox Platform.
View PricingPoland's Tufted Carpet Exports Surge to $135 Million in 2023
Poland Tufted Carpet Exports
In 2023, after two years of growth, there was decline in overseas shipments of tufted carpets and other tufted textile floor coverings, when their volume decreased by -2.4% to 11M square meters. Overall, exports recorded a perceptible descent. The most prominent rate of growth was recorded in 2014 when exports increased by 6.6%. Over the period under review, the exports hit record highs at 18M square meters in 2017; however, from 2018 to 2023, the exports remained at a lower figure.
In value terms, tufted carpet exports amounted to $135M (IndexBox estimates) in 2023. Over the period under review, exports continue to indicate a slight downturn. The pace of growth appeared the most rapid in 2014 with an increase of 17%. As a result, the exports reached the peak of $180M. From 2015 to 2023, the growth of the exports failed to regain momentum.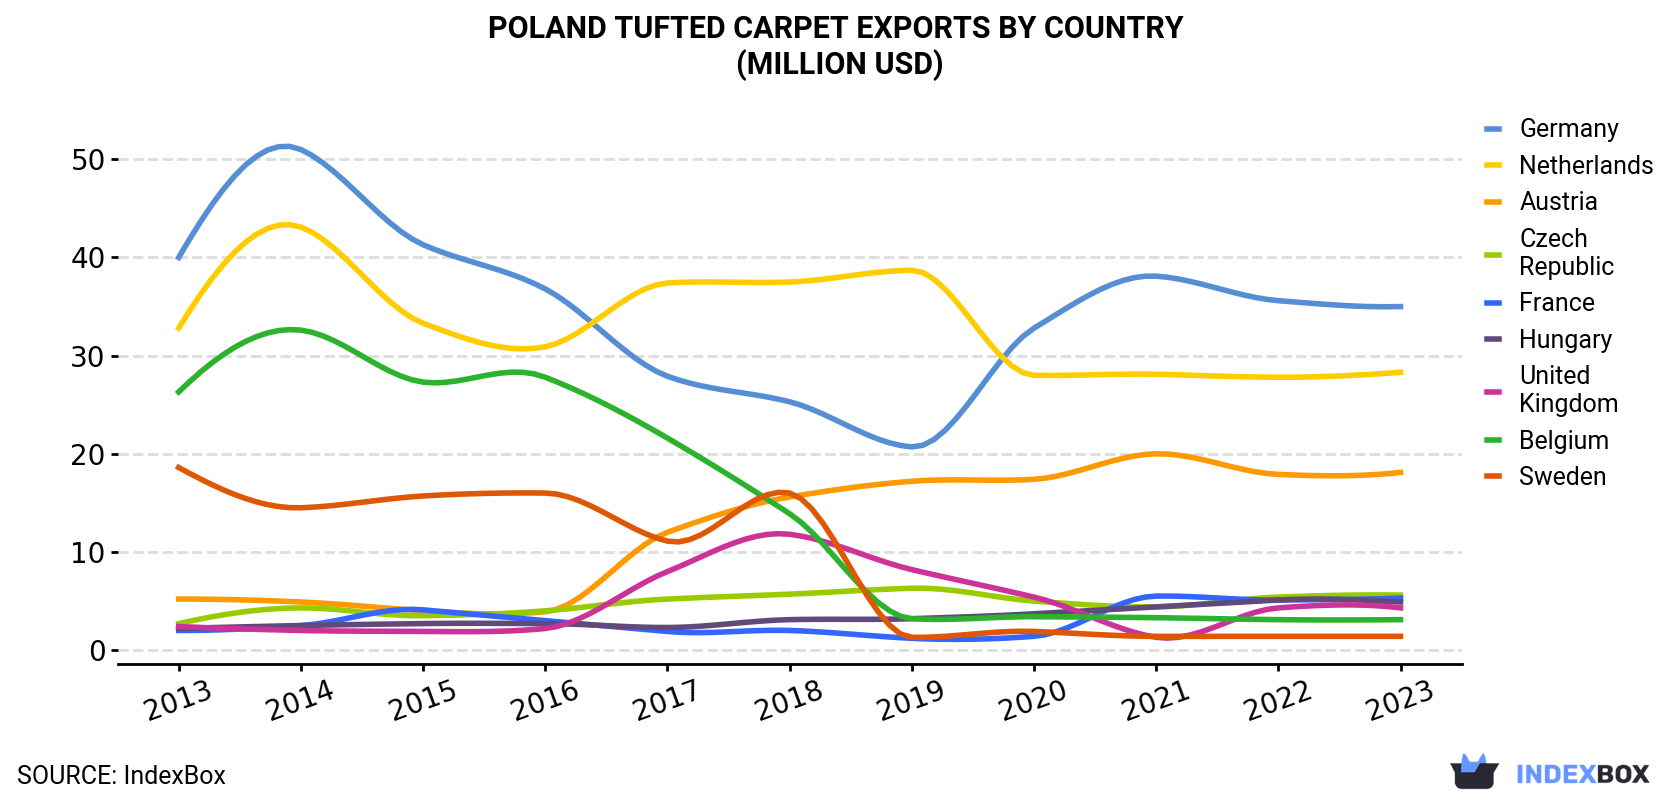
| COUNTRY | Export Value of Tufted Carpet in Poland (million USD) | ||||||||||
|---|---|---|---|---|---|---|---|---|---|---|---|
| 2013 | 2014 | 2015 | 2016 | 2017 | 2018 | 2019 | 2020 | 2021 | 2022 | 2023 | |
| Germany | 40.0 | 51.0 | 41.3 | 36.8 | 27.9 | 25.3 | 20.7 | 32.8 | 38.1 | 35.6 | 35.0 |
| Netherlands | 32.8 | 43.1 | 33.3 | 30.9 | 37.4 | 37.5 | 38.7 | 28.0 | 28.1 | 27.8 | 28.3 |
| Austria | 5.2 | 4.9 | 4.0 | 3.9 | 12.0 | 15.6 | 17.2 | 17.4 | 20.0 | 17.9 | 18.1 |
| Czech Republic | 2.7 | 4.3 | 3.5 | 4.0 | 5.2 | 5.7 | 6.3 | 5.0 | 4.4 | 5.4 | 5.6 |
| France | 2.0 | 2.5 | 4.1 | 3.0 | 1.9 | 2.0 | 1.2 | 1.4 | 5.5 | 5.1 | 5.3 |
| Hungary | 2.2 | 2.5 | 2.7 | 2.7 | 2.3 | 3.1 | 3.2 | 3.7 | 4.4 | 5.1 | 4.9 |
| United Kingdom | 2.4 | 2.0 | 1.9 | 2.2 | 8.0 | 11.8 | 8.2 | 5.4 | 1.3 | 4.3 | 4.3 |
| Belgium | 26.3 | 32.6 | 27.3 | 27.8 | 21.6 | 13.9 | 3.2 | 3.4 | 3.3 | 3.1 | 3.1 |
| Sweden | 18.6 | 14.5 | 15.7 | 16.0 | 11.1 | 16.0 | 1.3 | 1.9 | 1.4 | 1.4 | 1.4 |
| Others | 20.9 | 22.3 | 16.9 | 20.2 | 19.7 | 27.9 | 23.5 | 21.5 | 27.7 | 28.4 | 29.4 |
| Total | 153 | 180 | 151 | 148 | 147 | 159 | 124 | 121 | 134 | 134 | 135 |
Exports by Country
the Netherlands (2.8M square meters), Germany (2.1M square meters) and Austria (820K square meters) were the main destinations of tufted carpet exports from Poland, together accounting for 52% of total exports. the Czech Republic, Hungary, France, Belgium, the UK and Sweden lagged somewhat behind, together comprising a further 21%.
From 2013 to 2023, the biggest increases were recorded for Hungary (with a CAGR of +10.8%), while shipments for the other leaders experienced more modest paces of growth.
In value terms, Germany ($35M), the Netherlands ($28M) and Austria ($18M) constituted the largest markets for tufted carpet exported from Poland worldwide, together comprising 60% of total exports.
In terms of the main countries of destination, Austria, with a CAGR of +13.2%, recorded the highest rates of growth with regard to the value of exports, over the period under review, while shipments for the other leaders experienced more modest paces of growth.
Exports by Type
Carpets and other textile floor coverings; tufted, of nylon or other polyamides, whether or not made up (5.7M square meters), carpets and other textile floor coverings; tufted, of man-made textile materials (other than polyamides), whether or not made up (4.4M square meters) and carpets and other textile floor coverings; tufted, of textile materials (other than man-made, wool or fine animal hair), whether or not made up (760K square meters) were the main products of tufted carpet exports from Poland, with a combined 99% share of total exports. These products were followed by carpets and other textile floor coverings; tufted, of wool or fine animal hair, whether or not made up, which accounted for a further 0.7%.
From 2013 to 2023, the biggest increases were recorded for carpets and other textile floor coverings; tufted, of wool or fine animal hair, whether or not made up (with a CAGR of +11.2%), while shipments for the other products experienced a decline.
In value terms, carpets and other textile floor coverings; tufted, of nylon or other polyamides, whether or not made up ($84M) remains the largest type of tufted carpets and other tufted textile floor coverings exported from Poland, comprising 62% of total exports. The second position in the ranking was taken by carpets and other textile floor coverings; tufted, of man-made textile materials (other than polyamides), whether or not made up ($41M), with a 30% share of total exports. It was followed by carpets and other textile floor coverings; tufted, of textile materials (other than man-made, wool or fine animal hair), whether or not made up, with a 5.4% share.
From 2013 to 2023, the average annual growth rate of the value of carpets and other textile floor coverings; tufted, of nylon or other polyamides, whether or not made up exports totaled +1.1%. With regard to the other exported products, the following average annual rates of growth were recorded: carpets and other textile floor coverings; tufted, of man-made textile materials (other than polyamides), whether or not made up (-1.5% per year) and carpets and other textile floor coverings; tufted, of textile materials (other than man-made, wool or fine animal hair), whether or not made up (-13.2% per year).
Export Prices by Country
In 2023, the tufted carpet price stood at $12 per square meter (FOB, Poland), growing by 3.5% against the previous year. In general, export price indicated a noticeable expansion from 2013 to 2023: its price increased at an average annual rate of +2.8% over the last decade. The trend pattern, however, indicated some noticeable fluctuations being recorded throughout the analyzed period. Based on 2023 figures, tufted carpet export price decreased by -1.8% against 2021 indices. The most prominent rate of growth was recorded in 2020 an increase of 19%. The export price peaked at $13 per square meter in 2021; however, from 2022 to 2023, the export prices remained at a lower figure.
There were significant differences in the average prices for the major external markets. In 2023, amid the top suppliers, the country with the highest price was Austria ($22 per square meter), while the average price for exports to Croatia ($3 per square meter) was amongst the lowest.
From 2013 to 2023, the most notable rate of growth in terms of prices was recorded for supplies to Belgium (+5.8%), while the prices for the other major destinations experienced more modest paces of growth.
This report provides an in-depth analysis of the tufted carpet market in Poland. Within it, you will discover the latest data on market trends and opportunities by country, consumption, production and price developments, as well as the global trade (imports and exports). The forecast exhibits the market prospects through 2030.
Product coverage:
- Prodcom 13931300 - Tufted carpets and other tufted textile floor coverings
Country coverage:
- Poland
Data coverage:
- Market volume and value
- Per Capita consumption
- Forecast of the market dynamics in the medium term
- Trade (exports and imports) in Poland
- Export and import prices
- Market trends, drivers and restraints
- Key market players and their profiles
Reasons to buy this report:
- Take advantage of the latest data
- Find deeper insights into current market developments
- Discover vital success factors affecting the market
This report is designed for manufacturers, distributors, importers, and wholesalers, as well as for investors, consultants and advisors.
In this report, you can find information that helps you to make informed decisions on the following issues:
- How to diversify your business and benefit from new market opportunities
- How to load your idle production capacity
- How to boost your sales on overseas markets
- How to increase your profit margins
- How to make your supply chain more sustainable
- How to reduce your production and supply chain costs
- How to outsource production to other countries
- How to prepare your business for global expansion
While doing this research, we combine the accumulated expertise of our analysts and the capabilities of artificial intelligence. The AI-based platform, developed by our data scientists, constitutes the key working tool for business analysts, empowering them to discover deep insights and ideas from the marketing data.
-
1. INTRODUCTION
Making Data-Driven Decisions to Grow Your Business
- REPORT DESCRIPTION
- RESEARCH METHODOLOGY AND AI PLATFORM
- DATA-DRIVEN DECISIONS FOR YOUR BUSINESS
- GLOSSARY AND SPECIFIC TERMS
-
2. EXECUTIVE SUMMARY
A Quick Overview of Market Performance
- KEY FINDINGS
- MARKET TRENDS This Chapter is Available Only for the Professional Edition PRO
-
3. MARKET OVERVIEW
Understanding the Current State of The Market and Its Prospects
- MARKET SIZE
- MARKET STRUCTURE
- TRADE BALANCE
- PER CAPITA CONSUMPTION
- MARKET FORECAST TO 2030
-
4. MOST PROMISING PRODUCT
Finding New Products to Diversify Your Business
This Chapter is Available Only for the Professional Edition PRO- TOP PRODUCTS TO DIVERSIFY YOUR BUSINESS
- BEST-SELLING PRODUCTS
- MOST CONSUMED PRODUCT
- MOST TRADED PRODUCT
- MOST PROFITABLE PRODUCT FOR EXPORT
-
5. MOST PROMISING SUPPLYING COUNTRIES
Choosing the Best Countries to Establish Your Sustainable Supply Chain
This Chapter is Available Only for the Professional Edition PRO- TOP COUNTRIES TO SOURCE YOUR PRODUCT
- TOP PRODUCING COUNTRIES
- TOP EXPORTING COUNTRIES
- LOW-COST EXPORTING COUNTRIES
-
6. MOST PROMISING OVERSEAS MARKETS
Choosing the Best Countries to Boost Your Exports
This Chapter is Available Only for the Professional Edition PRO- TOP OVERSEAS MARKETS FOR EXPORTING YOUR PRODUCT
- TOP CONSUMING MARKETS
- UNSATURATED MARKETS
- TOP IMPORTING MARKETS
- MOST PROFITABLE MARKETS
7. PRODUCTION
The Latest Trends and Insights into The Industry
- PRODUCTION VOLUME AND VALUE
8. IMPORTS
The Largest Import Supplying Countries
- IMPORTS FROM 2012–2023
- IMPORTS BY COUNTRY
- IMPORT PRICES BY COUNTRY
9. EXPORTS
The Largest Destinations for Exports
- EXPORTS FROM 2012–2023
- EXPORTS BY COUNTRY
- EXPORT PRICES BY COUNTRY
-
10. PROFILES OF MAJOR PRODUCERS
The Largest Producers on The Market and Their Profiles
This Chapter is Available Only for the Professional Edition PRO -
LIST OF TABLES
- Key Findings In 2023
- Market Volume, In Physical Terms, 2012–2023
- Market Value, 2012–2023
- Per Capita Consumption In 2012-2023
- Imports, In Physical Terms, By Country, 2012–2023
- Imports, In Value Terms, By Country, 2012–2023
- Import Prices, By Country Of Origin, 2012–2023
- Exports, In Physical Terms, By Country, 2012–2023
- Exports, In Value Terms, By Country, 2012–2023
- Export Prices, By Country Of Destination, 2012–2023
-
LIST OF FIGURES
- Market Volume, In Physical Terms, 2012–2023
- Market Value, 2012–2023
- Market Structure – Domestic Supply vs. Imports, In Physical Terms, 2012-2023
- Market Structure – Domestic Supply vs. Imports, In Value Terms, 2012-2023
- Trade Balance, In Physical Terms, 2012-2023
- Trade Balance, In Value Terms, 2012-2023
- Per Capita Consumption, 2012-2023
- Market Volume Forecast to 2030
- Market Value Forecast to 2030
- Products: Market Size And Growth, By Type
- Products: Average Per Capita Consumption, By Type
- Products: Exports And Growth, By Type
- Products: Export Prices And Growth, By Type
- Production Volume And Growth
- Exports And Growth
- Export Prices And Growth
- Market Size And Growth
- Per Capita Consumption
- Imports And Growth
- Import Prices
- Production, In Physical Terms, 2012–2023
- Production, In Value Terms, 2012–2023
- Imports, In Physical Terms, 2012–2023
- Imports, In Value Terms, 2012–2023
- Imports, In Physical Terms, By Country, 2023
- Imports, In Physical Terms, By Country, 2012–2023
- Imports, In Value Terms, By Country, 2012–2023
- Import Prices, By Country Of Origin, 2012–2023
- Exports, In Physical Terms, 2012–2023
- Exports, In Value Terms, 2012–2023
- Exports, In Physical Terms, By Country, 2023
- Exports, In Physical Terms, By Country, 2012–2023
- Exports, In Value Terms, By Country, 2012–2023
- Export Prices, By Country Of Destination, 2012–2023


