Poland - Silver, Unwrought Or In Powder Form - Market Analysis, Forecast, Size, Trends And Insights
Get instant access to more than 2 million reports, dashboards, and datasets on the IndexBox Platform.
View PricingPoland Sees Significant Surge in Unwrought Silver Exports, Reaching $980M in 2023
Poland Unwrought Silver Exports
Unwrought silver exports from Poland declined modestly to 1.3K tons in 2023, falling by -3% against the previous year's figure. In general, exports, however, showed a relatively flat trend pattern. The most prominent rate of growth was recorded in 2019 with an increase of 21% against the previous year. As a result, the exports attained the peak of 1.4K tons. From 2020 to 2023, the growth of the exports remained at a lower figure.
In value terms, unwrought silver exports reached $980M (IndexBox estimates) in 2023. Overall, total exports indicated modest growth from 2013 to 2023: its value increased at an average annual rate of +1.2% over the last decade. The trend pattern, however, indicated some noticeable fluctuations being recorded throughout the analyzed period. Based on 2023 figures, exports decreased by -4.0% against 2021 indices. The pace of growth appeared the most rapid in 2019 when exports increased by 27%. The exports peaked at $1B in 2021; however, from 2022 to 2023, the exports stood at a somewhat lower figure.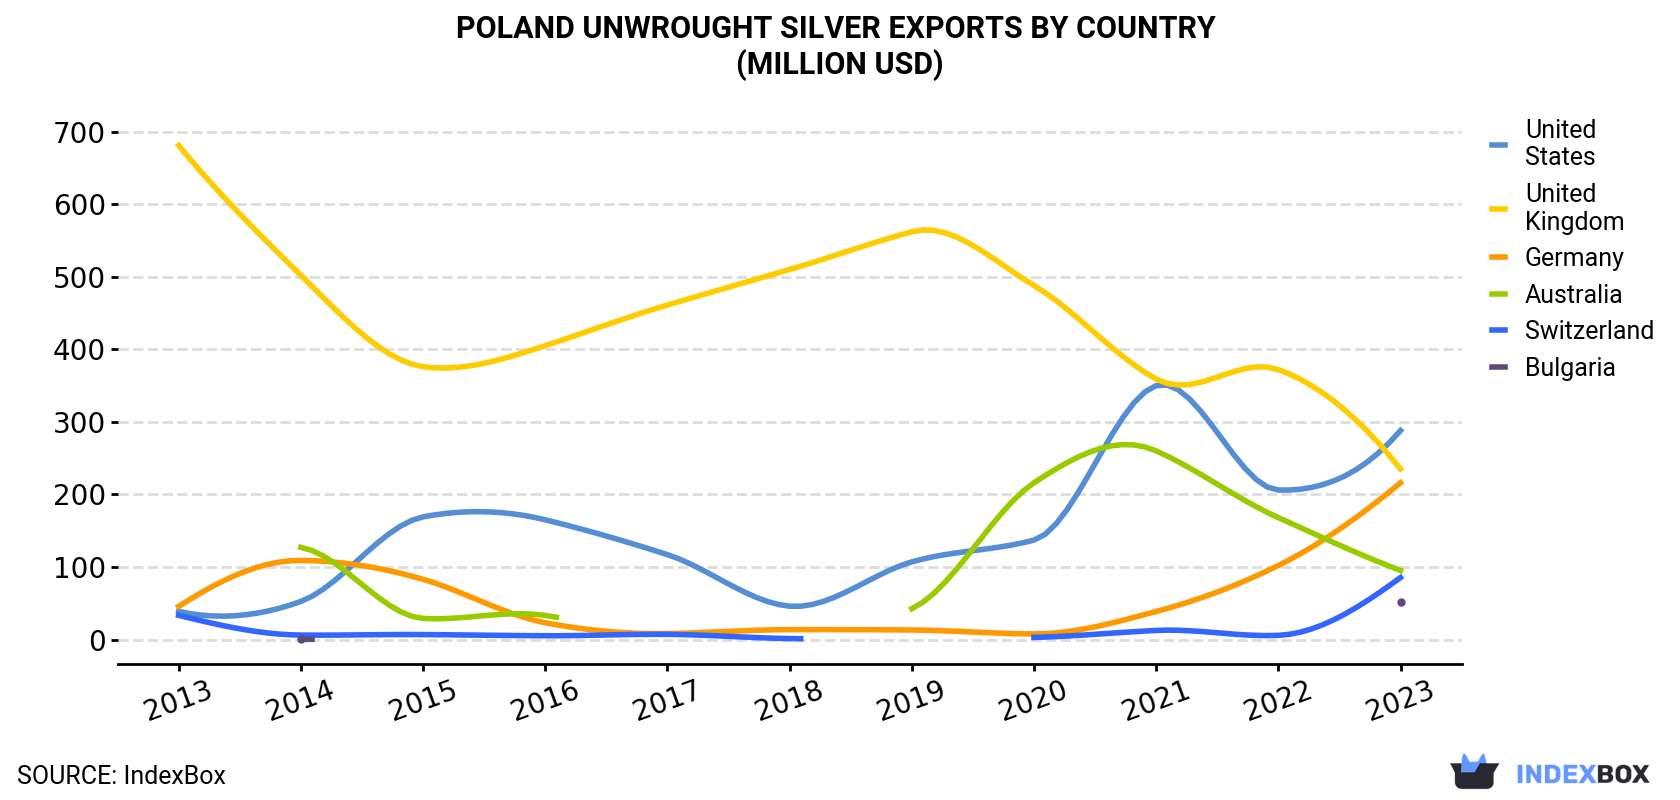
| COUNTRY | Export Value of Unwrought Silver in Poland (million USD) | ||||||||||
|---|---|---|---|---|---|---|---|---|---|---|---|
| 2013 | 2014 | 2015 | 2016 | 2017 | 2018 | 2019 | 2020 | 2021 | 2022 | 2023 | |
| United States | 38.7 | 52.5 | 169 | 165 | 117 | 45.9 | 107 | 137 | 350 | 206 | 288 |
| United Kingdom | 681 | 502 | 376 | 405 | 461 | 510 | 562 | 488 | 359 | 372 | 235 |
| Germany | 45.6 | 109 | 83.0 | 23.1 | 8.2 | 13.6 | 13.1 | 7.7 | 38.6 | 102 | 216 |
| Australia | N/A | 127 | 29.1 | 33.2 | N/A | N/A | 42.5 | 216 | 260 | 168 | 95.2 |
| Switzerland | 33.3 | 6.1 | 6.8 | 5.2 | 7.1 | 1.3 | N/A | 2.9 | 12.5 | 5.7 | 85.4 |
| Bulgaria | N/A | 0.3 | N/A | N/A | N/A | N/A | N/A | N/A | N/A | N/A | 51.6 |
| Others | 70.9 | 67.2 | 35.4 | 53.2 | 37.0 | 2.4 | 1.3 | 0.3 | 1.2 | 33.7 | 7.8 |
| Total | 870 | 864 | 699 | 685 | 630 | 574 | 726 | 851 | 1,021 | 888 | 980 |
Exports by Country
the United States (365 tons), the UK (300 tons) and Germany (281 tons) were the main destinations of unwrought silver exports from Poland, together accounting for 75% of total exports. Australia, Switzerland and Bulgaria lagged somewhat behind, together comprising a further 24%.
From 2013 to 2023, the most notable rate of growth in terms of shipments, amongst the main countries of destination, was attained by Bulgaria (with a CAGR of +73.2%), while the other leaders experienced more modest paces of growth.
In value terms, the United States ($288M), the UK ($235M) and Germany ($216M) constituted the largest markets for unwrought silver exported from Poland worldwide, with a combined 75% share of total exports. Australia, Switzerland and Bulgaria lagged somewhat behind, together accounting for a further 24%.
Bulgaria, with a CAGR of +75.2%, saw the highest growth rate of the value of exports, in terms of the main countries of destination over the period under review, while shipments for the other leaders experienced more modest paces of growth.
Exports by Type
Metals; silver, unwrought, (but not powder) (1.3K tons) was the largest type of silver, unwrought or in powder form exported from Poland, accounting for a 100% share of total exports. It was followed by metals; silver powder (670 kg), with a 0.1% share of total exports.
From 2013 to 2023, the average annual growth rate of the volume of metals; silver, unwrought, (but not powder) exports was relatively modest.
In value terms, metals; silver, unwrought, (but not powder) ($980M) remains the largest type of silver, unwrought or in powder form exported from Poland, comprising 99.9% of total exports. The second position in the ranking was held by metals; silver powder ($24K), with less than 0.1% share of total exports.
From 2013 to 2023, the average annual rate of growth in terms of the value of metals; silver, unwrought, (but not powder) exports totaled +1.2%.
Export Prices by Country
In 2023, the unwrought silver price stood at $779,316 per ton (FOB, Poland), surging by 14% against the previous year. In general, the export price continues to indicate a relatively flat trend pattern. The most prominent rate of growth was recorded in 2021 an increase of 26%. As a result, the export price reached the peak level of $812,624 per ton. From 2022 to 2023, the average export prices remained at a somewhat lower figure.
Average prices varied noticeably for the major foreign markets. In 2023, amid the top suppliers, the highest price was recorded for prices to Australia ($792,619 per ton) and the United States ($787,768 per ton), while the average price for exports to Bulgaria ($737,509 per ton) and Germany ($770,405 per ton) were amongst the lowest.
From 2013 to 2023, the most notable rate of growth in terms of prices was recorded for supplies to Australia (+1.4%), while the prices for the other major destinations experienced more modest paces of growth.
This report provides an in-depth analysis of the unwrought silver market in Poland. Within it, you will discover the latest data on market trends and opportunities by country, consumption, production and price developments, as well as the global trade (imports and exports). The forecast exhibits the market prospects through 2030.
Product coverage:
- Prodcom 24411030 - Silver, unwrought or in powder form (including plated with gold or platinum)
Country coverage:
- Poland
Data coverage:
- Market volume and value
- Per Capita consumption
- Forecast of the market dynamics in the medium term
- Trade (exports and imports) in Poland
- Export and import prices
- Market trends, drivers and restraints
- Key market players and their profiles
Reasons to buy this report:
- Take advantage of the latest data
- Find deeper insights into current market developments
- Discover vital success factors affecting the market
This report is designed for manufacturers, distributors, importers, and wholesalers, as well as for investors, consultants and advisors.
In this report, you can find information that helps you to make informed decisions on the following issues:
- How to diversify your business and benefit from new market opportunities
- How to load your idle production capacity
- How to boost your sales on overseas markets
- How to increase your profit margins
- How to make your supply chain more sustainable
- How to reduce your production and supply chain costs
- How to outsource production to other countries
- How to prepare your business for global expansion
While doing this research, we combine the accumulated expertise of our analysts and the capabilities of artificial intelligence. The AI-based platform, developed by our data scientists, constitutes the key working tool for business analysts, empowering them to discover deep insights and ideas from the marketing data.
-
1. INTRODUCTION
Making Data-Driven Decisions to Grow Your Business
- REPORT DESCRIPTION
- RESEARCH METHODOLOGY AND AI PLATFORM
- DATA-DRIVEN DECISIONS FOR YOUR BUSINESS
- GLOSSARY AND SPECIFIC TERMS
-
2. EXECUTIVE SUMMARY
A Quick Overview of Market Performance
- KEY FINDINGS
- MARKET TRENDS This Chapter is Available Only for the Professional Edition PRO
-
3. MARKET OVERVIEW
Understanding the Current State of The Market and Its Prospects
- MARKET SIZE
- MARKET STRUCTURE
- TRADE BALANCE
- PER CAPITA CONSUMPTION
- MARKET FORECAST TO 2030
-
4. MOST PROMISING PRODUCT
Finding New Products to Diversify Your Business
This Chapter is Available Only for the Professional Edition PRO- TOP PRODUCTS TO DIVERSIFY YOUR BUSINESS
- BEST-SELLING PRODUCTS
- MOST CONSUMED PRODUCT
- MOST TRADED PRODUCT
- MOST PROFITABLE PRODUCT FOR EXPORT
-
5. MOST PROMISING SUPPLYING COUNTRIES
Choosing the Best Countries to Establish Your Sustainable Supply Chain
This Chapter is Available Only for the Professional Edition PRO- TOP COUNTRIES TO SOURCE YOUR PRODUCT
- TOP PRODUCING COUNTRIES
- TOP EXPORTING COUNTRIES
- LOW-COST EXPORTING COUNTRIES
-
6. MOST PROMISING OVERSEAS MARKETS
Choosing the Best Countries to Boost Your Exports
This Chapter is Available Only for the Professional Edition PRO- TOP OVERSEAS MARKETS FOR EXPORTING YOUR PRODUCT
- TOP CONSUMING MARKETS
- UNSATURATED MARKETS
- TOP IMPORTING MARKETS
- MOST PROFITABLE MARKETS
7. PRODUCTION
The Latest Trends and Insights into The Industry
- PRODUCTION VOLUME AND VALUE
8. IMPORTS
The Largest Import Supplying Countries
- IMPORTS FROM 2012–2023
- IMPORTS BY COUNTRY
- IMPORT PRICES BY COUNTRY
9. EXPORTS
The Largest Destinations for Exports
- EXPORTS FROM 2012–2023
- EXPORTS BY COUNTRY
- EXPORT PRICES BY COUNTRY
-
10. PROFILES OF MAJOR PRODUCERS
The Largest Producers on The Market and Their Profiles
This Chapter is Available Only for the Professional Edition PRO -
LIST OF TABLES
- Key Findings In 2023
- Market Volume, In Physical Terms, 2012–2023
- Market Value, 2012–2023
- Per Capita Consumption In 2012-2023
- Imports, In Physical Terms, By Country, 2012–2023
- Imports, In Value Terms, By Country, 2012–2023
- Import Prices, By Country Of Origin, 2012–2023
- Exports, In Physical Terms, By Country, 2012–2023
- Exports, In Value Terms, By Country, 2012–2023
- Export Prices, By Country Of Destination, 2012–2023
-
LIST OF FIGURES
- Market Volume, In Physical Terms, 2012–2023
- Market Value, 2012–2023
- Market Structure – Domestic Supply vs. Imports, In Physical Terms, 2012-2023
- Market Structure – Domestic Supply vs. Imports, In Value Terms, 2012-2023
- Trade Balance, In Physical Terms, 2012-2023
- Trade Balance, In Value Terms, 2012-2023
- Per Capita Consumption, 2012-2023
- Market Volume Forecast to 2030
- Market Value Forecast to 2030
- Products: Market Size And Growth, By Type
- Products: Average Per Capita Consumption, By Type
- Products: Exports And Growth, By Type
- Products: Export Prices And Growth, By Type
- Production Volume And Growth
- Exports And Growth
- Export Prices And Growth
- Market Size And Growth
- Per Capita Consumption
- Imports And Growth
- Import Prices
- Production, In Physical Terms, 2012–2023
- Production, In Value Terms, 2012–2023
- Imports, In Physical Terms, 2012–2023
- Imports, In Value Terms, 2012–2023
- Imports, In Physical Terms, By Country, 2023
- Imports, In Physical Terms, By Country, 2012–2023
- Imports, In Value Terms, By Country, 2012–2023
- Import Prices, By Country Of Origin, 2012–2023
- Exports, In Physical Terms, 2012–2023
- Exports, In Value Terms, 2012–2023
- Exports, In Physical Terms, By Country, 2023
- Exports, In Physical Terms, By Country, 2012–2023
- Exports, In Value Terms, By Country, 2012–2023
- Export Prices, By Country Of Destination, 2012–2023


