
World - Polycarbonates (In Primary Forms) - Market Analysis, Forecast, Size, Trends and Insights
Get instant access to more than 2 million reports, dashboards, and datasets on the IndexBox Platform.
View PricingGlobal Polycarbonates Market Expected to Reach 7.9M Tons and $27.7B by 2030
IndexBox has just published a new report: World - Polycarbonates (In Primary Forms) - Market Analysis, Forecast, Size, Trends and Insights.
The global polycarbonates market is on the rise, driven by increasing demand for primary forms worldwide. Forecasts indicate a +3.2% CAGR from 2023 to 2030, expanding market volume to 7.9M tons. In value terms, the market is expected to grow at a +5.8% CAGR, reaching $27.7B by the end of 2030.
Market Forecast
Driven by increasing demand for polycarbonates (in primary forms) worldwide, the market is expected to continue an upward consumption trend over the next seven-year period. Market performance is forecast to accelerate, expanding with an anticipated CAGR of +3.2% for the period from 2023 to 2030, which is projected to bring the market volume to 7.9M tons by the end of 2030.
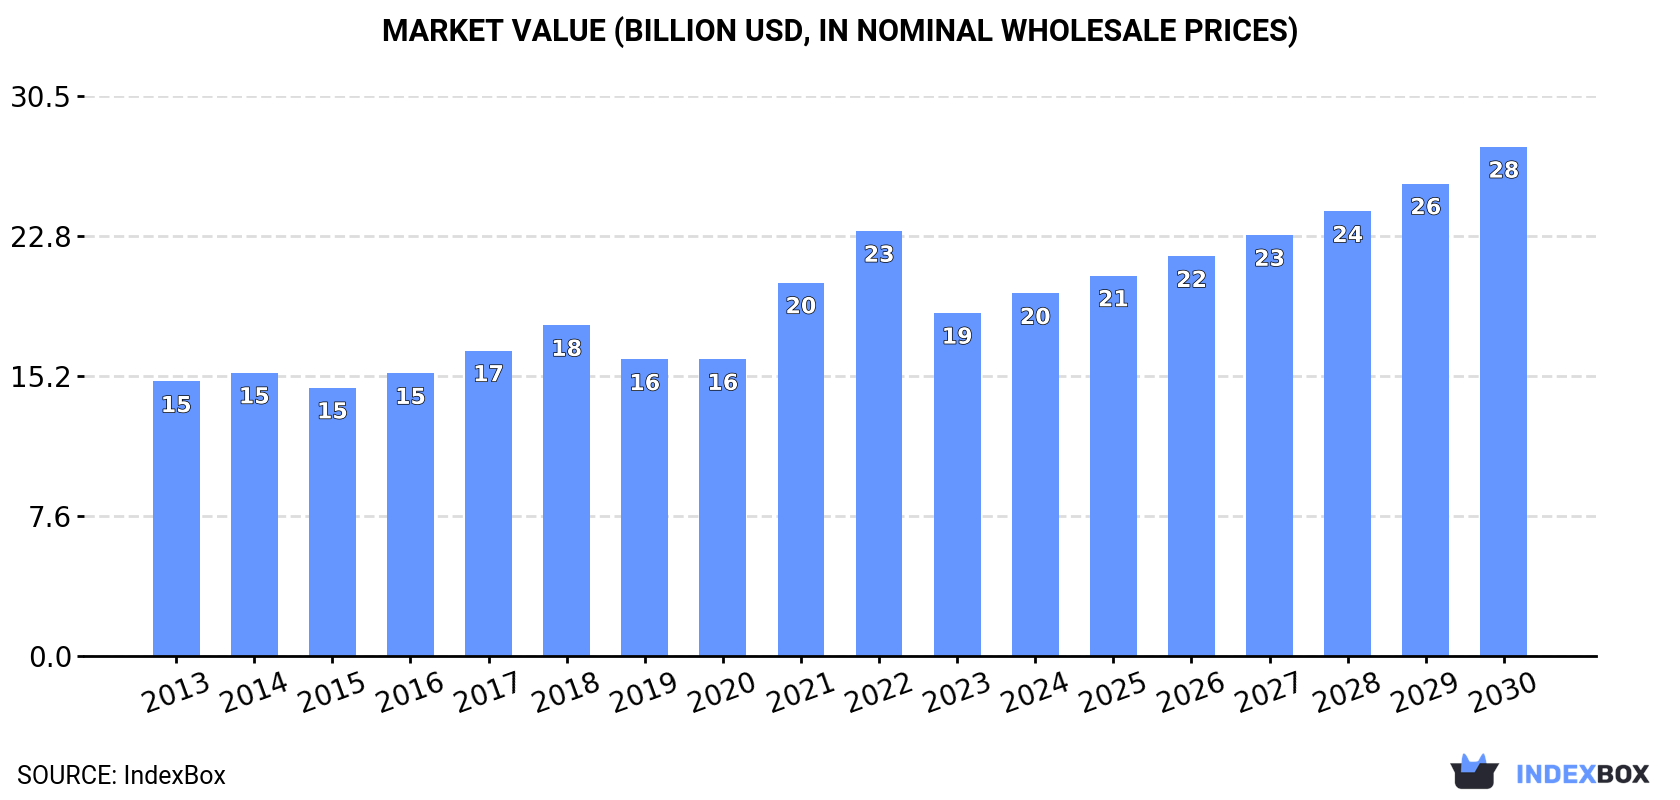
In value terms, the market is forecast to increase with an anticipated CAGR of +5.8% for the period from 2023 to 2030, which is projected to bring the market value to $27.7B (in nominal wholesale prices) by the end of 2030.
Consumption
World Consumption of Polycarbonates (In Primary Forms)
In 2023, consumption of polycarbonates (in primary forms) decreased by -6.8% to 6.3M tons for the first time since 2012, thus ending a ten-year rising trend. The total consumption volume increased at an average annual rate of +2.2% over the period from 2013 to 2023; the trend pattern remained relatively stable, with somewhat noticeable fluctuations being recorded in certain years. The most prominent rate of growth was recorded in 2016 when the consumption volume increased by 6.7%. Over the period under review, global consumption attained the peak volume at 6.8M tons in 2022, and then dropped in the following year.
The global polycarbonate market size shrank dramatically to $18.7B in 2023, waning by -19.3% against the previous year. This figure reflects the total revenues of producers and importers (excluding logistics costs, retail marketing costs, and retailers' margins, which will be included in the final consumer price). The market value increased at an average annual rate of +2.3% from 2013 to 2023; the trend pattern indicated some noticeable fluctuations being recorded in certain years. Over the period under review, the global market attained the peak level at $23.1B in 2022, and then dropped remarkably in the following year.
Consumption By Country
China (2M tons) constituted the country with the largest volume of polycarbonate consumption, accounting for 32% of total volume. Moreover, polycarbonate consumption in China exceeded the figures recorded by the second-largest consumer, the United States (651K tons), threefold. The Netherlands (331K tons) ranked third in terms of total consumption with a 5.2% share.
From 2013 to 2023, the average annual rate of growth in terms of volume in China stood at +4.3%. In the other countries, the average annual rates were as follows: the United States (+4.8% per year) and the Netherlands (+2.3% per year).
In value terms, China ($5.1B) led the market, alone. The second position in the ranking was held by the United States ($2B). It was followed by Germany.
From 2013 to 2023, the average annual rate of growth in terms of value in China stood at +3.0%. The remaining consuming countries recorded the following average annual rates of market growth: the United States (+4.4% per year) and Germany (-1.9% per year).
The countries with the highest levels of polycarbonate per capita consumption in 2023 were Singapore (25 kg per person), the Netherlands (19 kg per person) and Belgium (19 kg per person).
From 2013 to 2023, the most notable rate of growth in terms of consumption, amongst the key consuming countries, was attained by Singapore (with a CAGR of +36.6%), while consumption for the other global leaders experienced more modest paces of growth.
Production
World Production of Polycarbonates (In Primary Forms)
In 2023, production of polycarbonates (in primary forms) decreased by -1.4% to 6.5M tons for the first time since 2012, thus ending a ten-year rising trend. The total output volume increased at an average annual rate of +2.8% over the period from 2013 to 2023; the trend pattern remained relatively stable, with only minor fluctuations being recorded in certain years. The growth pace was the most rapid in 2016 with an increase of 7.5% against the previous year. Global production peaked at 6.6M tons in 2022, and then shrank slightly in the following year.
In value terms, polycarbonate production contracted to $20.2B in 2023 estimated in export price. Overall, the total production indicated perceptible growth from 2013 to 2023: its value increased at an average annual rate of +3.5% over the last decade. The trend pattern, however, indicated some noticeable fluctuations being recorded throughout the analyzed period. Based on 2023 figures, production increased by +27.5% against 2019 indices. The most prominent rate of growth was recorded in 2021 with an increase of 26% against the previous year. Over the period under review, global production attained the maximum level at $22B in 2022, and then dropped in the following year.
Production By Country
The countries with the highest volumes of production in 2023 were China (1.3M tons), the United States (845K tons) and South Korea (740K tons), with a combined 45% share of global production.
From 2013 to 2023, the most notable rate of growth in terms of production, amongst the key producing countries, was attained by China (with a CAGR of +16.3%), while production for the other global leaders experienced more modest paces of growth.
Imports
World Imports of Polycarbonates (In Primary Forms)
In 2023, the amount of polycarbonates (in primary forms) imported worldwide declined to 3.6M tons, with a decrease of -13.3% against the year before. Overall, imports, however, saw a relatively flat trend pattern. The pace of growth appeared the most rapid in 2021 with an increase of 11%. As a result, imports attained the peak of 4.4M tons. From 2022 to 2023, the growth of global imports failed to regain momentum.
In value terms, polycarbonate imports dropped notably to $11B in 2023. Over the period under review, imports, however, recorded a relatively flat trend pattern. The pace of growth was the most pronounced in 2021 when imports increased by 49%. Over the period under review, global imports hit record highs at $15.2B in 2022, and then declined markedly in the following year.
Imports By Country
In 2023, China (1M tons) represented the major importer of polycarbonates (in primary forms), mixing up 29% of total imports. India (280K tons) ranks second in terms of the total imports with a 7.7% share, followed by Mexico (6.2%). The United States (154K tons), Germany (152K tons), Vietnam (140K tons), Taiwan (Chinese) (107K tons), Malaysia (88K tons), Singapore (88K tons), Italy (87K tons), Turkey (80K tons), Japan (76K tons) and Poland (74K tons) held a relatively small share of total imports.
Imports into China decreased at an average annual rate of -1.7% from 2013 to 2023. At the same time, Vietnam (+10.5%), the United States (+10.5%), India (+8.7%), Italy (+6.0%), Germany (+4.4%), Mexico (+3.9%), Turkey (+3.5%), Malaysia (+3.3%) and Poland (+2.9%) displayed positive paces of growth. Moreover, Vietnam emerged as the fastest-growing importer imported in the world, with a CAGR of +10.5% from 2013-2023. Japan experienced a relatively flat trend pattern. By contrast, Taiwan (Chinese) (-4.3%) and Singapore (-6.7%) illustrated a downward trend over the same period. India (+4.2 p.p.), the United States (+2.6 p.p.), Vietnam (+2.4 p.p.) and Mexico (+1.8 p.p.) significantly strengthened its position in terms of the global imports, while Taiwan (Chinese), Singapore and China saw its share reduced by -1.8%, -2.5% and -6.4% from 2013 to 2023, respectively. The shares of the other countries remained relatively stable throughout the analyzed period.
In value terms, China ($2.5B) constitutes the largest market for imported polycarbonates (in primary forms) worldwide, comprising 23% of global imports. The second position in the ranking was taken by Mexico ($830M), with a 7.6% share of global imports. It was followed by India, with a 5.7% share.
In China, polycarbonate imports shrank by an average annual rate of -3.6% over the period from 2013-2023. The remaining importing countries recorded the following average annual rates of imports growth: Mexico (+4.3% per year) and India (+7.4% per year).
Import Prices By Country
The average polycarbonate import price stood at $3,007 per ton in 2023, dropping by -16.6% against the previous year. In general, the import price, however, continues to indicate a relatively flat trend pattern. The most prominent rate of growth was recorded in 2021 when the average import price increased by 34%. Over the period under review, average import prices attained the peak figure at $3,605 per ton in 2022, and then shrank notably in the following year.
Prices varied noticeably by country of destination: amid the top importers, the country with the highest price was Taiwan (Chinese) ($4,302 per ton), while India ($2,229 per ton) was amongst the lowest.
From 2013 to 2023, the most notable rate of growth in terms of prices was attained by Taiwan (Chinese) (+5.0%), while the other global leaders experienced more modest paces of growth.
Exports
World Exports of Polycarbonates (In Primary Forms)
In 2023, shipments abroad of polycarbonates (in primary forms) decreased by -4.7% to 3.8M tons, falling for the second year in a row after five years of growth. The total export volume increased at an average annual rate of +1.2% over the period from 2013 to 2023; the trend pattern remained relatively stable, with somewhat noticeable fluctuations being recorded throughout the analyzed period. The pace of growth was the most pronounced in 2021 with an increase of 12% against the previous year. As a result, the exports attained the peak of 4.2M tons. From 2022 to 2023, the growth of the global exports remained at a somewhat lower figure.
In value terms, polycarbonate exports reduced to $12.4B in 2023. In general, total exports indicated tangible growth from 2013 to 2023: its value increased at an average annual rate of +2.4% over the last decade. The trend pattern, however, indicated some noticeable fluctuations being recorded throughout the analyzed period. The most prominent rate of growth was recorded in 2021 when exports increased by 47% against the previous year. The global exports peaked at $13.8B in 2022, and then fell in the following year.
Exports By Country
South Korea (698K tons), Taiwan (Chinese) (476K tons), Thailand (433K tons), China (362K tons), the United States (348K tons), Germany (240K tons), Japan (220K tons), the Netherlands (196K tons), Saudi Arabia (185K tons) and Spain (143K tons) represented roughly 86% of total exports in 2023. Malaysia (80K tons) took a relatively small share of total exports.
From 2013 to 2023, the most notable rate of growth in terms of shipments, amongst the main exporting countries, was attained by Malaysia (with a CAGR of +25.6%), while the other global leaders experienced more modest paces of growth.
In value terms, South Korea ($2.4B), Taiwan (Chinese) ($1.6B) and Thailand ($1.4B) constituted the countries with the highest levels of exports in 2023, together accounting for 43% of global exports. The United States, Japan, China, Germany, the Netherlands, Spain, Saudi Arabia and Malaysia lagged somewhat behind, together accounting for a further 44%.
Malaysia, with a CAGR of +17.6%, recorded the highest rates of growth with regard to the value of exports, among the main exporting countries over the period under review, while shipments for the other global leaders experienced more modest paces of growth.
Export Prices By Country
The average polycarbonate export price stood at $3,232 per ton in 2023, which is down by -5.2% against the previous year. Over the period from 2013 to 2023, it increased at an average annual rate of +1.2%. The most prominent rate of growth was recorded in 2021 when the average export price increased by 32%. Over the period under review, the average export prices hit record highs at $3,409 per ton in 2022, and then shrank in the following year.
There were significant differences in the average prices amongst the major exporting countries. In 2023, amid the top suppliers, the country with the highest price was Japan ($4,669 per ton), while Malaysia ($1,493 per ton) was amongst the lowest.
From 2013 to 2023, the most notable rate of growth in terms of prices was attained by Taiwan (Chinese) (+2.5%), while the other global leaders experienced more modest paces of growth.
This report provides an in-depth analysis of the global polycarbonate market. Within it, you will discover the latest data on market trends and opportunities by country, consumption, production and price developments, as well as the global trade (imports and exports). The forecast exhibits the market prospects through 2030.
Product coverage:
- Prodcom 20164040 - Polycarbonates, in primary forms
Country coverage:
Worldwide - the report contains statistical data for 200 countries and includes detailed profiles of the 50 largest consuming countries:
- USA
- China
- Japan
- Germany
- United Kingdom
- France
- Brazil
- Italy
- Russian Federation
- India
- Canada
- Australia
- Republic of Korea
- Spain
- Mexico
- Indonesia
- Netherlands
- Turkey
- Saudi Arabia
- Switzerland
- Sweden
- Nigeria
- Poland
- Belgium
- Argentina
- Norway
- Austria
- Thailand
- United Arab Emirates
- Colombia
- Denmark
- South Africa
- Malaysia
- Israel
- Singapore
- Egypt
- Philippines
- Finland
- Chile
- Ireland
- Pakistan
- Greece
- Portugal
- Kazakhstan
- Algeria
- Czech Republic
- Qatar
- Peru
- Romania
- Vietnam
+ the largest producing countries
Data coverage:
- Global market volume and value
- Per Capita consumption
- Forecast of the market dynamics in the medium term
- Global production, split by region and country
- Global trade (exports and imports)
- Export and import prices
- Market trends, drivers and restraints
- Key market players and their profiles
Reasons to buy this report:
- Take advantage of the latest data
- Find deeper insights into current market developments
- Discover vital success factors affecting the market
This report is designed for manufacturers, distributors, importers, and wholesalers, as well as for investors, consultants and advisors.
In this report, you can find information that helps you to make informed decisions on the following issues:
- How to diversify your business and benefit from new market opportunities
- How to load your idle production capacity
- How to boost your sales on overseas markets
- How to increase your profit margins
- How to make your supply chain more sustainable
- How to reduce your production and supply chain costs
- How to outsource production to other countries
- How to prepare your business for global expansion
While doing this research, we combine the accumulated expertise of our analysts and the capabilities of artificial intelligence. The AI-based platform, developed by our data scientists, constitutes the key working tool for business analysts, empowering them to discover deep insights and ideas from the marketing data.
-
1. INTRODUCTION
Making Data-Driven Decisions to Grow Your Business
- REPORT DESCRIPTION
- RESEARCH METHODOLOGY AND AI PLATFORM
- DATA-DRIVEN DECISIONS FOR YOUR BUSINESS
- GLOSSARY AND SPECIFIC TERMS
-
2. EXECUTIVE SUMMARY
A Quick Overview of Market Performance
- KEY FINDINGS
- MARKET TRENDS This Chapter is Available Only for the Professional Edition PRO
-
3. MARKET OVERVIEW
Understanding the Current State of The Market and Its Prospects
- MARKET SIZE
- CONSUMPTION BY COUNTRY
- MARKET FORECAST TO 2030
-
4. MOST PROMISING PRODUCT
Finding New Products to Diversify Your Business
This Chapter is Available Only for the Professional Edition PRO- TOP PRODUCTS TO DIVERSIFY YOUR BUSINESS
- BEST-SELLING PRODUCTS
- MOST CONSUMED PRODUCT
- MOST TRADED PRODUCT
- MOST PROFITABLE PRODUCT FOR EXPORT
-
5. MOST PROMISING SUPPLYING COUNTRIES
Choosing the Best Countries to Establish Your Sustainable Supply Chain
This Chapter is Available Only for the Professional Edition PRO- TOP COUNTRIES TO SOURCE YOUR PRODUCT
- TOP PRODUCING COUNTRIES
- TOP EXPORTING COUNTRIES
- LOW-COST EXPORTING COUNTRIES
-
6. MOST PROMISING OVERSEAS MARKETS
Choosing the Best Countries to Boost Your Exports
This Chapter is Available Only for the Professional Edition PRO- TOP OVERSEAS MARKETS FOR EXPORTING YOUR PRODUCT
- TOP CONSUMING MARKETS
- UNSATURATED MARKETS
- TOP IMPORTING MARKETS
- MOST PROFITABLE MARKETS
7. GLOBAL PRODUCTION
The Latest Trends and Insights into The Industry
- PRODUCTION VOLUME AND VALUE
- PRODUCTION BY COUNTRY
8. GLOBAL IMPORTS
The Largest Importers on The Market and How They Succeed
- IMPORTS FROM 2012–2023
- IMPORTS BY COUNTRY
- IMPORT PRICES BY COUNTRY
9. GLOBAL EXPORTS
The Largest Exporters on The Market and How They Succeed
- EXPORTS FROM 2012–2023
- EXPORTS BY COUNTRY
- EXPORT PRICES BY COUNTRY
-
10. PROFILES OF MAJOR PRODUCERS
The Largest Producers on The Market and Their Profiles
This Chapter is Available Only for the Professional Edition PRO -
11. COUNTRY PROFILES
The Largest Markets And Their Profiles
This Chapter is Available Only for the Professional Edition PRO- United States
- China
- Japan
- Germany
- United Kingdom
- France
- Brazil
- Italy
- Russian Federation
- India
- Canada
- Australia
- Republic of Korea
- Spain
- Mexico
- Indonesia
- Netherlands
- Turkey
- Saudi Arabia
- Switzerland
- Sweden
- Nigeria
- Poland
- Belgium
- Argentina
- Norway
- Austria
- Thailand
- United Arab Emirates
- Colombia
- Denmark
- South Africa
- Malaysia
- Israel
- Singapore
- Egypt
- Philippines
- Finland
- Chile
- Ireland
- Pakistan
- Greece
- Portugal
- Kazakhstan
- Algeria
- Czech Republic
- Qatar
- Peru
- Romania
- Vietnam
-
LIST OF TABLES
- Key Findings In 2023
- Market Volume, In Physical Terms, 2012–2023
- Market Value, 2012–2023
- Per Capita Consumption, By Country, 2018–2023
- Production, In Physical Terms, By Country, 2012–2023
- Imports, In Physical Terms, By Country, 2012–2023
- Imports, In Value Terms, By Country, 2012–2023
- Import Prices, By Country Of Destination, 2012–2023
- Exports, In Physical Terms, By Country, 2012–2023
- Exports, In Value Terms, By Country, 2012–2023
- Export Prices, By Country Of Origin, 2012–2023
-
LIST OF FIGURES
- Market Volume, In Physical Terms, 2012–2023
- Market Value, 2012–2023
- Consumption, By Country, 2023
- Market Volume Forecast to 2030
- Market Value Forecast to 2030
- Products: Market Size And Growth, By Type
- Products: Average Per Capita Consumption, By Type
- Products: Exports And Growth, By Type
- Products: Export Prices And Growth, By Type
- Production Volume And Growth
- Exports And Growth
- Export Prices And Growth
- Market Size And Growth
- Per Capita Consumption
- Imports And Growth
- Import Prices
- Production, In Physical Terms, 2012–2023
- Production, In Value Terms, 2012–2023
- Production, By Country, 2023
- Production, In Physical Terms, By Country, 2012–2023
- Imports, In Physical Terms, 2012–2023
- Imports, In Value Terms, 2012–2023
- Imports, In Physical Terms, By Country, 2023
- Imports, In Physical Terms, By Country, 2012–2023
- Imports, In Value Terms, By Country, 2012–2023
- Import Prices, By Country, 2012–2023
- Exports, In Physical Terms, 2012–2023
- Exports, In Value Terms, 2012–2023
- Exports, In Physical Terms, By Country, 2023
- Exports, In Physical Terms, By Country, 2012–2023
- Exports, In Value Terms, By Country, 2012–2023
- Export Prices, 2012–2023


