
World - Polyurethanes In Primary Forms - Market Analysis, Forecast, Size, Trends And Insights
Get instant access to more than 2 million reports, dashboards, and datasets on the IndexBox Platform.
View PricingGlobal Polyurethane Market: Projected to Reach 9M Tons in Volume and $43.5B in Value by 2030
IndexBox has just published a new report: World - Polyurethanes In Primary Forms - Market Analysis, Forecast, Size, Trends And Insights.
The global polyurethane market in primary forms is expected to experience continued growth over the next seven years, driven by increasing demand. Market performance is predicted to increase with a CAGR of +2.3% in volume and +4.8% in value, reaching 9M tons and $43.5B by the end of 2030.
Market Forecast
Driven by increasing demand for polyurethanes in primary forms worldwide, the market is expected to continue an upward consumption trend over the next seven-year period. Market performance is forecast to retain its current trend pattern, expanding with an anticipated CAGR of +2.3% for the period from 2023 to 2030, which is projected to bring the market volume to 9M tons by the end of 2030.
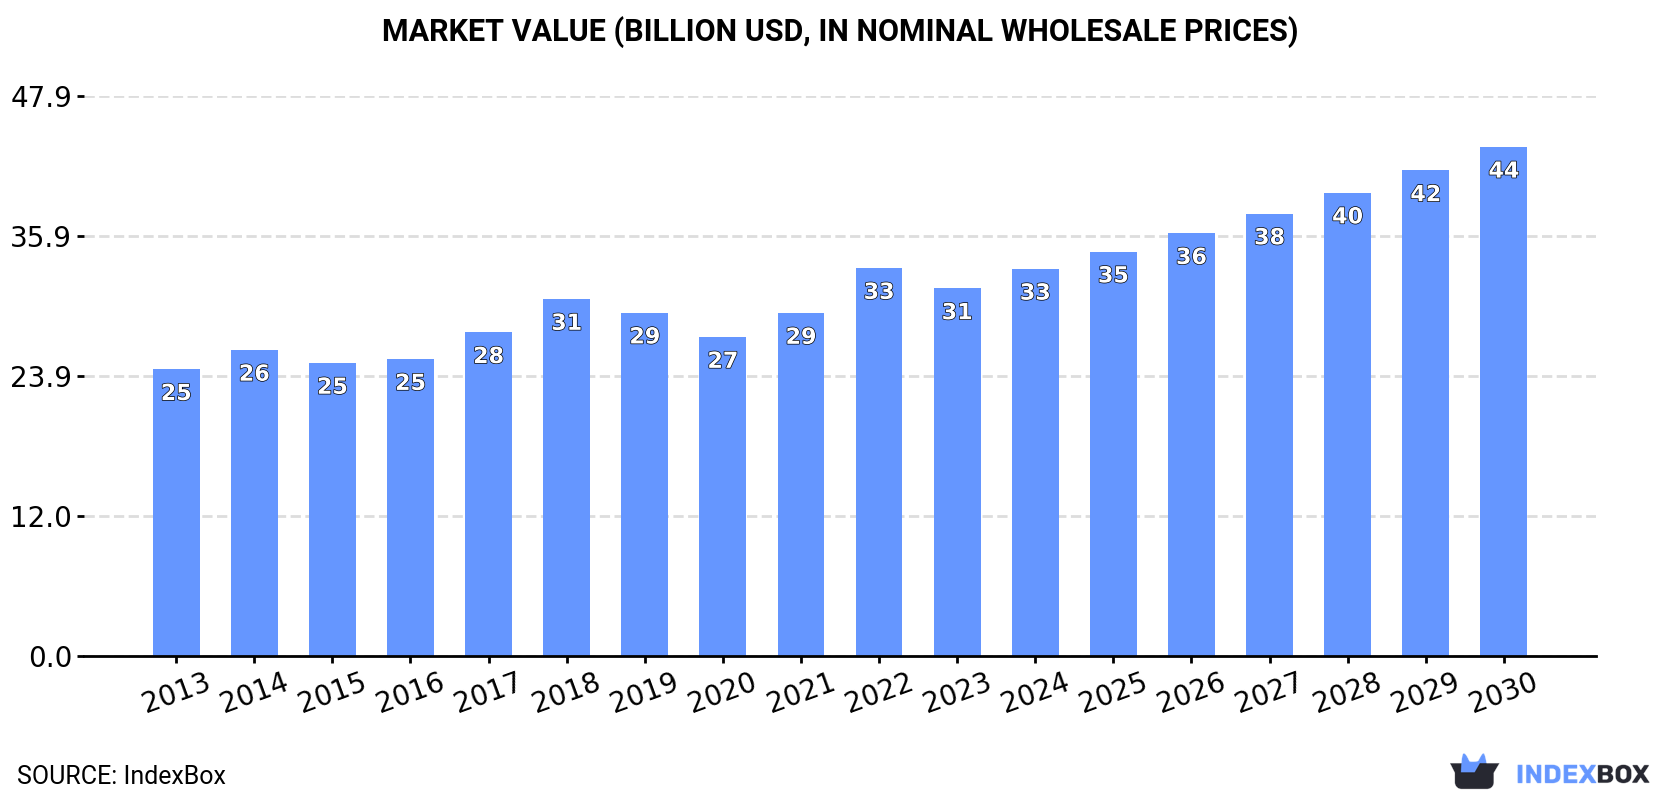
In value terms, the market is forecast to increase with an anticipated CAGR of +4.8% for the period from 2023 to 2030, which is projected to bring the market value to $43.5B (in nominal wholesale prices) by the end of 2030.
Consumption
World Consumption of Polyurethanes In Primary Forms
Global polyurethanes consumption dropped to 7.7M tons in 2023, remaining constant against the previous year. The total consumption volume increased at an average annual rate of +2.1% from 2013 to 2023; the trend pattern remained consistent, with somewhat noticeable fluctuations being observed in certain years. The pace of growth appeared the most rapid in 2017 with an increase of 9.2%. Global consumption peaked at 8M tons in 2019; however, from 2020 to 2023, consumption failed to regain momentum.
The global polyurethanes market size shrank to $31.4B in 2023, declining by -5.3% against the previous year. This figure reflects the total revenues of producers and importers (excluding logistics costs, retail marketing costs, and retailers' margins, which will be included in the final consumer price). The market value increased at an average annual rate of +2.5% from 2013 to 2023; the trend pattern remained relatively stable, with somewhat noticeable fluctuations being recorded in certain years. As a result, consumption attained the peak level of $33.2B, and then dropped in the following year.
Consumption By Country
The country with the largest volume of polyurethanes consumption was China (1.8M tons), comprising approx. 23% of total volume. Moreover, polyurethanes consumption in China exceeded the figures recorded by the second-largest consumer, the United States (853K tons), twofold. India (764K tons) ranked third in terms of total consumption with a 10% share.
From 2013 to 2023, the average annual growth rate of volume in China totaled +2.8%. In the other countries, the average annual rates were as follows: the United States (+6.4% per year) and India (+2.9% per year).
In value terms, the United States ($5B), China ($4.7B) and Japan ($2.4B) appeared to be the countries with the highest levels of market value in 2023, together accounting for 38% of the global market.
The United States, with a CAGR of +9.3%, saw the highest rates of growth with regard to market size in terms of the main consuming countries over the period under review, while market for the other global leaders experienced more modest paces of growth.
In 2023, the highest levels of polyurethanes per capita consumption was registered in Belgium (26 kg per person), followed by Italy (6.6 kg per person), Germany (4.5 kg per person) and South Korea (3.6 kg per person), while the world average per capita consumption of polyurethanes was estimated at 1 kg per person.
From 2013 to 2023, the average annual rate of growth in terms of the polyurethanes per capita consumption in Belgium amounted to -9.0%. The remaining consuming countries recorded the following average annual rates of per capita consumption growth: Italy (+3.0% per year) and Germany (+0.4% per year).
Production
World Production of Polyurethanes In Primary Forms
In 2023, global polyurethanes production shrank slightly to 7.6M tons, leveling off at the previous year. The total output volume increased at an average annual rate of +1.9% from 2013 to 2023; the trend pattern remained relatively stable, with only minor fluctuations throughout the analyzed period. The most prominent rate of growth was recorded in 2017 when the production volume increased by 9.8% against the previous year. Over the period under review, global production attained the maximum volume at 7.9M tons in 2019; however, from 2020 to 2023, production remained at a lower figure.
In value terms, polyurethanes production declined to $31.5B in 2023 estimated in export price. The total output value increased at an average annual rate of +2.3% over the period from 2013 to 2023; the trend pattern remained relatively stable, with only minor fluctuations being observed throughout the analyzed period. The pace of growth appeared the most rapid in 2022 with an increase of 13%. As a result, production attained the peak level of $33.3B, and then fell in the following year.
Production By Country
China (2M tons) remains the largest polyurethanes producing country worldwide, accounting for 26% of total volume. Moreover, polyurethanes production in China exceeded the figures recorded by the second-largest producer, the United States (917K tons), twofold. India (659K tons) ranked third in terms of total production with an 8.7% share.
From 2013 to 2023, the average annual growth rate of volume in China stood at +4.3%. In the other countries, the average annual rates were as follows: the United States (+4.9% per year) and India (+2.1% per year).
Imports
World Imports of Polyurethanes In Primary Forms
In 2023, the amount of polyurethanes in primary forms imported worldwide reduced to 1.9M tons, which is down by -7.5% compared with 2022 figures. The total import volume increased at an average annual rate of +2.6% from 2013 to 2023; however, the trend pattern indicated some noticeable fluctuations being recorded in certain years. The most prominent rate of growth was recorded in 2021 when imports increased by 13%. As a result, imports reached the peak of 2.1M tons. From 2022 to 2023, the growth of global imports failed to regain momentum.
In value terms, polyurethanes imports contracted to $8.2B in 2023. In general, total imports indicated tangible growth from 2013 to 2023: its value increased at an average annual rate of +3.3% over the last decade. The trend pattern, however, indicated some noticeable fluctuations being recorded throughout the analyzed period. The pace of growth was the most pronounced in 2021 with an increase of 31%. Over the period under review, global imports attained the maximum at $9.2B in 2022, and then declined in the following year.
Imports By Country
In 2023, China (143K tons), India (132K tons), Vietnam (125K tons), Germany (96K tons), Iran (89K tons), the United States (84K tons), Italy (77K tons), Mexico (59K tons), Indonesia (54K tons), Spain (49K tons), France (48K tons) and Pakistan (47K tons) was the largest importer of polyurethanes in primary forms in the world, creating 52% of total import. Belgium (45K tons) held a relatively small share of total imports.
From 2013 to 2023, the most notable rate of growth in terms of purchases, amongst the key importing countries, was attained by Pakistan (with a CAGR of +21.3%), while imports for the other global leaders experienced more modest paces of growth.
In value terms, China ($715M), Vietnam ($566M) and Germany ($470M) constituted the countries with the highest levels of imports in 2023, with a combined 21% share of global imports. The United States, Italy, India, Mexico, France, Iran, Indonesia, Spain, Belgium and Pakistan lagged somewhat behind, together accounting for a further 31%.
In terms of the main importing countries, Pakistan, with a CAGR of +13.7%, recorded the highest rates of growth with regard to the value of imports, over the period under review, while purchases for the other global leaders experienced more modest paces of growth.
Import Prices By Country
The average polyurethanes import price stood at $4,259 per ton in 2023, shrinking by -3.1% against the previous year. In general, the import price, however, recorded a relatively flat trend pattern. The growth pace was the most rapid in 2021 when the average import price increased by 16%. Over the period under review, average import prices attained the maximum at $4,395 per ton in 2022, and then dropped modestly in the following year.
Prices varied noticeably by country of destination: amid the top importers, the country with the highest price was the United States ($5,165 per ton), while Pakistan ($1,772 per ton) was amongst the lowest.
From 2013 to 2023, the most notable rate of growth in terms of prices was attained by Vietnam (+3.2%), while the other global leaders experienced more modest paces of growth.
Exports
World Exports of Polyurethanes In Primary Forms
In 2023, global polyurethanes exports reduced to 1.9M tons, with a decrease of -6.3% on the previous year's figure. The total export volume increased at an average annual rate of +1.9% from 2013 to 2023; the trend pattern remained relatively stable, with somewhat noticeable fluctuations being recorded throughout the analyzed period. The pace of growth was the most pronounced in 2017 with an increase of 12%. The global exports peaked at 2M tons in 2021; however, from 2022 to 2023, the exports stood at a somewhat lower figure.
In value terms, polyurethanes exports reduced to $8.1B in 2023. The total export value increased at an average annual rate of +2.6% from 2013 to 2023; the trend pattern indicated some noticeable fluctuations being recorded in certain years. The most prominent rate of growth was recorded in 2021 when exports increased by 30% against the previous year. The global exports peaked at $8.9B in 2022, and then reduced in the following year.
Exports By Country
China (379K tons) and Germany (307K tons) represented roughly 37% of total exports in 2023. The United States (147K tons) ranks next in terms of the total exports with a 7.8% share, followed by Italy (7.7%) and Taiwan (Chinese) (5.6%). South Korea (83K tons), Belgium (79K tons), the Netherlands (77K tons), Spain (66K tons), France (55K tons), Singapore (54K tons), Turkey (43K tons) and Japan (33K tons) followed a long way behind the leaders.
From 2013 to 2023, the most notable rate of growth in terms of shipments, amongst the leading exporting countries, was attained by China (with a CAGR of +13.5%), while the other global leaders experienced more modest paces of growth.
In value terms, Germany ($1.6B), the United States ($943M) and China ($937M) were the countries with the highest levels of exports in 2023, with a combined 43% share of global exports.
China, with a CAGR of +11.4%, saw the highest growth rate of the value of exports, among the main exporting countries over the period under review, while shipments for the other global leaders experienced more modest paces of growth.
Export Prices By Country
In 2023, the average polyurethanes export price amounted to $4,294 per ton, with a decrease of -3.6% against the previous year. In general, the export price, however, saw a relatively flat trend pattern. The pace of growth appeared the most rapid in 2021 when the average export price increased by 17%. Over the period under review, the average export prices attained the maximum at $4,456 per ton in 2022, and then fell slightly in the following year.
Prices varied noticeably by country of origin: amid the top suppliers, the country with the highest price was Japan ($7,292 per ton), while China ($2,471 per ton) was amongst the lowest.
From 2013 to 2023, the most notable rate of growth in terms of prices was attained by the United States (+3.7%), while the other global leaders experienced more modest paces of growth.
This report provides an in-depth analysis of the global polyurethanes market. Within it, you will discover the latest data on market trends and opportunities by country, consumption, production and price developments, as well as the global trade (imports and exports). The forecast exhibits the market prospects through 2030.
Product coverage:
- Prodcom 20165670 - Polyurethanes, in primary forms
Country coverage:
Worldwide - the report contains statistical data for 200 countries and includes detailed profiles of the 50 largest consuming countries:
- USA
- China
- Japan
- Germany
- United Kingdom
- France
- Brazil
- Italy
- Russian Federation
- India
- Canada
- Australia
- Republic of Korea
- Spain
- Mexico
- Indonesia
- Netherlands
- Turkey
- Saudi Arabia
- Switzerland
- Sweden
- Nigeria
- Poland
- Belgium
- Argentina
- Norway
- Austria
- Thailand
- United Arab Emirates
- Colombia
- Denmark
- South Africa
- Malaysia
- Israel
- Singapore
- Egypt
- Philippines
- Finland
- Chile
- Ireland
- Pakistan
- Greece
- Portugal
- Kazakhstan
- Algeria
- Czech Republic
- Qatar
- Peru
- Romania
- Vietnam
+ the largest producing countries
Data coverage:
- Global market volume and value
- Per Capita consumption
- Forecast of the market dynamics in the medium term
- Global production, split by region and country
- Global trade (exports and imports)
- Export and import prices
- Market trends, drivers and restraints
- Key market players and their profiles
Company coverage:
Reasons to buy this report:
- Take advantage of the latest data
- Find deeper insights into current market developments
- Discover vital success factors affecting the market
This report is designed for manufacturers, distributors, importers, and wholesalers, as well as for investors, consultants and advisors.
In this report, you can find information that helps you to make informed decisions on the following issues:
- How to diversify your business and benefit from new market opportunities
- How to load your idle production capacity
- How to boost your sales on overseas markets
- How to increase your profit margins
- How to make your supply chain more sustainable
- How to reduce your production and supply chain costs
- How to outsource production to other countries
- How to prepare your business for global expansion
While doing this research, we combine the accumulated expertise of our analysts and the capabilities of artificial intelligence. The AI-based platform, developed by our data scientists, constitutes the key working tool for business analysts, empowering them to discover deep insights and ideas from the marketing data.
-
1. INTRODUCTION
Making Data-Driven Decisions to Grow Your Business
- REPORT DESCRIPTION
- RESEARCH METHODOLOGY AND AI PLATFORM
- DATA-DRIVEN DECISIONS FOR YOUR BUSINESS
- GLOSSARY AND SPECIFIC TERMS
-
2. EXECUTIVE SUMMARY
A Quick Overview of Market Performance
- KEY FINDINGS
- MARKET TRENDS This Chapter is Available Only for the Professional Edition PRO
-
3. MARKET OVERVIEW
Understanding the Current State of The Market and Its Prospects
- MARKET SIZE
- CONSUMPTION BY COUNTRY
- MARKET FORECAST TO 2030
-
4. MOST PROMISING PRODUCT
Finding New Products to Diversify Your Business
This Chapter is Available Only for the Professional Edition PRO- TOP PRODUCTS TO DIVERSIFY YOUR BUSINESS
- BEST-SELLING PRODUCTS
- MOST CONSUMED PRODUCT
- MOST TRADED PRODUCT
- MOST PROFITABLE PRODUCT FOR EXPORT
-
5. MOST PROMISING SUPPLYING COUNTRIES
Choosing the Best Countries to Establish Your Sustainable Supply Chain
This Chapter is Available Only for the Professional Edition PRO- TOP COUNTRIES TO SOURCE YOUR PRODUCT
- TOP PRODUCING COUNTRIES
- TOP EXPORTING COUNTRIES
- LOW-COST EXPORTING COUNTRIES
-
6. MOST PROMISING OVERSEAS MARKETS
Choosing the Best Countries to Boost Your Exports
This Chapter is Available Only for the Professional Edition PRO- TOP OVERSEAS MARKETS FOR EXPORTING YOUR PRODUCT
- TOP CONSUMING MARKETS
- UNSATURATED MARKETS
- TOP IMPORTING MARKETS
- MOST PROFITABLE MARKETS
7. GLOBAL PRODUCTION
The Latest Trends and Insights into The Industry
- PRODUCTION VOLUME AND VALUE
- PRODUCTION BY COUNTRY
8. GLOBAL IMPORTS
The Largest Importers on The Market and How They Succeed
- IMPORTS FROM 2012–2023
- IMPORTS BY COUNTRY
- IMPORT PRICES BY COUNTRY
9. GLOBAL EXPORTS
The Largest Exporters on The Market and How They Succeed
- EXPORTS FROM 2012–2023
- EXPORTS BY COUNTRY
- EXPORT PRICES BY COUNTRY
-
10. PROFILES OF MAJOR PRODUCERS
The Largest Producers on The Market and Their Profiles
This Chapter is Available Only for the Professional Edition PRO -
11. COUNTRY PROFILES
The Largest Markets And Their Profiles
This Chapter is Available Only for the Professional Edition PRO- United States
- China
- Japan
- Germany
- United Kingdom
- France
- Brazil
- Italy
- Russian Federation
- India
- Canada
- Australia
- Republic of Korea
- Spain
- Mexico
- Indonesia
- Netherlands
- Turkey
- Saudi Arabia
- Switzerland
- Sweden
- Nigeria
- Poland
- Belgium
- Argentina
- Norway
- Austria
- Thailand
- United Arab Emirates
- Colombia
- Denmark
- South Africa
- Malaysia
- Israel
- Singapore
- Egypt
- Philippines
- Finland
- Chile
- Ireland
- Pakistan
- Greece
- Portugal
- Kazakhstan
- Algeria
- Czech Republic
- Qatar
- Peru
- Romania
- Vietnam
-
LIST OF TABLES
- Key Findings In 2023
- Market Volume, In Physical Terms, 2012–2023
- Market Value, 2012–2023
- Per Capita Consumption, By Country, 2018–2023
- Production, In Physical Terms, By Country, 2012–2023
- Imports, In Physical Terms, By Country, 2012–2023
- Imports, In Value Terms, By Country, 2012–2023
- Import Prices, By Country Of Destination, 2012–2023
- Exports, In Physical Terms, By Country, 2012–2023
- Exports, In Value Terms, By Country, 2012–2023
- Export Prices, By Country Of Origin, 2012–2023
-
LIST OF FIGURES
- Market Volume, In Physical Terms, 2012–2023
- Market Value, 2012–2023
- Consumption, By Country, 2023
- Market Volume Forecast to 2030
- Market Value Forecast to 2030
- Products: Market Size And Growth, By Type
- Products: Average Per Capita Consumption, By Type
- Products: Exports And Growth, By Type
- Products: Export Prices And Growth, By Type
- Production Volume And Growth
- Exports And Growth
- Export Prices And Growth
- Market Size And Growth
- Per Capita Consumption
- Imports And Growth
- Import Prices
- Production, In Physical Terms, 2012–2023
- Production, In Value Terms, 2012–2023
- Production, By Country, 2023
- Production, In Physical Terms, By Country, 2012–2023
- Imports, In Physical Terms, 2012–2023
- Imports, In Value Terms, 2012–2023
- Imports, In Physical Terms, By Country, 2023
- Imports, In Physical Terms, By Country, 2012–2023
- Imports, In Value Terms, By Country, 2012–2023
- Import Prices, By Country, 2012–2023
- Exports, In Physical Terms, 2012–2023
- Exports, In Value Terms, 2012–2023
- Exports, In Physical Terms, By Country, 2023
- Exports, In Physical Terms, By Country, 2012–2023
- Exports, In Value Terms, By Country, 2012–2023
- Export Prices, 2012–2023


