
World - Pumpkin (Squash And Gourds) - Market Analysis, Forecast, Size, Trends and Insights
Get instant access to more than 2 million reports, dashboards, and datasets on the IndexBox Platform.
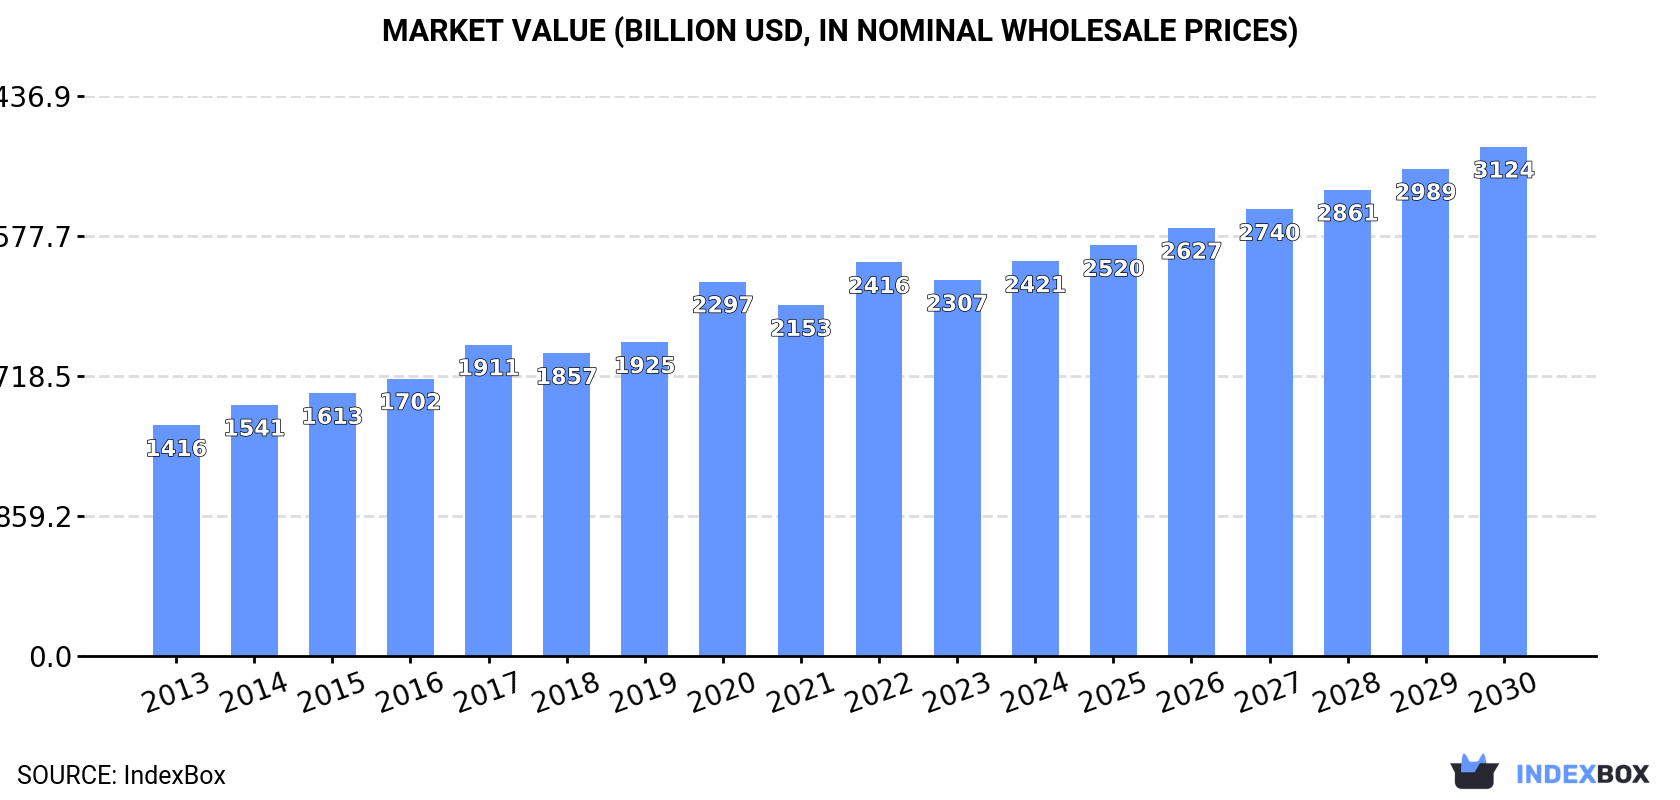
View PricingGlobal Pumpkin (Squash and Gourds) Market to Reach $3,124.5B by 2030 with +1.9% CAGR
IndexBox has just published a new report: World - Pumpkin (Squash And Gourds) - Market Analysis, Forecast, Size, Trends and Insights.
The article discusses the projected growth of the pumpkin market worldwide, expecting a rise in consumption over the next seven years. With an estimated CAGR of +1.9% in volume and +4.4% in value, the market is set to reach 3,240M tons and $3,124.5B by 2030.
Market Forecast
Driven by increasing demand for pumpkin (squash and gourds) worldwide, the market is expected to continue an upward consumption trend over the next seven-year period. Market performance is forecast to retain its current trend pattern, expanding with an anticipated CAGR of +1.9% for the period from 2023 to 2030, which is projected to bring the market volume to 3,240M tons by the end of 2030.
In value terms, the market is forecast to increase with an anticipated CAGR of +4.4% for the period from 2023 to 2030, which is projected to bring the market value to $3,124.5B (in nominal wholesale prices) by the end of 2030.
Consumption
World Consumption of Pumpkin
In 2023, global pumpkin consumption stood at 2,847M tons, approximately reflecting the year before. The total consumption volume increased at an average annual rate of +1.2% over the period from 2013 to 2023; the trend pattern remained consistent, with somewhat noticeable fluctuations being observed in certain years. The most prominent rate of growth was recorded in 2020 when the consumption volume increased by 3.1%. Global consumption peaked at 2,875M tons in 2021; however, from 2022 to 2023, consumption remained at a lower figure.
The global pumpkin market revenue fell modestly to $2,307.1B in 2023, which is down by -4.5% against the previous year. This figure reflects the total revenues of producers and importers (excluding logistics costs, retail marketing costs, and retailers' margins, which will be included in the final consumer price). In general, the total consumption indicated a resilient increase from 2013 to 2023: its value increased at an average annual rate of +5.0% over the last decade. The trend pattern, however, indicated some noticeable fluctuations being recorded throughout the analyzed period. Based on 2023 figures, consumption increased by +62.9% against 2013 indices. Over the period under review, the global market hit record highs at $2,415.9B in 2022, and then declined in the following year.
Consumption By Country
The countries with the highest volumes of consumption in 2023 were China (733M tons), India (544M tons) and Ukraine (121M tons), together comprising 49% of global consumption. Russia, the United States, Spain, Turkey, Mexico, Bangladesh, Italy, Indonesia and Pakistan lagged somewhat behind, together accounting for a further 23%.
From 2013 to 2023, the most notable rate of growth in terms of consumption, amongst the leading consuming countries, was attained by Bangladesh (with a CAGR of +6.6%), while consumption for the other global leaders experienced more modest paces of growth.
In value terms, China ($431B), India ($389.7B) and the United States ($137B) were the countries with the highest levels of market value in 2023, together comprising 42% of the global market.
India, with a CAGR of +13.1%, saw the highest growth rate of market size among the main consuming countries over the period under review, while market for the other global leaders experienced more modest paces of growth.
The countries with the highest levels of pumpkin per capita consumption in 2023 were Ukraine (2,786 kg per person), Spain (1,617 kg per person) and Italy (983 kg per person).
From 2013 to 2023, the most notable rate of growth in terms of consumption, amongst the main consuming countries, was attained by Bangladesh (with a CAGR of +5.5%), while consumption for the other global leaders experienced more modest paces of growth.
Production
World Production of Pumpkin
In 2023, the amount of pumpkin (squash and gourds) produced worldwide reached 2,848M tons, almost unchanged from 2022. The total output volume increased at an average annual rate of +1.2% over the period from 2013 to 2023; the trend pattern remained consistent, with somewhat noticeable fluctuations being recorded throughout the analyzed period. The most prominent rate of growth was recorded in 2020 when the production volume increased by 3.1%. Over the period under review, global production attained the peak volume at 2,875M tons in 2021; however, from 2022 to 2023, production failed to regain momentum. The general positive trend in terms output was largely conditioned by a slight increase of the harvested area and a relatively flat trend pattern in yield figures.
In value terms, pumpkin production dropped to $2,327.3B in 2023 estimated in export price. Overall, the total production indicated a buoyant expansion from 2013 to 2023: its value increased at an average annual rate of +5.0% over the last decade. The trend pattern, however, indicated some noticeable fluctuations being recorded throughout the analyzed period. Based on 2023 figures, production increased by +62.8% against 2013 indices. The pace of growth appeared the most rapid in 2020 when the production volume increased by 20%. Over the period under review, global production reached the maximum level at $2,451B in 2022, and then dropped in the following year.
Production By Country
The countries with the highest volumes of production in 2023 were China (733M tons), India (544M tons) and Ukraine (121M tons), with a combined 49% share of global production. Russia, the United States, Spain, Turkey, Mexico, Bangladesh, Italy, Indonesia and Pakistan lagged somewhat behind, together accounting for a further 23%.
From 2013 to 2023, the most notable rate of growth in terms of production, amongst the leading producing countries, was attained by Bangladesh (with a CAGR of +6.6%), while production for the other global leaders experienced more modest paces of growth.
Yield
In 2023, the global average yield of pumpkin (squash and gourds) amounted to 1,356 tons per ha, remaining stable against 2022 figures. Overall, the yield recorded a relatively flat trend pattern. The most prominent rate of growth was recorded in 2018 with an increase of 1.5%. The global yield peaked at 1,360 tons per ha in 2021; afterwards, it flattened through to 2023.
Harvested Area
The global pumpkin harvested area amounted to 2.1M ha in 2023, remaining constant against 2022. In general, the harvested area saw a relatively flat trend pattern. The most prominent rate of growth was recorded in 2015 with an increase of 4% against the previous year. Over the period under review, the harvested area dedicated to pumpkin production attained the peak figure at 2.1M ha in 2020; afterwards, it flattened through to 2023.
Imports
World Imports of Pumpkin
In 2023, purchases abroad of pumpkin (squash and gourds) decreased by -29.1% to 1.1M tons, falling for the second year in a row after four years of growth. Over the period under review, imports saw a relatively flat trend pattern. The most prominent rate of growth was recorded in 2016 with an increase of 15% against the previous year. Over the period under review, global imports reached the peak figure at 1.7M tons in 2021; however, from 2022 to 2023, imports stood at a somewhat lower figure.
In value terms, pumpkin imports fell dramatically to $1.3B in 2023. In general, imports saw a relatively flat trend pattern. The pace of growth appeared the most rapid in 2020 with an increase of 17%. Global imports peaked at $1.7B in 2022, and then declined markedly in the following year.
Imports By Country
The purchases of the twelve major importers of pumpkin (squash and gourds), namely France, Germany, the Netherlands, the UK, the United States, Russia, Japan, Canada, Italy, Singapore, Belgium and Spain, represented more than two-thirds of total import. Poland (27K tons) held a relatively small share of total imports.
From 2013 to 2023, the biggest increases were recorded for Poland (with a CAGR of +13.3%), while purchases for the other global leaders experienced more modest paces of growth.
In value terms, the largest pumpkin importing markets worldwide were France ($201M), Germany ($174M) and the UK ($107M), with a combined 38% share of global imports. The Netherlands, Canada, Japan, Italy, Belgium, the United States, Poland, Russia, Spain and Singapore lagged somewhat behind, together accounting for a further 38%.
In terms of the main importing countries, Poland, with a CAGR of +12.3%, recorded the highest rates of growth with regard to the value of imports, over the period under review, while purchases for the other global leaders experienced more modest paces of growth.
Import Prices By Country
In 2023, the average pumpkin import price amounted to $1,112 per ton, increasing by 6.2% against the previous year. In general, the import price saw a relatively flat trend pattern. The most prominent rate of growth was recorded in 2022 an increase of 16%. Over the period under review, average import prices attained the peak figure in 2023 and is expected to retain growth in the near future.
There were significant differences in the average prices amongst the major importing countries. In 2023, amid the top importers, the country with the highest price was Germany ($1,558 per ton), while Singapore ($461 per ton) was amongst the lowest.
From 2013 to 2023, the most notable rate of growth in terms of prices was attained by Japan (+3.3%), while the other global leaders experienced more modest paces of growth.
Exports
World Exports of Pumpkin
In 2023, the amount of pumpkin (squash and gourds) exported worldwide expanded slightly to 1.7M tons, picking up by 1.6% on 2022 figures. The total export volume increased at an average annual rate of +3.6% over the period from 2013 to 2023; however, the trend pattern indicated some noticeable fluctuations being recorded throughout the analyzed period. The pace of growth appeared the most rapid in 2016 with an increase of 17%. The global exports peaked at 1.9M tons in 2021; however, from 2022 to 2023, the exports failed to regain momentum.
In value terms, pumpkin exports totaled $1.6B in 2023. The total export value increased at an average annual rate of +3.3% over the period from 2013 to 2023; however, the trend pattern indicated some noticeable fluctuations being recorded in certain years. The growth pace was the most rapid in 2020 when exports increased by 16% against the previous year. Over the period under review, the global exports reached the maximum in 2023 and are likely to see gradual growth in the immediate term.
Exports By Country
Mexico (536K tons) and Spain (421K tons) represented roughly 58% of total exports in 2023. It was distantly followed by Turkey (100K tons), constituting a 6% share of total exports. Morocco (54K tons), the Netherlands (50K tons), the United States (47K tons), Iran (38K tons), France (34K tons), New Zealand (34K tons), Portugal (33K tons), Canada (31K tons), Italy (30K tons) and China (25K tons) took a minor share of total exports.
From 2013 to 2023, the biggest increases were recorded for Canada (with a CAGR of +9.4%), while shipments for the other global leaders experienced more modest paces of growth.
In value terms, the largest pumpkin supplying countries worldwide were Spain ($535M), Mexico ($496M) and Turkey ($76M), together comprising 67% of global exports. The Netherlands, the United States, Italy, France, Morocco, Portugal, New Zealand, Canada, China and Iran lagged somewhat behind, together comprising a further 23%.
China, with a CAGR of +15.2%, recorded the highest rates of growth with regard to the value of exports, among the main exporting countries over the period under review, while shipments for the other global leaders experienced more modest paces of growth.
Export Prices By Country
The average pumpkin export price stood at $987 per ton in 2023, therefore, remained relatively stable against the previous year. Over the period under review, the export price recorded a relatively flat trend pattern. The most prominent rate of growth was recorded in 2022 when the average export price increased by 20% against the previous year. The global export price peaked at $1,018 per ton in 2013; however, from 2014 to 2023, the export prices failed to regain momentum.
There were significant differences in the average prices amongst the major exporting countries. In 2023, amid the top suppliers, the country with the highest price was Italy ($1,700 per ton), while Iran ($230 per ton) was amongst the lowest.
From 2013 to 2023, the most notable rate of growth in terms of prices was attained by China (+6.3%), while the other global leaders experienced more modest paces of growth.
This report provides an in-depth analysis of the global pumpkin market. Within it, you will discover the latest data on market trends and opportunities by country, consumption, production and price developments, as well as the global trade (imports and exports). The forecast exhibits the market prospects through 2030.
Product coverage:
- FCL 394 - Pumpkins, squash and gourds
Country coverage:
Worldwide - the report contains statistical data for 200 countries and includes detailed profiles of the 50 largest consuming countries:
- USA
- China
- Japan
- Germany
- United Kingdom
- France
- Brazil
- Italy
- Russian Federation
- India
- Canada
- Australia
- Republic of Korea
- Spain
- Mexico
- Indonesia
- Netherlands
- Turkey
- Saudi Arabia
- Switzerland
- Sweden
- Nigeria
- Poland
- Belgium
- Argentina
- Norway
- Austria
- Thailand
- United Arab Emirates
- Colombia
- Denmark
- South Africa
- Malaysia
- Israel
- Singapore
- Egypt
- Philippines
- Finland
- Chile
- Ireland
- Pakistan
- Greece
- Portugal
- Kazakhstan
- Algeria
- Czech Republic
- Qatar
- Peru
- Romania
- Vietnam
+ the largest producing countries
Data coverage:
- Global market volume and value
- Per Capita consumption
- Forecast of the market dynamics in the medium term
- Global production, split by region and country
- Global trade (exports and imports)
- Export and import prices
- Market trends, drivers and restraints
- Key market players and their profiles
Reasons to buy this report:
- Take advantage of the latest data
- Find deeper insights into current market developments
- Discover vital success factors affecting the market
This report is designed for manufacturers, distributors, importers, and wholesalers, as well as for investors, consultants and advisors.
In this report, you can find information that helps you to make informed decisions on the following issues:
- How to diversify your business and benefit from new market opportunities
- How to load your idle production capacity
- How to boost your sales on overseas markets
- How to increase your profit margins
- How to make your supply chain more sustainable
- How to reduce your production and supply chain costs
- How to outsource production to other countries
- How to prepare your business for global expansion
While doing this research, we combine the accumulated expertise of our analysts and the capabilities of artificial intelligence. The AI-based platform, developed by our data scientists, constitutes the key working tool for business analysts, empowering them to discover deep insights and ideas from the marketing data.
-
1. INTRODUCTION
Making Data-Driven Decisions to Grow Your Business
- REPORT DESCRIPTION
- RESEARCH METHODOLOGY AND AI PLATFORM
- DATA-DRIVEN DECISIONS FOR YOUR BUSINESS
- GLOSSARY AND SPECIFIC TERMS
-
2. EXECUTIVE SUMMARY
A Quick Overview of Market Performance
- KEY FINDINGS
- MARKET TRENDS This Chapter is Available Only for the Professional Edition PRO
-
3. MARKET OVERVIEW
Understanding the Current State of The Market and Its Prospects
- MARKET SIZE
- CONSUMPTION BY COUNTRY
- MARKET FORECAST TO 2030
-
4. MOST PROMISING PRODUCT
Finding New Products to Diversify Your Business
This Chapter is Available Only for the Professional Edition PRO- TOP PRODUCTS TO DIVERSIFY YOUR BUSINESS
- BEST-SELLING PRODUCTS
- MOST CONSUMED PRODUCT
- MOST TRADED PRODUCT
- MOST PROFITABLE PRODUCT FOR EXPORT
-
5. MOST PROMISING SUPPLYING COUNTRIES
Choosing the Best Countries to Establish Your Sustainable Supply Chain
This Chapter is Available Only for the Professional Edition PRO- TOP COUNTRIES TO SOURCE YOUR PRODUCT
- TOP PRODUCING COUNTRIES
- COUNTRIES WITH TOP YIELDS
- TOP EXPORTING COUNTRIES
- LOW-COST EXPORTING COUNTRIES
-
6. MOST PROMISING OVERSEAS MARKETS
Choosing the Best Countries to Boost Your Exports
This Chapter is Available Only for the Professional Edition PRO- TOP OVERSEAS MARKETS FOR EXPORTING YOUR PRODUCT
- TOP CONSUMING MARKETS
- UNSATURATED MARKETS
- TOP IMPORTING MARKETS
- MOST PROFITABLE MARKETS
7. GLOBAL PRODUCTION
The Latest Trends and Insights into The Industry
- PRODUCTION VOLUME AND VALUE
- PRODUCTION BY COUNTRY
- HARVESTED AREA AND YIELD BY COUNTRY
8. GLOBAL IMPORTS
The Largest Importers on The Market and How They Succeed
- IMPORTS FROM 2012–2023
- IMPORTS BY COUNTRY
- IMPORT PRICES BY COUNTRY
9. GLOBAL EXPORTS
The Largest Exporters on The Market and How They Succeed
- EXPORTS FROM 2012–2023
- EXPORTS BY COUNTRY
- EXPORT PRICES BY COUNTRY
-
10. PROFILES OF MAJOR PRODUCERS
The Largest Producers on The Market and Their Profiles
This Chapter is Available Only for the Professional Edition PRO -
11. COUNTRY PROFILES
The Largest Markets And Their Profiles
This Chapter is Available Only for the Professional Edition PRO- United States
- China
- Japan
- Germany
- United Kingdom
- France
- Brazil
- Italy
- Russian Federation
- India
- Canada
- Australia
- Republic of Korea
- Spain
- Mexico
- Indonesia
- Netherlands
- Turkey
- Saudi Arabia
- Switzerland
- Sweden
- Nigeria
- Poland
- Belgium
- Argentina
- Norway
- Austria
- Thailand
- United Arab Emirates
- Colombia
- Denmark
- South Africa
- Malaysia
- Israel
- Singapore
- Egypt
- Philippines
- Finland
- Chile
- Ireland
- Pakistan
- Greece
- Portugal
- Kazakhstan
- Algeria
- Czech Republic
- Qatar
- Peru
- Romania
- Vietnam
-
LIST OF TABLES
- Key Findings In 2023
- Market Volume, In Physical Terms, 2012–2023
- Market Value, 2012–2023
- Per Capita Consumption, By Country, 2018–2023
- Production, In Physical Terms, By Country, 2012–2023
- Harvested Area, By Country, 2012-2023
- Yield, By Country, 2012-2023
- Imports, In Physical Terms, By Country, 2012–2023
- Imports, In Value Terms, By Country, 2012–2023
- Import Prices, By Country Of Destination, 2012–2023
- Exports, In Physical Terms, By Country, 2012–2023
- Exports, In Value Terms, By Country, 2012–2023
- Export Prices, By Country Of Origin, 2012–2023
-
LIST OF FIGURES
- Market Volume, In Physical Terms, 2012–2023
- Market Value, 2012–2023
- Consumption, By Country, 2023
- Market Volume Forecast to 2030
- Market Value Forecast to 2030
- Products: Market Size And Growth, By Type
- Products: Average Per Capita Consumption, By Type
- Products: Exports And Growth, By Type
- Products: Export Prices And Growth, By Type
- Production Volume And Growth
- Yield And Growth
- Exports And Growth
- Export Prices And Growth
- Market Size And Growth
- Per Capita Consumption
- Imports And Growth
- Import Prices
- Production, In Physical Terms, 2012–2023
- Production, In Value Terms, 2012–2023
- Area Harvested, 2012–2023
- Yield, 2012–2023
- Production, By Country, 2023
- Production, In Physical Terms, By Country, 2012–2023
- Harvested Area, By Country, 2023
- Harvested Area, By Country, 2012-2023
- Yield, By Country, 2012-2023
- Imports, In Physical Terms, 2012–2023
- Imports, In Value Terms, 2012–2023
- Imports, In Physical Terms, By Country, 2023
- Imports, In Physical Terms, By Country, 2012–2023
- Imports, In Value Terms, By Country, 2012–2023
- Import Prices, By Country, 2012–2023
- Exports, In Physical Terms, 2012–2023
- Exports, In Value Terms, 2012–2023
- Exports, In Physical Terms, By Country, 2023
- Exports, In Physical Terms, By Country, 2012–2023
- Exports, In Value Terms, By Country, 2012–2023
- Export Prices, 2012–2023


