Qatar - Refined Rape, Colza Or Mustard Oil - Market Analysis, Forecast, Size, Trends And Insights
Get instant access to more than 2 million reports, dashboards, and datasets on the IndexBox Platform.
View PricingDramatic Drop in Qatar's Refined Rapeseed Oil Imports to $2.5M in 2023
Qatar Refined Rapeseed Oil Imports
Refined rapeseed oil imports into Qatar shrank markedly to 1.3K tons in 2023, with a decrease of -33.9% on the previous year. In general, imports, however, continue to indicate significant growth. The most prominent rate of growth was recorded in 2022 with an increase of 485%. As a result, imports attained the peak of 2K tons, and then contracted sharply in the following year.
In value terms, refined rapeseed oil imports shrank rapidly to $2.5M (IndexBox estimates) in 2023. Over the period under review, imports, however, enjoyed significant growth. The growth pace was the most rapid in 2022 with an increase of 944% against the previous year. As a result, imports attained the peak of $4.6M, and then plummeted in the following year.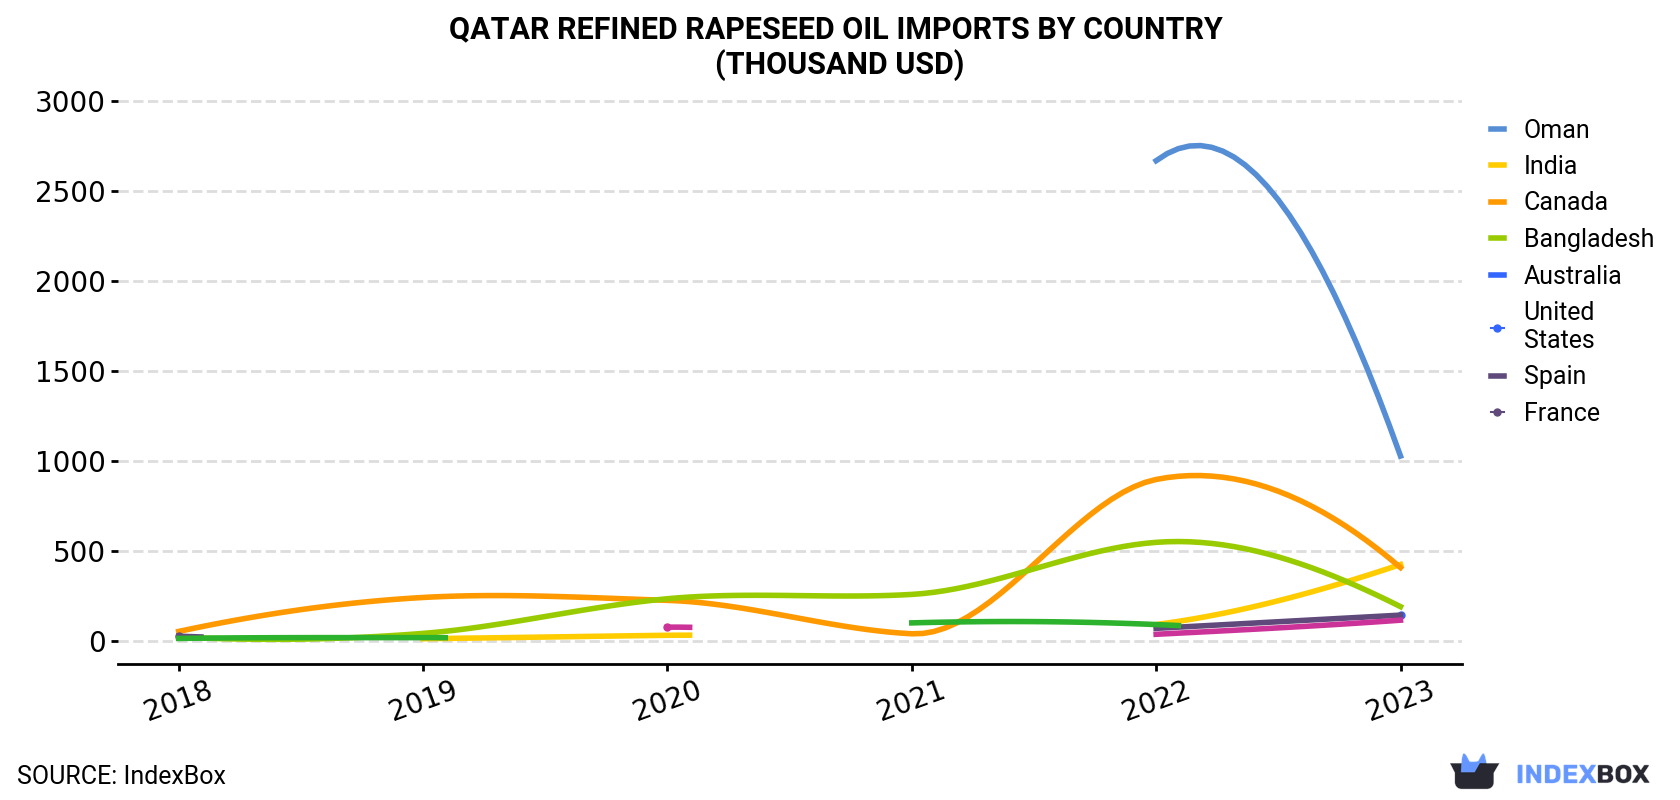
| COUNTRY | Import Value of Refined Rapeseed Oil in Qatar (thousand USD) | |||||
|---|---|---|---|---|---|---|
| 2018 | 2019 | 2020 | 2021 | 2022 | 2023 | |
| Oman | N/A | N/A | N/A | N/A | 2,668 | 1,029 |
| India | N/A | 15.2 | 34.1 | N/A | 93.8 | 427 |
| Canada | 55.5 | 244 | 228 | 42.5 | 899 | 410 |
| Bangladesh | 24.5 | 44.6 | 237 | 261 | 550 | 193 |
| Australia | N/A | N/A | N/A | N/A | N/A | 148 |
| United States | 29.0 | N/A | N/A | N/A | 72.7 | 146 |
| Spain | N/A | N/A | 79.2 | N/A | 39.7 | 118 |
| France | 16.8 | 21.1 | N/A | 103 | 93.7 | N/A |
| Others | 24.1 | 67.7 | 23.7 | 36.9 | 215 | 31.5 |
| Total | 150 | 393 | 602 | 443 | 4,632 | 2,503 |
Imports by Country
In 2023, Oman (519 tons) constituted the largest supplier of refined rapeseed oil to Qatar, with a 40% share of total imports. Moreover, refined rapeseed oil imports from Oman exceeded the figures recorded by the second-largest supplier, India (201 tons), threefold. Canada (183 tons) ranked third in terms of total imports with a 14% share.
From 2018 to 2023, the average annual growth rate of volume from Oman totaled -46.3%. The remaining supplying countries recorded the following average annual rates of imports growth: India (+130.3% per year) and Canada (+43.0% per year).
In value terms, Oman ($1M) constituted the largest supplier of refined rape, colza or mustard oil to Qatar, comprising 41% of total imports. The second position in the ranking was held by India ($427K), with a 17% share of total imports. It was followed by Canada, with a 16% share.
From 2018 to 2023, the average annual rate of growth in terms of value from Oman stood at -61.4%. The remaining supplying countries recorded the following average annual rates of imports growth: India (+130.2% per year) and Canada (+49.2% per year).
Import Prices by Country
In 2023, the refined rapeseed oil price amounted to $1,939 per ton (CIF, Qatar), which is down by -18.3% against the previous year. In general, the import price, however, showed a buoyant expansion. The most prominent rate of growth was recorded in 2022 an increase of 79% against the previous year. As a result, import price reached the peak level of $2,373 per ton, and then shrank remarkably in the following year.
There were significant differences in the average prices amongst the major supplying countries. In 2023, amid the top importers, the country with the highest price was the United States ($2,470 per ton), while the price for Australia ($1,357 per ton) was amongst the lowest.
From 2018 to 2023, the most notable rate of growth in terms of prices was attained by Poland (+15.2%), while the prices for the other major suppliers experienced more modest paces of growth.
This report provides an in-depth analysis of the refined rapeseed oil market in Qatar. Within it, you will discover the latest data on market trends and opportunities by country, consumption, production and price developments, as well as the global trade (imports and exports). The forecast exhibits the market prospects through 2030.
Product coverage:
- Prodcom 10415600 - Refined rape, colza or mustard oil and their fractions (excluding chemically modified)
Country coverage:
- Qatar
Data coverage:
- Market volume and value
- Per Capita consumption
- Forecast of the market dynamics in the medium term
- Trade (exports and imports) in Qatar
- Export and import prices
- Market trends, drivers and restraints
- Key market players and their profiles
Reasons to buy this report:
- Take advantage of the latest data
- Find deeper insights into current market developments
- Discover vital success factors affecting the market
This report is designed for manufacturers, distributors, importers, and wholesalers, as well as for investors, consultants and advisors.
In this report, you can find information that helps you to make informed decisions on the following issues:
- How to diversify your business and benefit from new market opportunities
- How to load your idle production capacity
- How to boost your sales on overseas markets
- How to increase your profit margins
- How to make your supply chain more sustainable
- How to reduce your production and supply chain costs
- How to outsource production to other countries
- How to prepare your business for global expansion
While doing this research, we combine the accumulated expertise of our analysts and the capabilities of artificial intelligence. The AI-based platform, developed by our data scientists, constitutes the key working tool for business analysts, empowering them to discover deep insights and ideas from the marketing data.
-
1. INTRODUCTION
Making Data-Driven Decisions to Grow Your Business
- REPORT DESCRIPTION
- RESEARCH METHODOLOGY AND AI PLATFORM
- DATA-DRIVEN DECISIONS FOR YOUR BUSINESS
- GLOSSARY AND SPECIFIC TERMS
-
2. EXECUTIVE SUMMARY
A Quick Overview of Market Performance
- KEY FINDINGS
- MARKET TRENDS This Chapter is Available Only for the Professional Edition PRO
-
3. MARKET OVERVIEW
Understanding the Current State of The Market and Its Prospects
- MARKET SIZE
- MARKET STRUCTURE
- TRADE BALANCE
- PER CAPITA CONSUMPTION
- MARKET FORECAST TO 2030
-
4. MOST PROMISING PRODUCT
Finding New Products to Diversify Your Business
This Chapter is Available Only for the Professional Edition PRO- TOP PRODUCTS TO DIVERSIFY YOUR BUSINESS
- BEST-SELLING PRODUCTS
- MOST CONSUMED PRODUCT
- MOST TRADED PRODUCT
- MOST PROFITABLE PRODUCT FOR EXPORT
-
5. MOST PROMISING SUPPLYING COUNTRIES
Choosing the Best Countries to Establish Your Sustainable Supply Chain
This Chapter is Available Only for the Professional Edition PRO- TOP COUNTRIES TO SOURCE YOUR PRODUCT
- TOP PRODUCING COUNTRIES
- TOP EXPORTING COUNTRIES
- LOW-COST EXPORTING COUNTRIES
-
6. MOST PROMISING OVERSEAS MARKETS
Choosing the Best Countries to Boost Your Exports
This Chapter is Available Only for the Professional Edition PRO- TOP OVERSEAS MARKETS FOR EXPORTING YOUR PRODUCT
- TOP CONSUMING MARKETS
- UNSATURATED MARKETS
- TOP IMPORTING MARKETS
- MOST PROFITABLE MARKETS
7. PRODUCTION
The Latest Trends and Insights into The Industry
- PRODUCTION VOLUME AND VALUE
8. IMPORTS
The Largest Import Supplying Countries
- IMPORTS FROM 2012–2023
- IMPORTS BY COUNTRY
- IMPORT PRICES BY COUNTRY
9. EXPORTS
The Largest Destinations for Exports
- EXPORTS FROM 2012–2023
- EXPORTS BY COUNTRY
- EXPORT PRICES BY COUNTRY
-
10. PROFILES OF MAJOR PRODUCERS
The Largest Producers on The Market and Their Profiles
This Chapter is Available Only for the Professional Edition PRO -
LIST OF TABLES
- Key Findings In 2023
- Market Volume, In Physical Terms, 2012–2023
- Market Value, 2012–2023
- Per Capita Consumption In 2012-2023
- Imports, In Physical Terms, By Country, 2012–2023
- Imports, In Value Terms, By Country, 2012–2023
- Import Prices, By Country Of Origin, 2012–2023
- Exports, In Physical Terms, By Country, 2012–2023
- Exports, In Value Terms, By Country, 2012–2023
- Export Prices, By Country Of Destination, 2012–2023
-
LIST OF FIGURES
- Market Volume, In Physical Terms, 2012–2023
- Market Value, 2012–2023
- Market Structure – Domestic Supply vs. Imports, In Physical Terms, 2012-2023
- Market Structure – Domestic Supply vs. Imports, In Value Terms, 2012-2023
- Trade Balance, In Physical Terms, 2012-2023
- Trade Balance, In Value Terms, 2012-2023
- Per Capita Consumption, 2012-2023
- Market Volume Forecast to 2030
- Market Value Forecast to 2030
- Products: Market Size And Growth, By Type
- Products: Average Per Capita Consumption, By Type
- Products: Exports And Growth, By Type
- Products: Export Prices And Growth, By Type
- Production Volume And Growth
- Exports And Growth
- Export Prices And Growth
- Market Size And Growth
- Per Capita Consumption
- Imports And Growth
- Import Prices
- Production, In Physical Terms, 2012–2023
- Production, In Value Terms, 2012–2023
- Imports, In Physical Terms, 2012–2023
- Imports, In Value Terms, 2012–2023
- Imports, In Physical Terms, By Country, 2023
- Imports, In Physical Terms, By Country, 2012–2023
- Imports, In Value Terms, By Country, 2012–2023
- Import Prices, By Country Of Origin, 2012–2023
- Exports, In Physical Terms, 2012–2023
- Exports, In Value Terms, 2012–2023
- Exports, In Physical Terms, By Country, 2023
- Exports, In Physical Terms, By Country, 2012–2023
- Exports, In Value Terms, By Country, 2012–2023
- Export Prices, By Country Of Destination, 2012–2023


