World - Refined Maize (Corn) Oil - Market Analysis, Forecast, Size, Trends And Insights
Get instant access to more than 2 million reports, dashboards, and datasets on the IndexBox Platform.
View PricingWorldwide Refined Maize Oil Market: Volume to Reach 7.9M Tons and Value to Hit $17.9B by 2030
IndexBox has just published a new report: World - Refined Maize (Corn) Oil - Market Analysis, Forecast, Size, Trends And Insights.
Driven by rising global demand for refined maize oil, the market is expected to see a slight increase in performance, with a forecasted CAGR of +2.7% in volume and +4.9% in value from 2023 to 2030. This growth trend is anticipated to continue over the next seven years.
Market Forecast
Driven by rising demand for refined maize oil worldwide, the market is expected to start an upward consumption trend over the next seven years. The performance of the market is forecast to increase slightly, with an anticipated CAGR of +2.7% for the period from 2023 to 2030, which is projected to bring the market volume to 7.9M tons by the end of 2030.
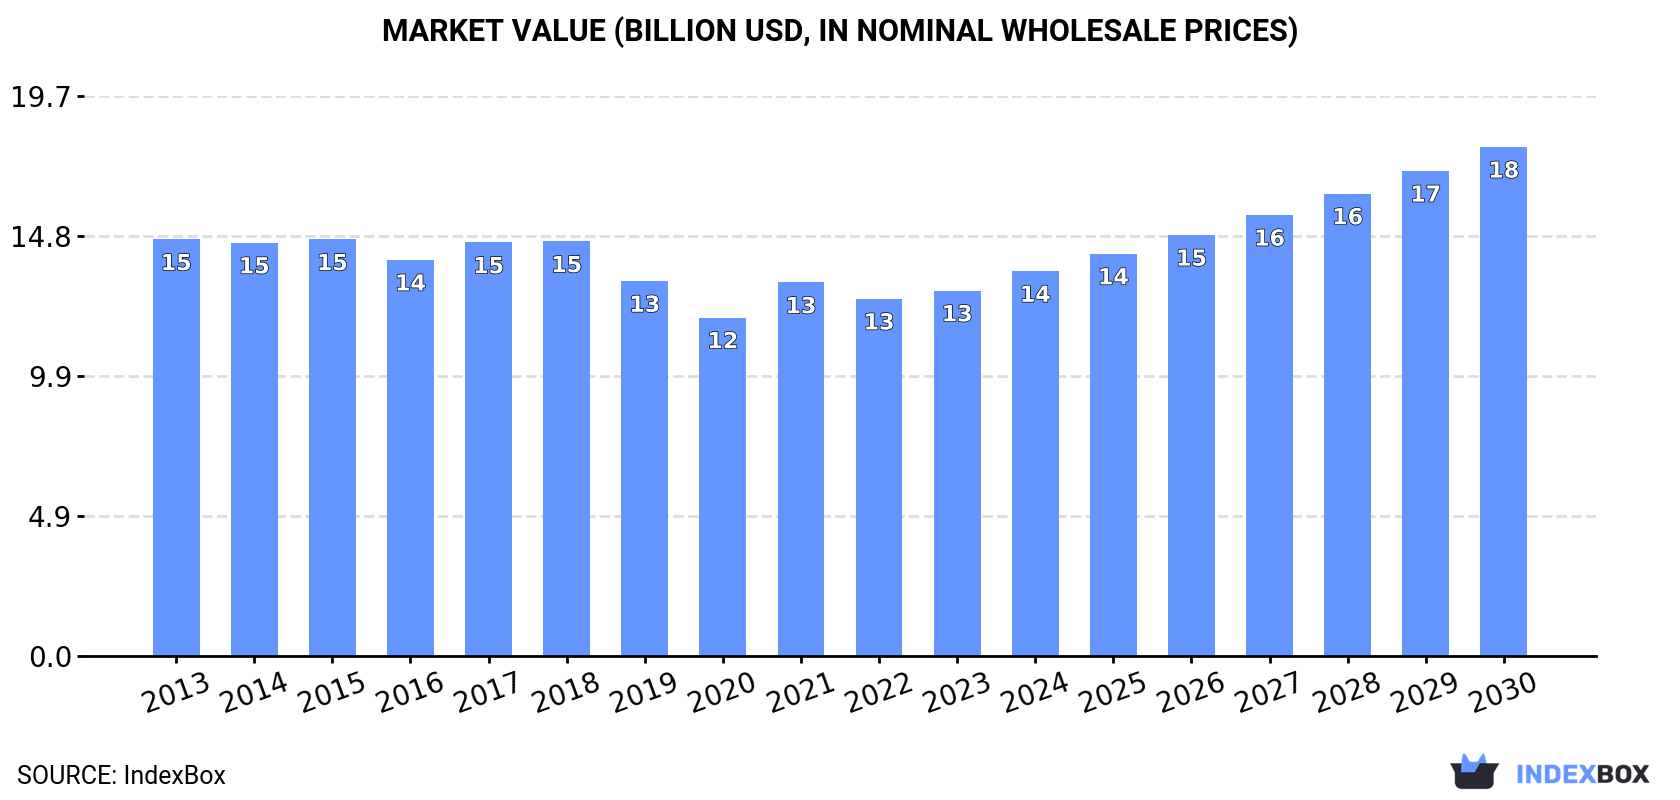
In value terms, the market is forecast to increase with an anticipated CAGR of +4.9% for the period from 2023 to 2030, which is projected to bring the market value to $17.9B (in in nominal wholesale prices) by the end of 2030.
Consumption
World Consumption of Refined Maize (Corn) Oil
In 2023, the amount of refined maize (corn) oil consumed worldwide dropped modestly to 6.5M tons, therefore, remained relatively stable against the previous year's figure. Over the period under review, consumption saw a slight contraction. Over the period under review, global consumption hit record highs at 8.5M tons in 2015; however, from 2016 to 2023, consumption failed to regain momentum.
The global refined maize oil market revenue totaled $12.9B in 2023, picking up by 2.3% against the previous year. This figure reflects the total revenues of producers and importers (excluding logistics costs, retail marketing costs, and retailers' margins, which will be included in the final consumer price). In general, consumption recorded a slight reduction. Over the period under review, the global market hit record highs at $14.7B in 2015; however, from 2016 to 2023, consumption stood at a somewhat lower figure.
Consumption By Country
China (1.2M tons) remains the largest refined maize oil consuming country worldwide, accounting for 19% of total volume. Moreover, refined maize oil consumption in China exceeded the figures recorded by the second-largest consumer, India (491K tons), twofold. The third position in this ranking was held by the United States (456K tons), with a 7% share.
From 2013 to 2023, the average annual rate of growth in terms of volume in China stood at +2.1%. In the other countries, the average annual rates were as follows: India (+1.5% per year) and the United States (-3.6% per year).
In value terms, China ($1.9B), India ($1.9B) and the United States ($639M) constituted the countries with the highest levels of market value in 2023, with a combined 35% share of the global market.
In terms of the main consuming countries, India, with a CAGR of +3.8%, saw the highest growth rate of market size over the period under review, while market for the other global leaders experienced more modest paces of growth.
The countries with the highest levels of refined maize oil per capita consumption in 2023 were Turkey (1,379 kg per 1000 persons), Russia (1,368 kg per 1000 persons) and the United States (1,351 kg per 1000 persons).
From 2013 to 2023, the most notable rate of growth in terms of consumption, amongst the key consuming countries, was attained by China (with a CAGR of +1.7%), while consumption for the other global leaders experienced mixed trends in the per capita consumption figures.
Production
World Production of Refined Maize (Corn) Oil
Global refined maize oil production contracted slightly to 6.5M tons in 2023, flattening at the year before. Over the period under review, production continues to indicate a slight decrease. The most prominent rate of growth was recorded in 2014 with an increase of 4.3% against the previous year. Global production peaked at 8.5M tons in 2015; however, from 2016 to 2023, production stood at a somewhat lower figure.
In value terms, refined maize oil production stood at $13.2B in 2023 estimated in export price. Overall, production showed a mild setback. The pace of growth was the most pronounced in 2021 with an increase of 15%. Over the period under review, global production hit record highs at $14.6B in 2013; however, from 2014 to 2023, production failed to regain momentum.
Production By Country
China (1.2M tons) constituted the country with the largest volume of refined maize oil production, accounting for 19% of total volume. Moreover, refined maize oil production in China exceeded the figures recorded by the second-largest producer, India (492K tons), threefold. The third position in this ranking was held by the United States (481K tons), with a 7.4% share.
In China, refined maize oil production increased at an average annual rate of +2.1% over the period from 2013-2023. In the other countries, the average annual rates were as follows: India (+1.5% per year) and the United States (-5.0% per year).
Imports
World Imports of Refined Maize (Corn) Oil
In 2023, global imports of refined maize (corn) oil was estimated at 281K tons, surging by 8.2% on 2022. Over the period under review, imports, however, recorded a perceptible curtailment. The pace of growth was the most pronounced in 2016 when imports increased by 19% against the previous year. Over the period under review, global imports attained the maximum at 511K tons in 2017; however, from 2018 to 2023, imports failed to regain momentum.
In value terms, refined maize oil imports contracted slightly to $529M in 2023. Overall, imports, however, continue to indicate a noticeable contraction. The pace of growth appeared the most rapid in 2021 when imports increased by 38%. Over the period under review, global imports reached the maximum at $746M in 2013; however, from 2014 to 2023, imports stood at a somewhat lower figure.
Imports By Country
In 2023, Libya (59K tons), distantly followed by the United States (28K tons), Kuwait (22K tons) and Tunisia (21K tons) represented the largest importers of refined maize (corn) oil, together mixing up 46% of total imports. The United Arab Emirates (13K tons), Jordan (10K tons), Canada (9.9K tons), Azerbaijan (9.4K tons), Qatar (7.2K tons), Saudi Arabia (7K tons), Oman (6.4K tons), Israel (6.1K tons) and Greece (6.1K tons) held a minor share of total imports.
Imports into Libya decreased at an average annual rate of -4.7% from 2013 to 2023. At the same time, Oman (+25.8%), Azerbaijan (+19.7%), Qatar (+5.6%) and the United States (+3.5%) displayed positive paces of growth. Moreover, Oman emerged as the fastest-growing importer imported in the world, with a CAGR of +25.8% from 2013-2023. Tunisia experienced a relatively flat trend pattern. By contrast, the United Arab Emirates (-1.5%), Israel (-3.5%), Jordan (-3.8%), Kuwait (-4.3%), Canada (-5.1%), Saudi Arabia (-5.9%) and Greece (-8.2%) illustrated a downward trend over the same period. While the share of the United States (+5.5 p.p.), Azerbaijan (+3 p.p.), Tunisia (+2.5 p.p.), Oman (+2.1 p.p.) and Qatar (+1.6 p.p.) increased significantly, the shares of the other countries remained relatively stable throughout the analyzed period.
In value terms, Libya ($111M) constitutes the largest market for imported refined maize (corn) oil worldwide, comprising 21% of global imports. The second position in the ranking was held by the United States ($51M), with a 9.7% share of global imports. It was followed by Kuwait, with a 7.5% share.
From 2013 to 2023, the average annual rate of growth in terms of value in Libya amounted to -2.1%. The remaining importing countries recorded the following average annual rates of imports growth: the United States (+6.8% per year) and Kuwait (-2.4% per year).
Import Prices By Country
In 2023, the average refined maize oil import price amounted to $1,882 per ton, with a decrease of -8.2% against the previous year. Overall, import price indicated a mild increase from 2013 to 2023: its price increased at an average annual rate of +1.2% over the last decade. The trend pattern, however, indicated some noticeable fluctuations being recorded throughout the analyzed period. Based on 2023 figures, refined maize oil import price increased by +57.4% against 2019 indices. The growth pace was the most rapid in 2021 an increase of 34%. Global import price peaked at $2,051 per ton in 2022, and then contracted in the following year.
Prices varied noticeably by country of destination: amid the top importers, the country with the highest price was Israel ($2,155 per ton), while Tunisia ($1,297 per ton) was amongst the lowest.
From 2013 to 2023, the most notable rate of growth in terms of prices was attained by Canada (+5.7%), while the other global leaders experienced more modest paces of growth.
Exports
World Exports of Refined Maize (Corn) Oil
In 2023, the amount of refined maize (corn) oil exported worldwide fell modestly to 283K tons, waning by -3.1% compared with the previous year's figure. Overall, exports saw a pronounced descent. The most prominent rate of growth was recorded in 2015 with an increase of 13% against the previous year. The global exports peaked at 489K tons in 2016; however, from 2017 to 2023, the exports stood at a somewhat lower figure.
In value terms, refined maize oil exports shrank sharply to $546M in 2023. In general, exports recorded a perceptible descent. The most prominent rate of growth was recorded in 2021 when exports increased by 30% against the previous year. The global exports peaked at $720M in 2013; however, from 2014 to 2023, the exports stood at a somewhat lower figure.
Exports By Country
In 2023, Turkey (55K tons) and the United States (54K tons) were the key exporters of refined maize (corn) oilaround the world, together resulting at near 38% of total exports. Belgium (25K tons) ranks next in terms of the total exports with an 8.8% share, followed by Tunisia (7.3%), Saudi Arabia (6.9%), Canada (6.7%) and Italy (4.6%). China (8.5K tons), Russia (7.3K tons), Egypt (6.7K tons), South Korea (5.7K tons), South Africa (5.4K tons) and Oman (4.3K tons) took a little share of total exports.
From 2013 to 2023, the biggest increases were recorded for South Africa (with a CAGR of +27.5%), while shipments for the other global leaders experienced more modest paces of growth.
In value terms, the United States ($97M), Turkey ($91M) and Belgium ($50M) constituted the countries with the highest levels of exports in 2023, together accounting for 44% of global exports. Saudi Arabia, Tunisia, Canada, Italy, China, Egypt, Russia, South Korea, Oman and South Africa lagged somewhat behind, together accounting for a further 40%.
Among the main exporting countries, South Africa, with a CAGR of +31.0%, saw the highest growth rate of the value of exports, over the period under review, while shipments for the other global leaders experienced more modest paces of growth.
Export Prices By Country
The average refined maize oil export price stood at $1,930 per ton in 2023, dropping by -12.4% against the previous year. In general, export price indicated slight growth from 2013 to 2023: its price increased at an average annual rate of +1.7% over the last decade. The trend pattern, however, indicated some noticeable fluctuations being recorded throughout the analyzed period. Based on 2023 figures, refined maize oil export price increased by +57.2% against 2019 indices. The growth pace was the most rapid in 2021 an increase of 28%. The global export price peaked at $2,203 per ton in 2022, and then shrank in the following year.
Prices varied noticeably by country of origin: amid the top suppliers, the country with the highest price was Saudi Arabia ($2,548 per ton), while Russia ($1,504 per ton) was amongst the lowest.
From 2013 to 2023, the most notable rate of growth in terms of prices was attained by Canada (+4.1%), while the other global leaders experienced more modest paces of growth.
This report provides an in-depth analysis of the global refined maize oil market. Within it, you will discover the latest data on market trends and opportunities by country, consumption, production and price developments, as well as the global trade (imports and exports). The forecast exhibits the market prospects through 2030.
Product coverage:
- Prodcom 10621460 - Refined maize (corn) oil and its fractions (excluding chemically modified)
Country coverage:
Worldwide - the report contains statistical data for 200 countries and includes detailed profiles of the 50 largest consuming countries:
- USA
- China
- Japan
- Germany
- United Kingdom
- France
- Brazil
- Italy
- Russian Federation
- India
- Canada
- Australia
- Republic of Korea
- Spain
- Mexico
- Indonesia
- Netherlands
- Turkey
- Saudi Arabia
- Switzerland
- Sweden
- Nigeria
- Poland
- Belgium
- Argentina
- Norway
- Austria
- Thailand
- United Arab Emirates
- Colombia
- Denmark
- South Africa
- Malaysia
- Israel
- Singapore
- Egypt
- Philippines
- Finland
- Chile
- Ireland
- Pakistan
- Greece
- Portugal
- Kazakhstan
- Algeria
- Czech Republic
- Qatar
- Peru
- Romania
- Vietnam
+ the largest producing countries
Data coverage:
- Global market volume and value
- Per Capita consumption
- Forecast of the market dynamics in the medium term
- Global production, split by region and country
- Global trade (exports and imports)
- Export and import prices
- Market trends, drivers and restraints
- Key market players and their profiles
Reasons to buy this report:
- Take advantage of the latest data
- Find deeper insights into current market developments
- Discover vital success factors affecting the market
This report is designed for manufacturers, distributors, importers, and wholesalers, as well as for investors, consultants and advisors.
In this report, you can find information that helps you to make informed decisions on the following issues:
- How to diversify your business and benefit from new market opportunities
- How to load your idle production capacity
- How to boost your sales on overseas markets
- How to increase your profit margins
- How to make your supply chain more sustainable
- How to reduce your production and supply chain costs
- How to outsource production to other countries
- How to prepare your business for global expansion
While doing this research, we combine the accumulated expertise of our analysts and the capabilities of artificial intelligence. The AI-based platform, developed by our data scientists, constitutes the key working tool for business analysts, empowering them to discover deep insights and ideas from the marketing data.
-
1. INTRODUCTION
Making Data-Driven Decisions to Grow Your Business
- REPORT DESCRIPTION
- RESEARCH METHODOLOGY AND AI PLATFORM
- DATA-DRIVEN DECISIONS FOR YOUR BUSINESS
- GLOSSARY AND SPECIFIC TERMS
-
2. EXECUTIVE SUMMARY
A Quick Overview of Market Performance
- KEY FINDINGS
- MARKET TRENDS This Chapter is Available Only for the Professional Edition PRO
-
3. MARKET OVERVIEW
Understanding the Current State of The Market and Its Prospects
- MARKET SIZE
- CONSUMPTION BY COUNTRY
- MARKET FORECAST TO 2030
-
4. MOST PROMISING PRODUCT
Finding New Products to Diversify Your Business
This Chapter is Available Only for the Professional Edition PRO- TOP PRODUCTS TO DIVERSIFY YOUR BUSINESS
- BEST-SELLING PRODUCTS
- MOST CONSUMED PRODUCT
- MOST TRADED PRODUCT
- MOST PROFITABLE PRODUCT FOR EXPORT
-
5. MOST PROMISING SUPPLYING COUNTRIES
Choosing the Best Countries to Establish Your Sustainable Supply Chain
This Chapter is Available Only for the Professional Edition PRO- TOP COUNTRIES TO SOURCE YOUR PRODUCT
- TOP PRODUCING COUNTRIES
- TOP EXPORTING COUNTRIES
- LOW-COST EXPORTING COUNTRIES
-
6. MOST PROMISING OVERSEAS MARKETS
Choosing the Best Countries to Boost Your Exports
This Chapter is Available Only for the Professional Edition PRO- TOP OVERSEAS MARKETS FOR EXPORTING YOUR PRODUCT
- TOP CONSUMING MARKETS
- UNSATURATED MARKETS
- TOP IMPORTING MARKETS
- MOST PROFITABLE MARKETS
7. GLOBAL PRODUCTION
The Latest Trends and Insights into The Industry
- PRODUCTION VOLUME AND VALUE
- PRODUCTION BY COUNTRY
8. GLOBAL IMPORTS
The Largest Importers on The Market and How They Succeed
- IMPORTS FROM 2012–2023
- IMPORTS BY COUNTRY
- IMPORT PRICES BY COUNTRY
9. GLOBAL EXPORTS
The Largest Exporters on The Market and How They Succeed
- EXPORTS FROM 2012–2023
- EXPORTS BY COUNTRY
- EXPORT PRICES BY COUNTRY
-
10. PROFILES OF MAJOR PRODUCERS
The Largest Producers on The Market and Their Profiles
This Chapter is Available Only for the Professional Edition PRO -
11. COUNTRY PROFILES
The Largest Markets And Their Profiles
This Chapter is Available Only for the Professional Edition PRO- United States
- China
- Japan
- Germany
- United Kingdom
- France
- Brazil
- Italy
- Russian Federation
- India
- Canada
- Australia
- Republic of Korea
- Spain
- Mexico
- Indonesia
- Netherlands
- Turkey
- Saudi Arabia
- Switzerland
- Sweden
- Nigeria
- Poland
- Belgium
- Argentina
- Norway
- Austria
- Thailand
- United Arab Emirates
- Colombia
- Denmark
- South Africa
- Malaysia
- Israel
- Singapore
- Egypt
- Philippines
- Finland
- Chile
- Ireland
- Pakistan
- Greece
- Portugal
- Kazakhstan
- Algeria
- Czech Republic
- Qatar
- Peru
- Romania
- Vietnam
-
LIST OF TABLES
- Key Findings In 2023
- Market Volume, In Physical Terms, 2012–2023
- Market Value, 2012–2023
- Per Capita Consumption, By Country, 2018–2023
- Production, In Physical Terms, By Country, 2012–2023
- Imports, In Physical Terms, By Country, 2012–2023
- Imports, In Value Terms, By Country, 2012–2023
- Import Prices, By Country Of Destination, 2012–2023
- Exports, In Physical Terms, By Country, 2012–2023
- Exports, In Value Terms, By Country, 2012–2023
- Export Prices, By Country Of Origin, 2012–2023
-
LIST OF FIGURES
- Market Volume, In Physical Terms, 2012–2023
- Market Value, 2012–2023
- Consumption, By Country, 2023
- Market Volume Forecast to 2030
- Market Value Forecast to 2030
- Products: Market Size And Growth, By Type
- Products: Average Per Capita Consumption, By Type
- Products: Exports And Growth, By Type
- Products: Export Prices And Growth, By Type
- Production Volume And Growth
- Exports And Growth
- Export Prices And Growth
- Market Size And Growth
- Per Capita Consumption
- Imports And Growth
- Import Prices
- Production, In Physical Terms, 2012–2023
- Production, In Value Terms, 2012–2023
- Production, By Country, 2023
- Production, In Physical Terms, By Country, 2012–2023
- Imports, In Physical Terms, 2012–2023
- Imports, In Value Terms, 2012–2023
- Imports, In Physical Terms, By Country, 2023
- Imports, In Physical Terms, By Country, 2012–2023
- Imports, In Value Terms, By Country, 2012–2023
- Import Prices, By Country, 2012–2023
- Exports, In Physical Terms, 2012–2023
- Exports, In Value Terms, 2012–2023
- Exports, In Physical Terms, By Country, 2023
- Exports, In Physical Terms, By Country, 2012–2023
- Exports, In Value Terms, By Country, 2012–2023
- Export Prices, 2012–2023


