World - Cow Peas (Dry) - Market Analysis, Forecast, Size, Trends and Insights
Get instant access to more than 2 million reports, dashboards, and datasets on the IndexBox Platform.
View PricingGlobal Shelled Beans Market: Volume to Reach 12M Tons and Value to Hit $7.9B by 2030
IndexBox has just published a new report: World - Cow Peas (Dry) - Market Analysis, Forecast, Size, Trends and Insights.
Driven by global demand, the market for shelled beans (dry) is expected to see significant growth, with market volume projected to reach 12M tons and market value to reach $7.9B by the end of 2030. This growth trend is forecasted to continue at a steady pace, reflecting the growing popularity and consumption of shelled beans on a global scale.
Market Forecast
Driven by increasing demand for shelled beans (dry) worldwide, the market is expected to continue an upward consumption trend over the next seven years. Market performance is forecast to accelerate, expanding with an anticipated CAGR of +3.3% for the period from 2023 to 2030, which is projected to bring the market volume to 12M tons by the end of 2030.
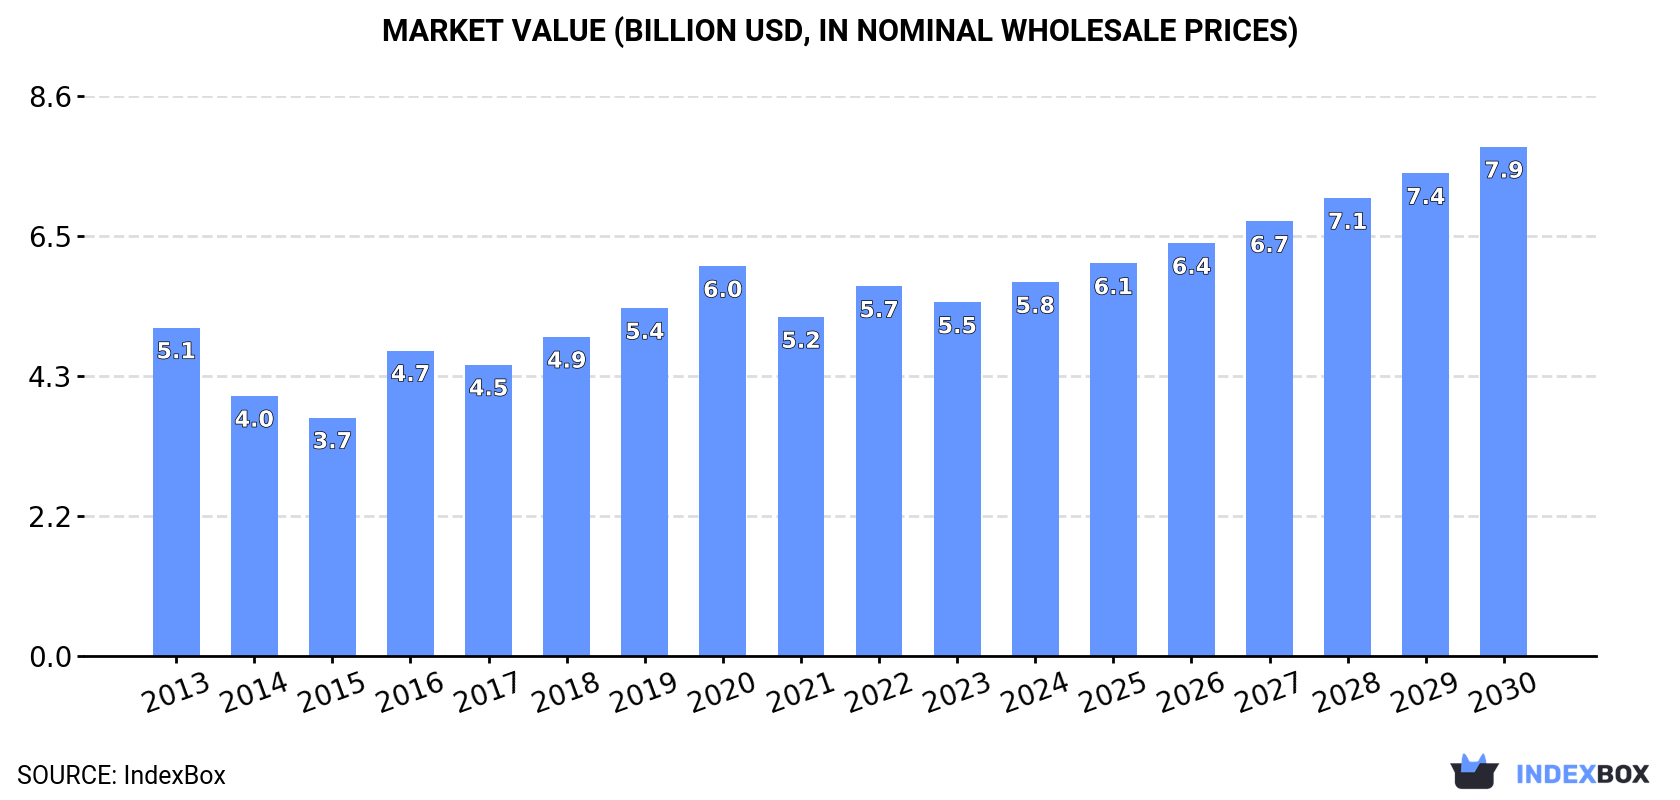
In value terms, the market is forecast to increase with an anticipated CAGR of +5.3% for the period from 2023 to 2030, which is projected to bring the market value to $7.9B (in nominal wholesale prices) by the end of 2030.
Consumption
World Consumption of Shelled Beans (Dry)
In 2023, the amount of shelled beans (dry) consumed worldwide contracted to 9.6M tons, waning by -7.1% compared with the previous year. Overall, consumption, however, recorded a relatively flat trend pattern. Global consumption peaked at 10M tons in 2022, and then shrank in the following year.
The global shelled bean market size declined modestly to $5.5B in 2023, which is down by -4.3% against the previous year. This figure reflects the total revenues of producers and importers (excluding logistics costs, retail marketing costs, and retailers' margins, which will be included in the final consumer price). Over the period under review, consumption, however, showed a relatively flat trend pattern. Global consumption peaked at $6B in 2020; however, from 2021 to 2023, consumption failed to regain momentum.
Consumption By Country
The countries with the highest volumes of consumption in 2023 were Nigeria (4.2M tons), Niger (2.3M tons) and Burkina Faso (642K tons), with a combined 74% share of global consumption. Ghana, Mali, Senegal, Kenya, Cameroon, Sudan and the United States lagged somewhat behind, together accounting for a further 15%.
From 2013 to 2023, the most notable rate of growth in terms of consumption, amongst the main consuming countries, was attained by Senegal (with a CAGR of +13.8%), while consumption for the other global leaders experienced more modest paces of growth.
In value terms, Nigeria ($2.3B) led the market, alone. The second position in the ranking was taken by Niger ($947M). It was followed by Senegal.
In Nigeria, the shelled bean market shrank by an average annual rate of -1.1% over the period from 2013-2023. In the other countries, the average annual rates were as follows: Niger (+2.7% per year) and Senegal (+19.2% per year).
In 2023, the highest levels of shelled bean per capita consumption was registered in Niger (84 kg per person), followed by Burkina Faso (28 kg per person), Nigeria (19 kg per person) and Mali (11 kg per person), while the world average per capita consumption of shelled bean was estimated at 1.2 kg per person.
From 2013 to 2023, the average annual growth rate of the shelled bean per capita consumption in Niger stood at -1.5%. In the other countries, the average annual rates were as follows: Burkina Faso (-2.1% per year) and Nigeria (-3.5% per year).
Production
World Production of Shelled Beans (Dry)
In 2023, the amount of shelled beans (dry) produced worldwide shrank to 9.9M tons, falling by -5.1% on the year before. In general, production, however, continues to indicate a relatively flat trend pattern. The most prominent rate of growth was recorded in 2016 when the production volume increased by 27%. Over the period under review, global production hit record highs at 10M tons in 2022, and then contracted in the following year. The general positive trend in terms output was largely conditioned by a relatively flat trend pattern of the harvested area and a mild descent in yield figures.
In value terms, shelled bean production declined slightly to $5.6B in 2023 estimated in export price. Overall, production, however, recorded slight growth. The most prominent rate of growth was recorded in 2016 with an increase of 33%. Over the period under review, global production attained the peak level at $6.2B in 2020; however, from 2021 to 2023, production stood at a somewhat lower figure.
Production By Country
The countries with the highest volumes of production in 2023 were Nigeria (4.2M tons), Niger (2.3M tons) and Burkina Faso (642K tons), with a combined 71% share of global production. Ghana, the United States, Mali, Canada, Senegal, Kenya, Cameroon, Sudan and Tanzania lagged somewhat behind, together comprising a further 19%.
From 2013 to 2023, the biggest increases were recorded for Senegal (with a CAGR of +13.5%), while production for the other global leaders experienced more modest paces of growth.
Yield
In 2023, the global average shelled bean yield reduced slightly to 665 kg per ha, waning by -3.3% compared with 2022. Overall, the yield showed a mild decline. The growth pace was the most rapid in 2016 with an increase of 12%. The global yield peaked at 751 kg per ha in 2013; however, from 2014 to 2023, the yield remained at a lower figure.
Harvested Area
In 2023, approx. 15M ha of shelled beans (dry) were harvested worldwide; dropping by -1.8% against 2022. The harvested area increased at an average annual rate of +2.0% over the period from 2013 to 2023; the trend pattern remained relatively stable, with only minor fluctuations being observed throughout the analyzed period. The most prominent rate of growth was recorded in 2016 with an increase of 13%. Over the period under review, the harvested area dedicated to shelled bean production attained the maximum at 15M ha in 2022, and then reduced slightly in the following year.
Imports
World Imports of Shelled Beans (Dry)
In 2023, the amount of shelled beans (dry) imported worldwide expanded markedly to 500K tons, growing by 5.1% against the previous year. Over the period under review, imports, however, recorded a relatively flat trend pattern. The pace of growth appeared the most rapid in 2017 when imports increased by 34%. As a result, imports reached the peak of 694K tons. From 2018 to 2023, the growth of global imports failed to regain momentum.
In value terms, shelled bean imports expanded sharply to $508M in 2023. The total import value increased at an average annual rate of +1.4% from 2013 to 2023; however, the trend pattern remained consistent, with only minor fluctuations being observed in certain years. The most prominent rate of growth was recorded in 2020 when imports increased by 36% against the previous year. Global imports peaked in 2023 and are expected to retain growth in the immediate term.
Imports By Country
The United States represented the largest importer of shelled beans (dry) in the world, with the volume of imports recording 130K tons, which was near 26% of total imports in 2023. The Dominican Republic (55K tons) held an 11% share (based on physical terms) of total imports, which put it in second place, followed by India (9.3%), Pakistan (8.4%), Afghanistan (5.4%) and Vietnam (4.7%). The following importers - Angola (15K tons), Japan (14K tons), Canada (11K tons), Rwanda (11K tons) and Haiti (9K tons) - together made up 12% of total imports.
Imports into the United States increased at an average annual rate of +5.4% from 2013 to 2023. At the same time, Rwanda (+49.2%), Vietnam (+18.6%), the Dominican Republic (+9.4%), Pakistan (+8.4%) and Angola (+7.5%) displayed positive paces of growth. Moreover, Rwanda emerged as the fastest-growing importer imported in the world, with a CAGR of +49.2% from 2013-2023. Haiti experienced a relatively flat trend pattern. By contrast, Afghanistan (-2.7%), Japan (-3.5%), Canada (-8.1%) and India (-10.1%) illustrated a downward trend over the same period. From 2013 to 2023, the share of the United States, the Dominican Republic, Pakistan, Vietnam, Rwanda and Angola increased by +11, +6.6, +4.7, +3.9, +2.2 and +1.6 percentage points, respectively. The shares of the other countries remained relatively stable throughout the analyzed period.
In value terms, the United States ($159M) constitutes the largest market for imported shelled beans (dry) worldwide, comprising 31% of global imports. The second position in the ranking was held by the Dominican Republic ($62M), with a 12% share of global imports. It was followed by India, with a 7.5% share.
From 2013 to 2023, the average annual rate of growth in terms of value in the United States totaled +5.6%. In the other countries, the average annual rates were as follows: the Dominican Republic (+10.5% per year) and India (-7.6% per year).
Import Prices By Country
In 2023, the average shelled bean import price amounted to $1,017 per ton, growing by 4.7% against the previous year. Over the period from 2013 to 2023, it increased at an average annual rate of +1.7%. The most prominent rate of growth was recorded in 2019 when the average import price increased by 33%. Global import price peaked in 2023 and is likely to see gradual growth in years to come.
There were significant differences in the average prices amongst the major importing countries. In 2023, amid the top importers, the country with the highest price was Japan ($1,446 per ton), while Rwanda ($218 per ton) was amongst the lowest.
From 2013 to 2023, the most notable rate of growth in terms of prices was attained by Angola (+6.9%), while the other global leaders experienced more modest paces of growth.
Exports
World Exports of Shelled Beans (Dry)
In 2023, approx. 797K tons of shelled beans (dry) were exported worldwide; increasing by 41% against 2022 figures. Overall, total exports indicated a noticeable increase from 2013 to 2023: its volume increased at an average annual rate of +4.1% over the last decade. The trend pattern, however, indicated some noticeable fluctuations being recorded throughout the analyzed period. The global exports peaked at 837K tons in 2017; however, from 2018 to 2023, the exports remained at a lower figure.
In value terms, shelled bean exports surged to $891M in 2023. In general, total exports indicated strong growth from 2013 to 2023: its value increased at an average annual rate of +5.6% over the last decade. The trend pattern, however, indicated some noticeable fluctuations being recorded throughout the analyzed period. As a result, the exports attained the peak and are likely to continue growth in the immediate term.
Exports By Country
In 2023, the United States (239K tons) and Canada (231K tons) represented the key exporters of shelled beans (dry)around the world, together recording approx. 59% of total exports. Uzbekistan (72K tons) held the next position in the ranking, followed by Madagascar (51K tons), Tanzania (47K tons) and Uganda (36K tons). All these countries together held near 26% share of total exports. Afghanistan (22K tons) followed a long way behind the leaders.
From 2013 to 2023, the biggest increases were recorded for Tanzania (with a CAGR of +28.9%), while shipments for the other global leaders experienced more modest paces of growth.
In value terms, the largest shelled bean supplying countries worldwide were the United States ($271M), Canada ($240M) and Uzbekistan ($197M), with a combined 79% share of global exports.
Among the main exporting countries, Uzbekistan, with a CAGR of +37.5%, recorded the highest growth rate of the value of exports, over the period under review, while shipments for the other global leaders experienced more modest paces of growth.
Export Prices By Country
The average shelled bean export price stood at $1,119 per ton in 2023, rising by 9.1% against the previous year. In general, export price indicated a slight expansion from 2013 to 2023: its price increased at an average annual rate of +1.5% over the last decade. The trend pattern, however, indicated some noticeable fluctuations being recorded throughout the analyzed period. Based on 2023 figures, shelled bean export price increased by +29.5% against 2021 indices. The growth pace was the most rapid in 2019 an increase of 28%. Over the period under review, the average export prices reached the peak figure in 2023 and is likely to continue growth in the near future.
There were significant differences in the average prices amongst the major exporting countries. In 2023, amid the top suppliers, the country with the highest price was Uzbekistan ($2,731 per ton), while Madagascar ($362 per ton) was amongst the lowest.
From 2013 to 2023, the most notable rate of growth in terms of prices was attained by Uzbekistan (+22.3%), while the other global leaders experienced more modest paces of growth.
This report provides an in-depth analysis of the global shelled bean market. Within it, you will discover the latest data on market trends and opportunities by country, consumption, production and price developments, as well as the global trade (imports and exports). The forecast exhibits the market prospects through 2030.
Product coverage:
- FCL 195 - Cow peas, dry
Country coverage:
Worldwide - the report contains statistical data for 200 countries and includes detailed profiles of the 50 largest consuming countries:
- USA
- China
- Japan
- Germany
- United Kingdom
- France
- Brazil
- Italy
- Russian Federation
- India
- Canada
- Australia
- Republic of Korea
- Spain
- Mexico
- Indonesia
- Netherlands
- Turkey
- Saudi Arabia
- Switzerland
- Sweden
- Nigeria
- Poland
- Belgium
- Argentina
- Norway
- Austria
- Thailand
- United Arab Emirates
- Colombia
- Denmark
- South Africa
- Malaysia
- Israel
- Singapore
- Egypt
- Philippines
- Finland
- Chile
- Ireland
- Pakistan
- Greece
- Portugal
- Kazakhstan
- Algeria
- Czech Republic
- Qatar
- Peru
- Romania
- Vietnam
+ the largest producing countries
Data coverage:
- Global market volume and value
- Per Capita consumption
- Forecast of the market dynamics in the medium term
- Global production, split by region and country
- Global trade (exports and imports)
- Export and import prices
- Market trends, drivers and restraints
- Key market players and their profiles
Reasons to buy this report:
- Take advantage of the latest data
- Find deeper insights into current market developments
- Discover vital success factors affecting the market
This report is designed for manufacturers, distributors, importers, and wholesalers, as well as for investors, consultants and advisors.
In this report, you can find information that helps you to make informed decisions on the following issues:
- How to diversify your business and benefit from new market opportunities
- How to load your idle production capacity
- How to boost your sales on overseas markets
- How to increase your profit margins
- How to make your supply chain more sustainable
- How to reduce your production and supply chain costs
- How to outsource production to other countries
- How to prepare your business for global expansion
While doing this research, we combine the accumulated expertise of our analysts and the capabilities of artificial intelligence. The AI-based platform, developed by our data scientists, constitutes the key working tool for business analysts, empowering them to discover deep insights and ideas from the marketing data.
-
1. INTRODUCTION
Making Data-Driven Decisions to Grow Your Business
- REPORT DESCRIPTION
- RESEARCH METHODOLOGY AND AI PLATFORM
- DATA-DRIVEN DECISIONS FOR YOUR BUSINESS
- GLOSSARY AND SPECIFIC TERMS
-
2. EXECUTIVE SUMMARY
A Quick Overview of Market Performance
- KEY FINDINGS
- MARKET TRENDS This Chapter is Available Only for the Professional Edition PRO
-
3. MARKET OVERVIEW
Understanding the Current State of The Market and Its Prospects
- MARKET SIZE
- CONSUMPTION BY COUNTRY
- MARKET FORECAST TO 2030
-
4. MOST PROMISING PRODUCT
Finding New Products to Diversify Your Business
This Chapter is Available Only for the Professional Edition PRO- TOP PRODUCTS TO DIVERSIFY YOUR BUSINESS
- BEST-SELLING PRODUCTS
- MOST CONSUMED PRODUCT
- MOST TRADED PRODUCT
- MOST PROFITABLE PRODUCT FOR EXPORT
-
5. MOST PROMISING SUPPLYING COUNTRIES
Choosing the Best Countries to Establish Your Sustainable Supply Chain
This Chapter is Available Only for the Professional Edition PRO- TOP COUNTRIES TO SOURCE YOUR PRODUCT
- TOP PRODUCING COUNTRIES
- COUNTRIES WITH TOP YIELDS
- TOP EXPORTING COUNTRIES
- LOW-COST EXPORTING COUNTRIES
-
6. MOST PROMISING OVERSEAS MARKETS
Choosing the Best Countries to Boost Your Exports
This Chapter is Available Only for the Professional Edition PRO- TOP OVERSEAS MARKETS FOR EXPORTING YOUR PRODUCT
- TOP CONSUMING MARKETS
- UNSATURATED MARKETS
- TOP IMPORTING MARKETS
- MOST PROFITABLE MARKETS
7. GLOBAL PRODUCTION
The Latest Trends and Insights into The Industry
- PRODUCTION VOLUME AND VALUE
- PRODUCTION BY COUNTRY
- HARVESTED AREA AND YIELD BY COUNTRY
8. GLOBAL IMPORTS
The Largest Importers on The Market and How They Succeed
- IMPORTS FROM 2012–2023
- IMPORTS BY COUNTRY
- IMPORT PRICES BY COUNTRY
9. GLOBAL EXPORTS
The Largest Exporters on The Market and How They Succeed
- EXPORTS FROM 2012–2023
- EXPORTS BY COUNTRY
- EXPORT PRICES BY COUNTRY
-
10. PROFILES OF MAJOR PRODUCERS
The Largest Producers on The Market and Their Profiles
This Chapter is Available Only for the Professional Edition PRO -
11. COUNTRY PROFILES
The Largest Markets And Their Profiles
This Chapter is Available Only for the Professional Edition PRO- United States
- China
- Japan
- Germany
- United Kingdom
- France
- Brazil
- Italy
- Russian Federation
- India
- Canada
- Australia
- Republic of Korea
- Spain
- Mexico
- Indonesia
- Netherlands
- Turkey
- Saudi Arabia
- Switzerland
- Sweden
- Nigeria
- Poland
- Belgium
- Argentina
- Norway
- Austria
- Thailand
- United Arab Emirates
- Colombia
- Denmark
- South Africa
- Malaysia
- Israel
- Singapore
- Egypt
- Philippines
- Finland
- Chile
- Ireland
- Pakistan
- Greece
- Portugal
- Kazakhstan
- Algeria
- Czech Republic
- Qatar
- Peru
- Romania
- Vietnam
-
LIST OF TABLES
- Key Findings In 2023
- Market Volume, In Physical Terms, 2012–2023
- Market Value, 2012–2023
- Per Capita Consumption, By Country, 2018–2023
- Production, In Physical Terms, By Country, 2012–2023
- Harvested Area, By Country, 2012-2023
- Yield, By Country, 2012-2023
- Imports, In Physical Terms, By Country, 2012–2023
- Imports, In Value Terms, By Country, 2012–2023
- Import Prices, By Country Of Destination, 2012–2023
- Exports, In Physical Terms, By Country, 2012–2023
- Exports, In Value Terms, By Country, 2012–2023
- Export Prices, By Country Of Origin, 2012–2023
-
LIST OF FIGURES
- Market Volume, In Physical Terms, 2012–2023
- Market Value, 2012–2023
- Consumption, By Country, 2023
- Market Volume Forecast to 2030
- Market Value Forecast to 2030
- Products: Market Size And Growth, By Type
- Products: Average Per Capita Consumption, By Type
- Products: Exports And Growth, By Type
- Products: Export Prices And Growth, By Type
- Production Volume And Growth
- Yield And Growth
- Exports And Growth
- Export Prices And Growth
- Market Size And Growth
- Per Capita Consumption
- Imports And Growth
- Import Prices
- Production, In Physical Terms, 2012–2023
- Production, In Value Terms, 2012–2023
- Area Harvested, 2012–2023
- Yield, 2012–2023
- Production, By Country, 2023
- Production, In Physical Terms, By Country, 2012–2023
- Harvested Area, By Country, 2023
- Harvested Area, By Country, 2012-2023
- Yield, By Country, 2012-2023
- Imports, In Physical Terms, 2012–2023
- Imports, In Value Terms, 2012–2023
- Imports, In Physical Terms, By Country, 2023
- Imports, In Physical Terms, By Country, 2012–2023
- Imports, In Value Terms, By Country, 2012–2023
- Import Prices, By Country, 2012–2023
- Exports, In Physical Terms, 2012–2023
- Exports, In Value Terms, 2012–2023
- Exports, In Physical Terms, By Country, 2023
- Exports, In Physical Terms, By Country, 2012–2023
- Exports, In Value Terms, By Country, 2012–2023
- Export Prices, 2012–2023


