
World - Silicones (In Primary Forms) - Market Analysis, Forecast, Size, Trends and Insights
Get instant access to more than 2 million reports, dashboards, and datasets on the IndexBox Platform.
View PricingGlobal Silicones Market to Witness Steady Growth with a CAGR of +3.8% through 2030, Reaching $37.8B in Value
IndexBox has just published a new report: World - Silicones (In Primary Forms) - Market Analysis, Forecast, Size, Trends and Insights.
The global silicone market is expected to continue its upward consumption trend over the next seven years, with a projected CAGR of +3.8% in volume and +6.1% in value from 2023 to 2030. This growth is mainly attributed to the rising demand for silicones in primary forms worldwide.
Market Forecast
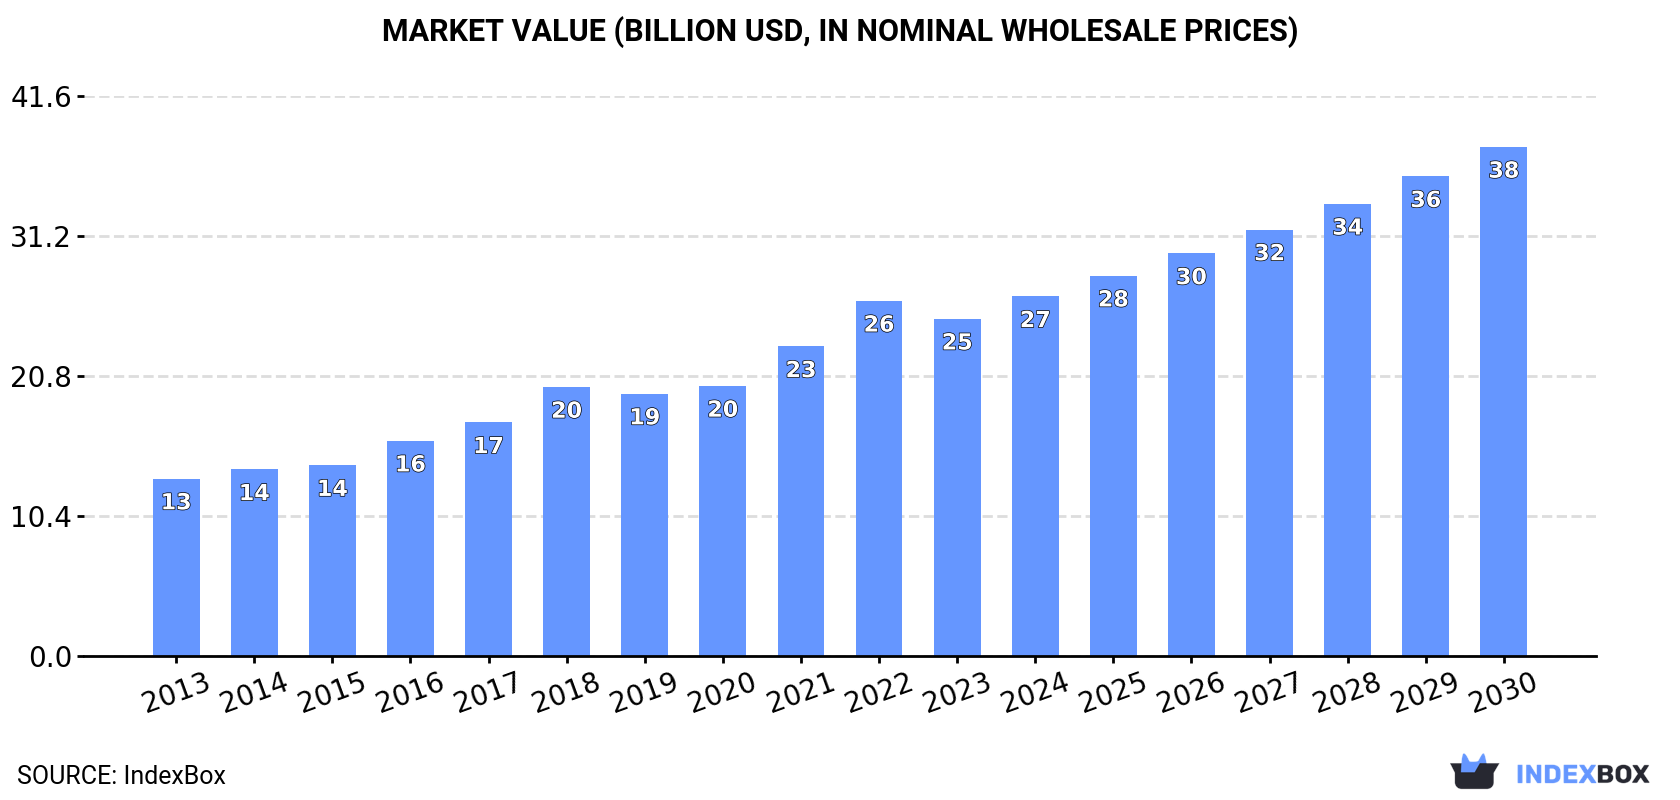
Driven by increasing demand for silicones (in primary forms) worldwide, the market is expected to continue an upward consumption trend over the next seven years. Market performance is forecast to retain its current trend pattern, expanding with an anticipated CAGR of +3.8% for the period from 2023 to 2030, which is projected to bring the market volume to 5.2M tons by the end of 2030.
In value terms, the market is forecast to increase with an anticipated CAGR of +6.1% for the period from 2023 to 2030, which is projected to bring the market value to $37.8B (in nominal wholesale prices) by the end of 2030.
Consumption
World Consumption of Silicones (In Primary Forms)
Global silicone consumption totaled 4M tons in 2023, approximately reflecting 2022. The total consumption volume increased at an average annual rate of +4.1% from 2013 to 2023; however, the trend pattern indicated some noticeable fluctuations being recorded in certain years. Global consumption peaked at 4.1M tons in 2021; however, from 2022 to 2023, consumption stood at a somewhat lower figure.
The global silicone market size shrank to $25.1B in 2023, with a decrease of -5% against the previous year. This figure reflects the total revenues of producers and importers (excluding logistics costs, retail marketing costs, and retailers' margins, which will be included in the final consumer price). Over the period under review, the total consumption indicated buoyant growth from 2013 to 2023: its value increased at an average annual rate of +6.6% over the last decade. The trend pattern, however, indicated some noticeable fluctuations being recorded throughout the analyzed period. Based on 2023 figures, consumption increased by +90.1% against 2013 indices. Global consumption peaked at $26.4B in 2022, and then shrank in the following year.
Consumption By Country
The countries with the highest volumes of consumption in 2023 were China (612K tons), Germany (578K tons) and the United States (397K tons), with a combined 39% share of global consumption.
From 2013 to 2023, the most notable rate of growth in terms of consumption, amongst the main consuming countries, was attained by the United States (with a CAGR of +12.4%), while consumption for the other global leaders experienced more modest paces of growth.
In value terms, Germany ($4.2B), the United States ($3.8B) and Japan ($2.2B) constituted the countries with the highest levels of market value in 2023, together accounting for 41% of the global market. China, South Korea, Mexico, India, France, the UK, Brazil, Turkey, Indonesia and Thailand lagged somewhat behind, together comprising a further 36%.
France, with a CAGR of +18.9%, recorded the highest growth rate of market size in terms of the main consuming countries over the period under review, while market for the other global leaders experienced more modest paces of growth.
The countries with the highest levels of silicone per capita consumption in 2023 were Germany (7 kg per person), South Korea (5 kg per person) and the UK (1.7 kg per person).
From 2013 to 2023, the most notable rate of growth in terms of consumption, amongst the leading consuming countries, was attained by the United States (with a CAGR of +11.7%), while consumption for the other global leaders experienced more modest paces of growth.
Production
World Production of Silicones (In Primary Forms)
Global silicone production reached 3.7M tons in 2023, picking up by 2.4% on the year before. Over the period under review, the total production indicated temperate growth from 2013 to 2023: its volume increased at an average annual rate of +4.6% over the last decade. The trend pattern, however, indicated some noticeable fluctuations being recorded throughout the analyzed period. Based on 2023 figures, production decreased by -2.0% against 2021 indices. The growth pace was the most rapid in 2017 when the production volume increased by 13%. Global production peaked at 3.7M tons in 2021; afterwards, it flattened through to 2023.
In value terms, silicone production dropped slightly to $22.5B in 2023 estimated in export price. In general, the total production indicated a strong increase from 2013 to 2023: its value increased at an average annual rate of +6.8% over the last decade. The trend pattern, however, indicated some noticeable fluctuations being recorded throughout the analyzed period. Based on 2023 figures, production increased by +93.2% against 2013 indices. The most prominent rate of growth was recorded in 2018 with an increase of 17%. Over the period under review, global production hit record highs at $23.4B in 2022, and then fell modestly in the following year.
Production By Country
The countries with the highest volumes of production in 2023 were China (914K tons), Germany (508K tons) and the United States (443K tons), together comprising 51% of global production. Japan, India, South Korea, the UK, France, Indonesia, Thailand, Turkey, Brazil and Mexico lagged somewhat behind, together comprising a further 37%.
From 2013 to 2023, the most notable rate of growth in terms of production, amongst the key producing countries, was attained by France (with a CAGR of +50.2%), while production for the other global leaders experienced more modest paces of growth.
Imports
World Imports of Silicones (In Primary Forms)
After three years of growth, overseas purchases of silicones (in primary forms) decreased by -12.6% to 1.6M tons in 2023. The total import volume increased at an average annual rate of +1.7% from 2013 to 2023; however, the trend pattern indicated some noticeable fluctuations being recorded throughout the analyzed period. The most prominent rate of growth was recorded in 2021 when imports increased by 13% against the previous year. Over the period under review, global imports attained the peak figure at 1.8M tons in 2022, and then dropped in the following year.
In value terms, silicone imports reduced dramatically to $9.3B in 2023. Over the period under review, total imports indicated a notable expansion from 2013 to 2023: its value increased at an average annual rate of +2.8% over the last decade. The trend pattern, however, indicated some noticeable fluctuations being recorded throughout the analyzed period. The pace of growth was the most pronounced in 2021 when imports increased by 30%. Over the period under review, global imports reached the peak figure at $11.7B in 2022, and then contracted rapidly in the following year.
Imports By Country
The purchases of the twelve major importers of silicones (in primary forms), namely Belgium, South Korea, the Netherlands, China, the United States, India, Germany, Mexico, Italy, Turkey, Vietnam and France, represented more than half of total import. Brazil (37K tons) held a minor share of total imports.
From 2013 to 2023, the biggest increases were recorded for Vietnam (with a CAGR of +14.1%), while purchases for the other global leaders experienced more modest paces of growth.
In value terms, China ($785M), the Netherlands ($664M) and the United States ($663M) constituted the countries with the highest levels of imports in 2023, together accounting for 23% of global imports. Belgium, South Korea, Germany, Italy, Mexico, France, India, Vietnam, Brazil and Turkey lagged somewhat behind, together comprising a further 41%.
Vietnam, with a CAGR of +14.4%, saw the highest growth rate of the value of imports, in terms of the main importing countries over the period under review, while purchases for the other global leaders experienced more modest paces of growth.
Import Prices By Country
In 2023, the average silicone import price amounted to $5,985 per ton, reducing by -9.4% against the previous year. Over the last decade, it increased at an average annual rate of +1.1%. The growth pace was the most rapid in 2022 when the average import price increased by 17%. As a result, import price attained the peak level of $6,606 per ton, and then shrank in the following year.
There were significant differences in the average prices amongst the major importing countries. In 2023, amid the top importers, the country with the highest price was France ($8,358 per ton), while India ($3,521 per ton) was amongst the lowest.
From 2013 to 2023, the most notable rate of growth in terms of prices was attained by Belgium (+3.7%), while the other global leaders experienced more modest paces of growth.
Exports
World Exports of Silicones (In Primary Forms)
In 2023, overseas shipments of silicones (in primary forms) decreased by -12.8% to 1.2M tons for the first time since 2019, thus ending a three-year rising trend. The total export volume increased at an average annual rate of +2.1% from 2013 to 2023; however, the trend pattern indicated some noticeable fluctuations being recorded in certain years. The growth pace was the most rapid in 2021 with an increase of 27%. The global exports peaked at 1.4M tons in 2022, and then shrank in the following year.
In value terms, silicone exports contracted significantly to $7.2B in 2023. In general, total exports indicated measured growth from 2013 to 2023: its value increased at an average annual rate of +3.4% over the last decade. The trend pattern, however, indicated some noticeable fluctuations being recorded throughout the analyzed period. The most prominent rate of growth was recorded in 2021 when exports increased by 45% against the previous year. Over the period under review, the global exports hit record highs at $9.1B in 2022, and then dropped notably in the following year.
Exports By Country
China was the main exporter of silicones (in primary forms) in the world, with the volume of exports resulting at 405K tons, which was approx. 34% of total exports in 2023. The United States (142K tons) held the second position in the ranking, followed by the UK (97K tons), Belgium (76K tons), the Netherlands (64K tons), Japan (59K tons) and France (57K tons). All these countries together held approx. 42% share of total exports. Thailand (46K tons), South Korea (46K tons), Italy (21K tons), India (21K tons) and Vietnam (18K tons) held a minor share of total exports.
Exports from China increased at an average annual rate of +15.6% from 2013 to 2023. At the same time, Vietnam (+56.0%), Italy (+3.3%) and India (+2.8%) displayed positive paces of growth. Moreover, Vietnam emerged as the fastest-growing exporter exported in the world, with a CAGR of +56.0% from 2013-2023. South Korea and Thailand experienced a relatively flat trend pattern. By contrast, the United States (-2.0%), Belgium (-3.1%), the Netherlands (-3.3%), Japan (-3.8%), the UK (-5.1%) and France (-18.1%) illustrated a downward trend over the same period. While the share of China (+24 p.p.), France (+4.8 p.p.) and Vietnam (+1.5 p.p.) increased significantly in terms of the global exports from 2013-2023, the share of the Netherlands (-3.9 p.p.), Japan (-4.2 p.p.), Belgium (-4.5 p.p.), the United States (-6.1 p.p.) and the UK (-8.9 p.p.) displayed negative dynamics. The shares of the other countries remained relatively stable throughout the analyzed period.
In value terms, the largest silicone supplying countries worldwide were the United States ($1.5B), China ($1.2B) and Japan ($714M), with a combined 47% share of global exports. The Netherlands, Belgium, the UK, France, South Korea, Thailand, Italy, India and Vietnam lagged somewhat behind, together comprising a further 40%.
In terms of the main exporting countries, Vietnam, with a CAGR of +49.6%, saw the highest rates of growth with regard to the value of exports, over the period under review, while shipments for the other global leaders experienced more modest paces of growth.
Export Prices By Country
In 2023, the average silicone export price amounted to $6,125 per ton, shrinking by -9.3% against the previous year. Over the last decade, it increased at an average annual rate of +1.3%. The growth pace was the most rapid in 2022 when the average export price increased by 17% against the previous year. As a result, the export price attained the peak level of $6,755 per ton, and then declined in the following year.
There were significant differences in the average prices amongst the major exporting countries. In 2023, amid the top suppliers, the country with the highest price was Japan ($12,058 per ton), while Vietnam ($2,914 per ton) was amongst the lowest.
From 2013 to 2023, the most notable rate of growth in terms of prices was attained by France (+20.6%), while the other global leaders experienced more modest paces of growth.
This report provides an in-depth analysis of the global silicone market. Within it, you will discover the latest data on market trends and opportunities by country, consumption, production and price developments, as well as the global trade (imports and exports). The forecast exhibits the market prospects through 2030.
Product coverage:
- Prodcom 20165700 - Silicones, in primary forms
Country coverage:
Worldwide - the report contains statistical data for 200 countries and includes detailed profiles of the 50 largest consuming countries:
- USA
- China
- Japan
- Germany
- United Kingdom
- France
- Brazil
- Italy
- Russian Federation
- India
- Canada
- Australia
- Republic of Korea
- Spain
- Mexico
- Indonesia
- Netherlands
- Turkey
- Saudi Arabia
- Switzerland
- Sweden
- Nigeria
- Poland
- Belgium
- Argentina
- Norway
- Austria
- Thailand
- United Arab Emirates
- Colombia
- Denmark
- South Africa
- Malaysia
- Israel
- Singapore
- Egypt
- Philippines
- Finland
- Chile
- Ireland
- Pakistan
- Greece
- Portugal
- Kazakhstan
- Algeria
- Czech Republic
- Qatar
- Peru
- Romania
- Vietnam
+ the largest producing countries
Data coverage:
- Global market volume and value
- Per Capita consumption
- Forecast of the market dynamics in the medium term
- Global production, split by region and country
- Global trade (exports and imports)
- Export and import prices
- Market trends, drivers and restraints
- Key market players and their profiles
Reasons to buy this report:
- Take advantage of the latest data
- Find deeper insights into current market developments
- Discover vital success factors affecting the market
This report is designed for manufacturers, distributors, importers, and wholesalers, as well as for investors, consultants and advisors.
In this report, you can find information that helps you to make informed decisions on the following issues:
- How to diversify your business and benefit from new market opportunities
- How to load your idle production capacity
- How to boost your sales on overseas markets
- How to increase your profit margins
- How to make your supply chain more sustainable
- How to reduce your production and supply chain costs
- How to outsource production to other countries
- How to prepare your business for global expansion
While doing this research, we combine the accumulated expertise of our analysts and the capabilities of artificial intelligence. The AI-based platform, developed by our data scientists, constitutes the key working tool for business analysts, empowering them to discover deep insights and ideas from the marketing data.
-
1. INTRODUCTION
Making Data-Driven Decisions to Grow Your Business
- REPORT DESCRIPTION
- RESEARCH METHODOLOGY AND AI PLATFORM
- DATA-DRIVEN DECISIONS FOR YOUR BUSINESS
- GLOSSARY AND SPECIFIC TERMS
-
2. EXECUTIVE SUMMARY
A Quick Overview of Market Performance
- KEY FINDINGS
- MARKET TRENDS This Chapter is Available Only for the Professional Edition PRO
-
3. MARKET OVERVIEW
Understanding the Current State of The Market and Its Prospects
- MARKET SIZE
- CONSUMPTION BY COUNTRY
- MARKET FORECAST TO 2030
-
4. MOST PROMISING PRODUCT
Finding New Products to Diversify Your Business
This Chapter is Available Only for the Professional Edition PRO- TOP PRODUCTS TO DIVERSIFY YOUR BUSINESS
- BEST-SELLING PRODUCTS
- MOST CONSUMED PRODUCT
- MOST TRADED PRODUCT
- MOST PROFITABLE PRODUCT FOR EXPORT
-
5. MOST PROMISING SUPPLYING COUNTRIES
Choosing the Best Countries to Establish Your Sustainable Supply Chain
This Chapter is Available Only for the Professional Edition PRO- TOP COUNTRIES TO SOURCE YOUR PRODUCT
- TOP PRODUCING COUNTRIES
- TOP EXPORTING COUNTRIES
- LOW-COST EXPORTING COUNTRIES
-
6. MOST PROMISING OVERSEAS MARKETS
Choosing the Best Countries to Boost Your Exports
This Chapter is Available Only for the Professional Edition PRO- TOP OVERSEAS MARKETS FOR EXPORTING YOUR PRODUCT
- TOP CONSUMING MARKETS
- UNSATURATED MARKETS
- TOP IMPORTING MARKETS
- MOST PROFITABLE MARKETS
7. GLOBAL PRODUCTION
The Latest Trends and Insights into The Industry
- PRODUCTION VOLUME AND VALUE
- PRODUCTION BY COUNTRY
8. GLOBAL IMPORTS
The Largest Importers on The Market and How They Succeed
- IMPORTS FROM 2012–2023
- IMPORTS BY COUNTRY
- IMPORT PRICES BY COUNTRY
9. GLOBAL EXPORTS
The Largest Exporters on The Market and How They Succeed
- EXPORTS FROM 2012–2023
- EXPORTS BY COUNTRY
- EXPORT PRICES BY COUNTRY
-
10. PROFILES OF MAJOR PRODUCERS
The Largest Producers on The Market and Their Profiles
This Chapter is Available Only for the Professional Edition PRO -
11. COUNTRY PROFILES
The Largest Markets And Their Profiles
This Chapter is Available Only for the Professional Edition PRO- United States
- China
- Japan
- Germany
- United Kingdom
- France
- Brazil
- Italy
- Russian Federation
- India
- Canada
- Australia
- Republic of Korea
- Spain
- Mexico
- Indonesia
- Netherlands
- Turkey
- Saudi Arabia
- Switzerland
- Sweden
- Nigeria
- Poland
- Belgium
- Argentina
- Norway
- Austria
- Thailand
- United Arab Emirates
- Colombia
- Denmark
- South Africa
- Malaysia
- Israel
- Singapore
- Egypt
- Philippines
- Finland
- Chile
- Ireland
- Pakistan
- Greece
- Portugal
- Kazakhstan
- Algeria
- Czech Republic
- Qatar
- Peru
- Romania
- Vietnam
-
LIST OF TABLES
- Key Findings In 2023
- Market Volume, In Physical Terms, 2012–2023
- Market Value, 2012–2023
- Per Capita Consumption, By Country, 2018–2023
- Production, In Physical Terms, By Country, 2012–2023
- Imports, In Physical Terms, By Country, 2012–2023
- Imports, In Value Terms, By Country, 2012–2023
- Import Prices, By Country Of Destination, 2012–2023
- Exports, In Physical Terms, By Country, 2012–2023
- Exports, In Value Terms, By Country, 2012–2023
- Export Prices, By Country Of Origin, 2012–2023
-
LIST OF FIGURES
- Market Volume, In Physical Terms, 2012–2023
- Market Value, 2012–2023
- Consumption, By Country, 2023
- Market Volume Forecast to 2030
- Market Value Forecast to 2030
- Products: Market Size And Growth, By Type
- Products: Average Per Capita Consumption, By Type
- Products: Exports And Growth, By Type
- Products: Export Prices And Growth, By Type
- Production Volume And Growth
- Exports And Growth
- Export Prices And Growth
- Market Size And Growth
- Per Capita Consumption
- Imports And Growth
- Import Prices
- Production, In Physical Terms, 2012–2023
- Production, In Value Terms, 2012–2023
- Production, By Country, 2023
- Production, In Physical Terms, By Country, 2012–2023
- Imports, In Physical Terms, 2012–2023
- Imports, In Value Terms, 2012–2023
- Imports, In Physical Terms, By Country, 2023
- Imports, In Physical Terms, By Country, 2012–2023
- Imports, In Value Terms, By Country, 2012–2023
- Import Prices, By Country, 2012–2023
- Exports, In Physical Terms, 2012–2023
- Exports, In Value Terms, 2012–2023
- Exports, In Physical Terms, By Country, 2023
- Exports, In Physical Terms, By Country, 2012–2023
- Exports, In Value Terms, By Country, 2012–2023
- Export Prices, 2012–2023


