World - Smoked Pacific, Atlantic And Danube Salmon - Market Analysis, Forecast, Size, Trends And Insights
Get instant access to more than 2 million reports, dashboards, and datasets on the IndexBox Platform.
View PricingGlobal Smoked Salmon Market to Experience Gradual Growth with CAGR of +0.5% Over Next Seven Years
IndexBox has just published a new report: World - Smoked Pacific, Atlantic And Danube Salmon - Market Analysis, Forecast, Size, Trends And Insights.
The demand for smoked salmon is on the rise globally, leading to a forecasted upward consumption trend over the next seven years. By 2030, the market volume is predicted to reach 1.8M tons, with a market value of $29.9B in nominal prices.
Market Forecast
Driven by rising demand for smoked salmon worldwide, the market is expected to start an upward consumption trend over the next seven-year period. The performance of the market is forecast to increase slightly, with an anticipated CAGR of +0.5% for the period from 2023 to 2030, which is projected to bring the market volume to 1.8M tons by the end of 2030.
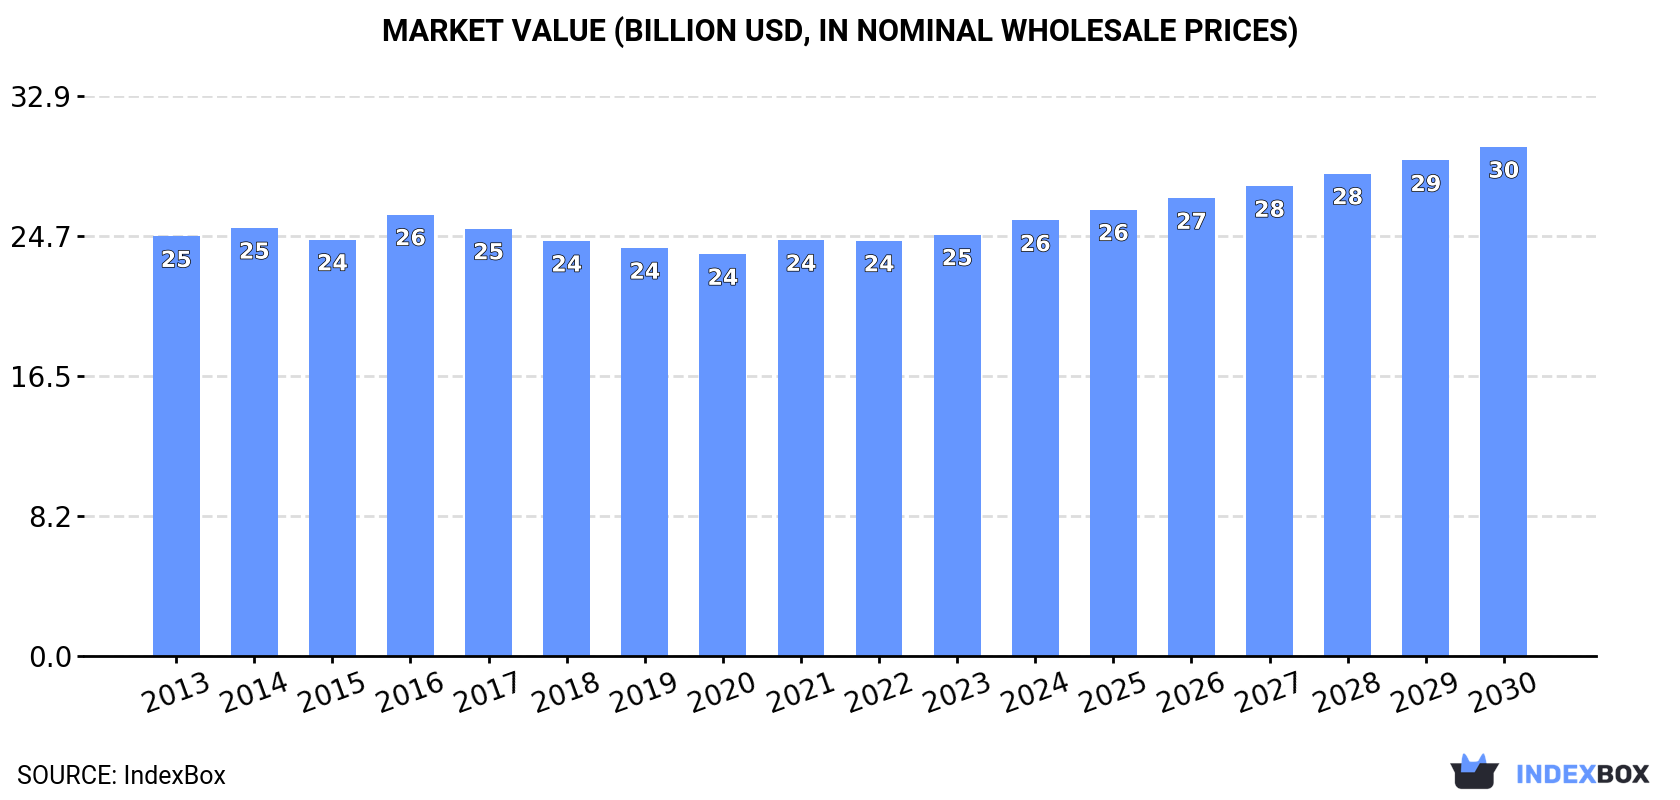
In value terms, the market is forecast to increase with an anticipated CAGR of +2.7% for the period from 2023 to 2030, which is projected to bring the market value to $29.9B (in nominal wholesale prices) by the end of 2030.
Consumption
World Consumption of Smoked Pacific, Atlantic And Danube Salmon
Global smoked salmon consumption stood at 1.7M tons in 2023, remaining constant against the year before. In general, consumption, however, recorded a relatively flat trend pattern. The pace of growth was the most pronounced in 2021 when the consumption volume increased by 3.5% against the previous year. Global consumption peaked at 1.7M tons in 2016; afterwards, it flattened through to 2023.
The global smoked salmon market size was estimated at $24.8B in 2023, remaining stable against the previous year. This figure reflects the total revenues of producers and importers (excluding logistics costs, retail marketing costs, and retailers' margins, which will be included in the final consumer price). Over the period under review, consumption recorded a relatively flat trend pattern. The growth pace was the most rapid in 2016 when the market value increased by 6% against the previous year. As a result, consumption attained the peak level of $26B. From 2017 to 2023, the growth of the global market remained at a somewhat lower figure.
Consumption By Country
The countries with the highest volumes of consumption in 2023 were China (418K tons), the United States (250K tons) and India (169K tons), together comprising 49% of global consumption. Indonesia, Nigeria, Russia, Bangladesh, Turkey, France, Iran, Canada, Saudi Arabia and the UK lagged somewhat behind, together comprising a further 26%.
From 2013 to 2023, the biggest increases were recorded for the UK (with a CAGR of +6.7%), while consumption for the other global leaders experienced more modest paces of growth.
In value terms, the largest smoked salmon markets worldwide were China ($5.9B), the United States ($4.8B) and India ($1.4B), with a combined 49% share of the global market. France, Bangladesh, Turkey, the UK, Russia, Canada, Iran, Indonesia, Saudi Arabia and Nigeria lagged somewhat behind, together accounting for a further 23%.
Among the main consuming countries, the UK, with a CAGR of +6.8%, recorded the highest rates of growth with regard to market size over the period under review, while market for the other global leaders experienced more modest paces of growth.
The countries with the highest levels of smoked salmon per capita consumption in 2023 were Saudi Arabia (805 kg per 1000 persons), Canada (790 kg per 1000 persons) and the United States (741 kg per 1000 persons).
From 2013 to 2023, the biggest increases were recorded for the UK (with a CAGR of +6.1%), while consumption for the other global leaders experienced more modest paces of growth.
Production
World Production of Smoked Pacific, Atlantic And Danube Salmon
In 2023, global production of smoked pacific, atlantic and danube salmon was estimated at 1.7M tons, stabilizing at the previous year. Over the period under review, production, however, saw a relatively flat trend pattern. The pace of growth appeared the most rapid in 2021 with an increase of 3.4%. Global production peaked at 1.7M tons in 2016; afterwards, it flattened through to 2023.
In value terms, smoked salmon production amounted to $24.2B in 2023 estimated in export price. In general, production, however, saw a relatively flat trend pattern. The most prominent rate of growth was recorded in 2016 when the production volume increased by 5.6% against the previous year. As a result, production attained the peak level of $25.8B. From 2017 to 2023, global production growth remained at a somewhat lower figure.
Production By Country
The countries with the highest volumes of production in 2023 were China (419K tons), the United States (240K tons) and India (168K tons), with a combined 49% share of global production. Poland, Indonesia, Nigeria, Russia, Bangladesh, Turkey, Iran, Canada, Saudi Arabia and the UK lagged somewhat behind, together accounting for a further 28%.
From 2013 to 2023, the most notable rate of growth in terms of production, amongst the leading producing countries, was attained by the UK (with a CAGR of +5.1%), while production for the other global leaders experienced more modest paces of growth.
Imports
World Imports of Smoked Pacific, Atlantic And Danube Salmon
After two years of growth, supplies from abroad of smoked pacific, atlantic and danube salmon decreased by -8.7% to 116K tons in 2023. The total import volume increased at an average annual rate of +1.3% from 2013 to 2023; the trend pattern remained relatively stable, with somewhat noticeable fluctuations being observed throughout the analyzed period. The most prominent rate of growth was recorded in 2021 with an increase of 11% against the previous year. Global imports peaked at 127K tons in 2022, and then declined in the following year.
In value terms, smoked salmon imports stood at $2.3B in 2023. The total import value increased at an average annual rate of +4.0% from 2013 to 2023; the trend pattern indicated some noticeable fluctuations being recorded in certain years. The most prominent rate of growth was recorded in 2016 when imports increased by 15% against the previous year. Global imports peaked in 2023 and are likely to see gradual growth in the near future.
Imports By Country
Germany (25K tons) and Italy (20K tons) represented roughly 40% of total imports in 2023. It was distantly followed by France (13K tons), the United States (9.8K tons), Belgium (6.9K tons) and Greece (5.7K tons), together constituting a 31% share of total imports. The following importers - Switzerland (3.9K tons), Australia (3.4K tons), Austria (3.2K tons), Denmark (2.2K tons), the UK (1.9K tons), Portugal (1.8K tons) and the Netherlands (1.8K tons) - together made up 16% of total imports.
From 2013 to 2023, the biggest increases were recorded for Greece (with a CAGR of +23.4%), while purchases for the other global leaders experienced more modest paces of growth.
In value terms, the largest smoked salmon importing markets worldwide were Germany ($507M), Italy ($408M) and the United States ($234M), with a combined 51% share of global imports. France, Belgium, Switzerland, Australia, Austria, Greece, the UK, Denmark, the Netherlands and Portugal lagged somewhat behind, together comprising a further 36%.
Greece, with a CAGR of +18.6%, recorded the highest rates of growth with regard to the value of imports, in terms of the main importing countries over the period under review, while purchases for the other global leaders experienced more modest paces of growth.
Import Prices By Country
The average smoked salmon import price stood at $19,621 per ton in 2023, jumping by 17% against the previous year. Over the period from 2013 to 2023, it increased at an average annual rate of +2.6%. The growth pace was the most rapid in 2017 an increase of 18%. Over the period under review, average import prices attained the peak figure in 2023 and is expected to retain growth in the near future.
Prices varied noticeably by country of destination: amid the top importers, the country with the highest price was Switzerland ($26,570 per ton), while Greece ($10,675 per ton) was amongst the lowest.
From 2013 to 2023, the most notable rate of growth in terms of prices was attained by the Netherlands (+6.6%), while the other global leaders experienced more modest paces of growth.
Exports
World Exports of Smoked Pacific, Atlantic And Danube Salmon
In 2023, the amount of smoked pacific, atlantic and danube salmon exported worldwide declined to 116K tons, reducing by -11.4% against 2022 figures. The total export volume increased at an average annual rate of +1.1% from 2013 to 2023; the trend pattern remained consistent, with somewhat noticeable fluctuations in certain years. The growth pace was the most rapid in 2021 with an increase of 9.8%. As a result, the exports reached the peak of 134K tons. From 2022 to 2023, the growth of the global exports failed to regain momentum.
In value terms, smoked salmon exports amounted to $2.4B in 2023. The total export value increased at an average annual rate of +3.8% from 2013 to 2023; the trend pattern indicated some noticeable fluctuations being recorded throughout the analyzed period. The pace of growth was the most pronounced in 2014 when exports increased by 11%. Over the period under review, the global exports reached the maximum in 2023 and are likely to see gradual growth in years to come.
Exports By Country
In 2023, Poland (52K tons) was the main exporter of smoked pacific, atlantic and danube salmon, committing 45% of total exports. It was distantly followed by Germany (12K tons), Lithuania (11K tons), the Netherlands (8.8K tons) and Denmark (8.7K tons), together generating a 35% share of total exports. France (3.1K tons), Greece (2.7K tons), Belgium (2.7K tons), the UK (2.5K tons), Chile (2.1K tons) and Norway (2K tons) followed a long way behind the leaders.
From 2013 to 2023, average annual rates of growth with regard to smoked salmon exports from Poland stood at +1.4%. At the same time, Belgium (+9.7%), Greece (+9.5%), the Netherlands (+9.4%) and Germany (+1.3%) displayed positive paces of growth. Moreover, Belgium emerged as the fastest-growing exporter exported in the world, with a CAGR of +9.7% from 2013-2023. Norway, Denmark and Lithuania experienced a relatively flat trend pattern. By contrast, Chile (-3.1%), France (-3.5%) and the UK (-6.2%) illustrated a downward trend over the same period. From 2013 to 2023, the share of the Netherlands increased by +4.2 percentage points. The shares of the other countries remained relatively stable throughout the analyzed period.
In value terms, Poland ($1.1B) remains the largest smoked salmon supplier worldwide, comprising 45% of global exports. The second position in the ranking was held by Germany ($253M), with an 11% share of global exports. It was followed by Lithuania, with an 8.8% share.
In Poland, smoked salmon exports expanded at an average annual rate of +4.4% over the period from 2013-2023. The remaining exporting countries recorded the following average annual rates of exports growth: Germany (+4.1% per year) and Lithuania (+3.0% per year).
Export Prices By Country
The average smoked salmon export price stood at $20,853 per ton in 2023, surging by 17% against the previous year. Over the period from 2013 to 2023, it increased at an average annual rate of +2.7%. As a result, the export price attained the peak level and is likely to continue growth in the immediate term.
Average prices varied somewhat amongst the major exporting countries. In 2023, major exporting countries recorded the following prices: in France ($26,110 per ton) and Belgium ($25,341 per ton), while Norway ($17,930 per ton) and Lithuania ($19,379 per ton) were amongst the lowest.
From 2013 to 2023, the most notable rate of growth in terms of prices was attained by Lithuania (+3.4%), while the other global leaders experienced more modest paces of growth.
This report provides an in-depth analysis of the global smoked salmon market. Within it, you will discover the latest data on market trends and opportunities by country, consumption, production and price developments, as well as the global trade (imports and exports). The forecast exhibits the market prospects through 2030.
Product coverage:
- Prodcom 10202420 -
- Prodcom 10202425 - Smoked Pacific, Atlantic and Danube salmon (including fillets, e xcluding heads, tails and maws)
Country coverage:
Worldwide - the report contains statistical data for 200 countries and includes detailed profiles of the 50 largest consuming countries:
- USA
- China
- Japan
- Germany
- United Kingdom
- France
- Brazil
- Italy
- Russian Federation
- India
- Canada
- Australia
- Republic of Korea
- Spain
- Mexico
- Indonesia
- Netherlands
- Turkey
- Saudi Arabia
- Switzerland
- Sweden
- Nigeria
- Poland
- Belgium
- Argentina
- Norway
- Austria
- Thailand
- United Arab Emirates
- Colombia
- Denmark
- South Africa
- Malaysia
- Israel
- Singapore
- Egypt
- Philippines
- Finland
- Chile
- Ireland
- Pakistan
- Greece
- Portugal
- Kazakhstan
- Algeria
- Czech Republic
- Qatar
- Peru
- Romania
- Vietnam
+ the largest producing countries
Data coverage:
- Global market volume and value
- Per Capita consumption
- Forecast of the market dynamics in the medium term
- Global production, split by region and country
- Global trade (exports and imports)
- Export and import prices
- Market trends, drivers and restraints
- Key market players and their profiles
Reasons to buy this report:
- Take advantage of the latest data
- Find deeper insights into current market developments
- Discover vital success factors affecting the market
This report is designed for manufacturers, distributors, importers, and wholesalers, as well as for investors, consultants and advisors.
In this report, you can find information that helps you to make informed decisions on the following issues:
- How to diversify your business and benefit from new market opportunities
- How to load your idle production capacity
- How to boost your sales on overseas markets
- How to increase your profit margins
- How to make your supply chain more sustainable
- How to reduce your production and supply chain costs
- How to outsource production to other countries
- How to prepare your business for global expansion
While doing this research, we combine the accumulated expertise of our analysts and the capabilities of artificial intelligence. The AI-based platform, developed by our data scientists, constitutes the key working tool for business analysts, empowering them to discover deep insights and ideas from the marketing data.
-
1. INTRODUCTION
Making Data-Driven Decisions to Grow Your Business
- REPORT DESCRIPTION
- RESEARCH METHODOLOGY AND AI PLATFORM
- DATA-DRIVEN DECISIONS FOR YOUR BUSINESS
- GLOSSARY AND SPECIFIC TERMS
-
2. EXECUTIVE SUMMARY
A Quick Overview of Market Performance
- KEY FINDINGS
- MARKET TRENDS This Chapter is Available Only for the Professional Edition PRO
-
3. MARKET OVERVIEW
Understanding the Current State of The Market and Its Prospects
- MARKET SIZE
- CONSUMPTION BY COUNTRY
- MARKET FORECAST TO 2030
-
4. MOST PROMISING PRODUCT
Finding New Products to Diversify Your Business
This Chapter is Available Only for the Professional Edition PRO- TOP PRODUCTS TO DIVERSIFY YOUR BUSINESS
- BEST-SELLING PRODUCTS
- MOST CONSUMED PRODUCT
- MOST TRADED PRODUCT
- MOST PROFITABLE PRODUCT FOR EXPORT
-
5. MOST PROMISING SUPPLYING COUNTRIES
Choosing the Best Countries to Establish Your Sustainable Supply Chain
This Chapter is Available Only for the Professional Edition PRO- TOP COUNTRIES TO SOURCE YOUR PRODUCT
- TOP PRODUCING COUNTRIES
- TOP EXPORTING COUNTRIES
- LOW-COST EXPORTING COUNTRIES
-
6. MOST PROMISING OVERSEAS MARKETS
Choosing the Best Countries to Boost Your Exports
This Chapter is Available Only for the Professional Edition PRO- TOP OVERSEAS MARKETS FOR EXPORTING YOUR PRODUCT
- TOP CONSUMING MARKETS
- UNSATURATED MARKETS
- TOP IMPORTING MARKETS
- MOST PROFITABLE MARKETS
7. GLOBAL PRODUCTION
The Latest Trends and Insights into The Industry
- PRODUCTION VOLUME AND VALUE
- PRODUCTION BY COUNTRY
8. GLOBAL IMPORTS
The Largest Importers on The Market and How They Succeed
- IMPORTS FROM 2012–2023
- IMPORTS BY COUNTRY
- IMPORT PRICES BY COUNTRY
9. GLOBAL EXPORTS
The Largest Exporters on The Market and How They Succeed
- EXPORTS FROM 2012–2023
- EXPORTS BY COUNTRY
- EXPORT PRICES BY COUNTRY
-
10. PROFILES OF MAJOR PRODUCERS
The Largest Producers on The Market and Their Profiles
This Chapter is Available Only for the Professional Edition PRO -
11. COUNTRY PROFILES
The Largest Markets And Their Profiles
This Chapter is Available Only for the Professional Edition PRO- United States
- China
- Japan
- Germany
- United Kingdom
- France
- Brazil
- Italy
- Russian Federation
- India
- Canada
- Australia
- Republic of Korea
- Spain
- Mexico
- Indonesia
- Netherlands
- Turkey
- Saudi Arabia
- Switzerland
- Sweden
- Nigeria
- Poland
- Belgium
- Argentina
- Norway
- Austria
- Thailand
- United Arab Emirates
- Colombia
- Denmark
- South Africa
- Malaysia
- Israel
- Singapore
- Egypt
- Philippines
- Finland
- Chile
- Ireland
- Pakistan
- Greece
- Portugal
- Kazakhstan
- Algeria
- Czech Republic
- Qatar
- Peru
- Romania
- Vietnam
-
LIST OF TABLES
- Key Findings In 2023
- Market Volume, In Physical Terms, 2012–2023
- Market Value, 2012–2023
- Per Capita Consumption, By Country, 2018–2023
- Production, In Physical Terms, By Country, 2012–2023
- Imports, In Physical Terms, By Country, 2012–2023
- Imports, In Value Terms, By Country, 2012–2023
- Import Prices, By Country Of Destination, 2012–2023
- Exports, In Physical Terms, By Country, 2012–2023
- Exports, In Value Terms, By Country, 2012–2023
- Export Prices, By Country Of Origin, 2012–2023
-
LIST OF FIGURES
- Market Volume, In Physical Terms, 2012–2023
- Market Value, 2012–2023
- Consumption, By Country, 2023
- Market Volume Forecast to 2030
- Market Value Forecast to 2030
- Products: Market Size And Growth, By Type
- Products: Average Per Capita Consumption, By Type
- Products: Exports And Growth, By Type
- Products: Export Prices And Growth, By Type
- Production Volume And Growth
- Exports And Growth
- Export Prices And Growth
- Market Size And Growth
- Per Capita Consumption
- Imports And Growth
- Import Prices
- Production, In Physical Terms, 2012–2023
- Production, In Value Terms, 2012–2023
- Production, By Country, 2023
- Production, In Physical Terms, By Country, 2012–2023
- Imports, In Physical Terms, 2012–2023
- Imports, In Value Terms, 2012–2023
- Imports, In Physical Terms, By Country, 2023
- Imports, In Physical Terms, By Country, 2012–2023
- Imports, In Value Terms, By Country, 2012–2023
- Import Prices, By Country, 2012–2023
- Exports, In Physical Terms, 2012–2023
- Exports, In Value Terms, 2012–2023
- Exports, In Physical Terms, By Country, 2023
- Exports, In Physical Terms, By Country, 2012–2023
- Exports, In Value Terms, By Country, 2012–2023
- Export Prices, 2012–2023


