South Africa - Chromates, Dichromates And Peroxochromates - Market Analysis, Forecast, Size, Trends And Insights
Get instant access to more than 2 million reports, dashboards, and datasets on the IndexBox Platform.
View PricingSouth Africa's Chromates Exports Decrease to $64M in 2023
South Africa Chromates Exports
In 2023, exports of chromates, dichromates and peroxochromates from South Africa expanded rapidly to 45K tons, growing by 11% compared with 2022 figures. Overall, total exports indicated a resilient increase from 2013 to 2023: its volume increased at an average annual rate of +10.0% over the last decade. The trend pattern, however, indicated some noticeable fluctuations being recorded throughout the analyzed period. Based on 2023 figures, exports increased by +26.0% against 2019 indices. The pace of growth appeared the most rapid in 2014 with an increase of 72%. The exports peaked in 2023 and are expected to retain growth in the immediate term.
In value terms, chromates exports dropped to $64M (IndexBox estimates) in 2023. In general, total exports indicated a strong increase from 2013 to 2023: its value increased at an average annual rate of +8.0% over the last decade. The trend pattern, however, indicated some noticeable fluctuations being recorded throughout the analyzed period. Based on 2023 figures, exports increased by +44.4% against 2019 indices. The pace of growth was the most pronounced in 2014 with an increase of 48% against the previous year. The exports peaked at $69M in 2022, and then contracted in the following year.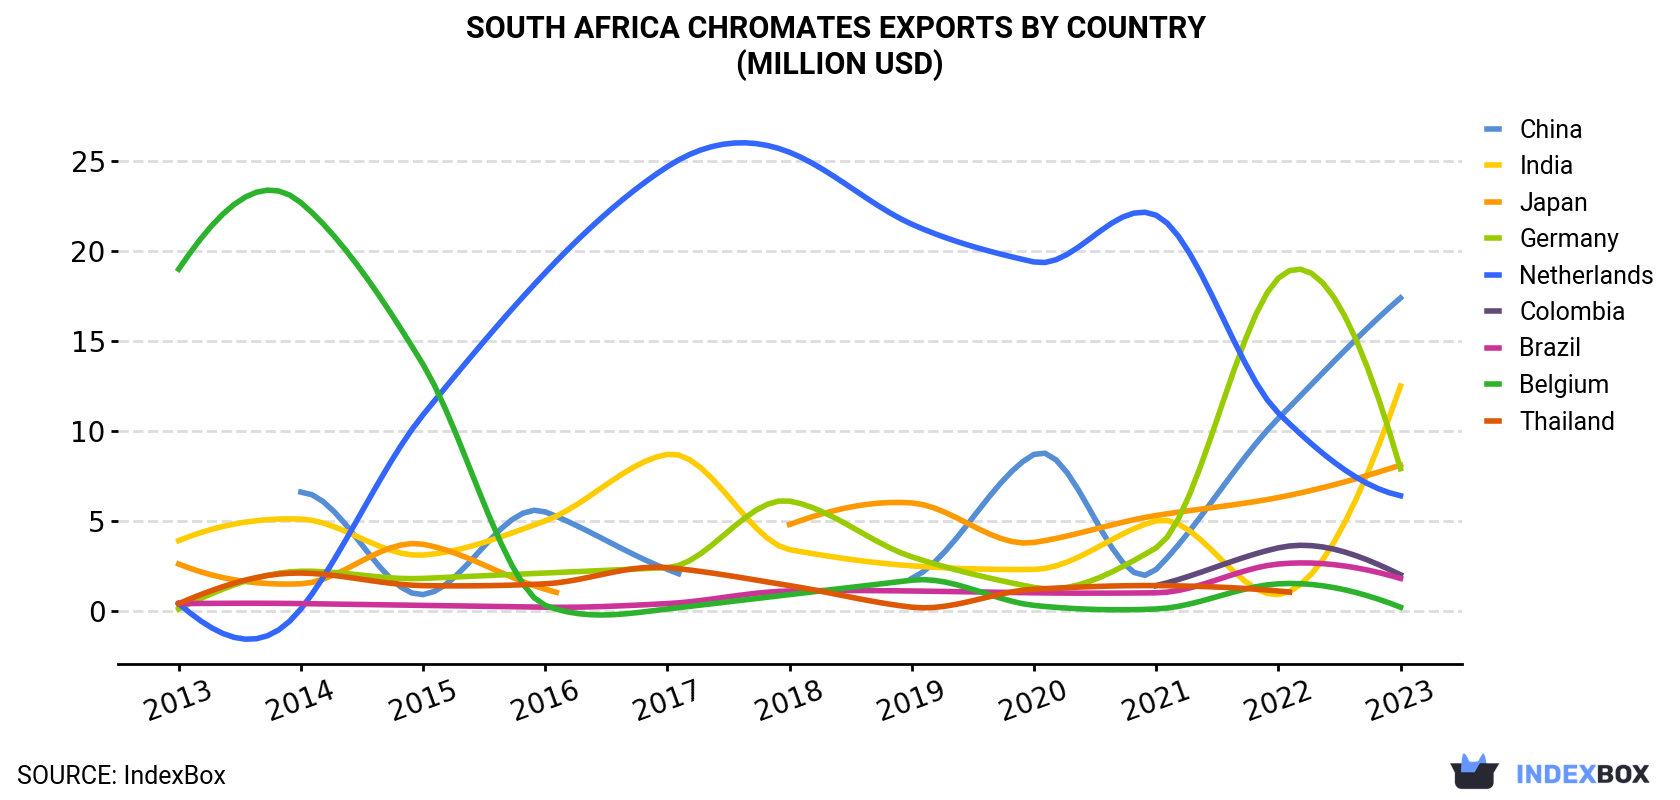
| COUNTRY | Export Value of Chromates in South Africa (million USD) | ||||||||||
|---|---|---|---|---|---|---|---|---|---|---|---|
| 2013 | 2014 | 2015 | 2016 | 2017 | 2018 | 2019 | 2020 | 2021 | 2022 | 2023 | |
| China | N/A | 6.6 | 0.9 | 5.5 | 2.3 | N/A | 1.8 | 8.7 | 2.3 | 10.7 | 17.4 |
| India | 3.9 | 5.1 | 3.1 | 5.0 | 8.7 | 3.4 | 2.5 | 2.3 | 5.0 | 0.9 | 12.5 |
| Japan | 2.6 | 1.5 | 3.7 | 1.2 | N/A | 4.8 | 6.0 | 3.8 | 5.3 | 6.3 | 8.1 |
| Germany | 0.1 | 2.2 | 1.8 | 2.1 | 2.4 | 6.1 | 3.0 | 1.3 | 3.5 | 18.5 | 7.9 |
| Netherlands | 0.4 | 0.1 | 10.9 | 18.8 | 24.7 | 25.5 | 21.5 | 19.4 | 22.0 | 11.0 | 6.4 |
| Colombia | N/A | N/A | N/A | N/A | N/A | N/A | N/A | N/A | 1.4 | 3.5 | 2.0 |
| Brazil | 0.4 | 0.4 | 0.3 | 0.2 | 0.4 | 1.1 | 1.1 | 1.0 | 1.0 | 2.6 | 1.8 |
| Belgium | 19.0 | 22.7 | 13.7 | 0.3 | 0.1 | 0.9 | 1.7 | 0.3 | 0.1 | 1.5 | 0.2 |
| Thailand | 0.4 | 2.1 | 1.4 | 1.5 | 2.4 | 1.4 | 0.2 | 1.2 | 1.4 | 1.1 | N/A |
| Others | 2.7 | 3.0 | 1.5 | 2.8 | 5.4 | 6.0 | 6.4 | 6.6 | 8.0 | 12.6 | 7.6 |
| Total | 29.5 | 43.7 | 37.3 | 37.2 | 46.5 | 49.2 | 44.3 | 44.7 | 49.9 | 68.7 | 63.9 |
Exports by Country
China (13K tons), India (9K tons) and Germany (5.7K tons) were the main destinations of chromates exports from South Africa, with a combined 61% share of total exports.
From 2013 to 2023, the biggest increases were recorded for China (with a CAGR of +323.3%), while shipments for the other leaders experienced more modest paces of growth.
In value terms, China ($17M), India ($13M) and Japan ($8.1M) were the largest markets for chromates exported from South Africa worldwide, together comprising 59% of total exports.
In terms of the main countries of destination, China, with a CAGR of +320.8%, recorded the highest growth rate of the value of exports, over the period under review, while shipments for the other leaders experienced more modest paces of growth.
Export Prices by Country
In 2023, the chromates price stood at $1,420 per ton (FOB, South Africa), with a decrease of -19.6% against the previous year. Over the period under review, the export price continues to indicate a slight reduction. The most prominent rate of growth was recorded in 2022 an increase of 48%. As a result, the export price reached the peak level of $1,766 per ton, and then fell significantly in the following year.
There were significant differences in the average prices for the major export markets. In 2023, amid the top suppliers, the country with the highest price was Belgium ($2,175 per ton), while the average price for exports to the Netherlands ($1,272 per ton) was amongst the lowest.
From 2013 to 2023, the most notable rate of growth in terms of prices was recorded for supplies to Romania (+3.1%), while the prices for the other major destinations experienced more modest paces of growth.
This report provides an in-depth analysis of the chromates market in South Africa. Within it, you will discover the latest data on market trends and opportunities by country, consumption, production and price developments, as well as the global trade (imports and exports). The forecast exhibits the market prospects through 2030.
Product coverage:
- Prodcom 20135125 - Chromates and dichromates, peroxochromates
Country coverage:
Data coverage:
- Market volume and value
- Per Capita consumption
- Forecast of the market dynamics in the medium term
- Trade (exports and imports) in South Africa
- Export and import prices
- Market trends, drivers and restraints
- Key market players and their profiles
Reasons to buy this report:
- Take advantage of the latest data
- Find deeper insights into current market developments
- Discover vital success factors affecting the market
This report is designed for manufacturers, distributors, importers, and wholesalers, as well as for investors, consultants and advisors.
In this report, you can find information that helps you to make informed decisions on the following issues:
- How to diversify your business and benefit from new market opportunities
- How to load your idle production capacity
- How to boost your sales on overseas markets
- How to increase your profit margins
- How to make your supply chain more sustainable
- How to reduce your production and supply chain costs
- How to outsource production to other countries
- How to prepare your business for global expansion
While doing this research, we combine the accumulated expertise of our analysts and the capabilities of artificial intelligence. The AI-based platform, developed by our data scientists, constitutes the key working tool for business analysts, empowering them to discover deep insights and ideas from the marketing data.
-
1. INTRODUCTION
Making Data-Driven Decisions to Grow Your Business
- REPORT DESCRIPTION
- RESEARCH METHODOLOGY AND AI PLATFORM
- DATA-DRIVEN DECISIONS FOR YOUR BUSINESS
- GLOSSARY AND SPECIFIC TERMS
-
2. EXECUTIVE SUMMARY
A Quick Overview of Market Performance
- KEY FINDINGS
- MARKET TRENDS This Chapter is Available Only for the Professional Edition PRO
-
3. MARKET OVERVIEW
Understanding the Current State of The Market and Its Prospects
- MARKET SIZE
- MARKET STRUCTURE
- TRADE BALANCE
- PER CAPITA CONSUMPTION
- MARKET FORECAST TO 2030
-
4. MOST PROMISING PRODUCT
Finding New Products to Diversify Your Business
This Chapter is Available Only for the Professional Edition PRO- TOP PRODUCTS TO DIVERSIFY YOUR BUSINESS
- BEST-SELLING PRODUCTS
- MOST CONSUMED PRODUCT
- MOST TRADED PRODUCT
- MOST PROFITABLE PRODUCT FOR EXPORT
-
5. MOST PROMISING SUPPLYING COUNTRIES
Choosing the Best Countries to Establish Your Sustainable Supply Chain
This Chapter is Available Only for the Professional Edition PRO- TOP COUNTRIES TO SOURCE YOUR PRODUCT
- TOP PRODUCING COUNTRIES
- TOP EXPORTING COUNTRIES
- LOW-COST EXPORTING COUNTRIES
-
6. MOST PROMISING OVERSEAS MARKETS
Choosing the Best Countries to Boost Your Exports
This Chapter is Available Only for the Professional Edition PRO- TOP OVERSEAS MARKETS FOR EXPORTING YOUR PRODUCT
- TOP CONSUMING MARKETS
- UNSATURATED MARKETS
- TOP IMPORTING MARKETS
- MOST PROFITABLE MARKETS
7. PRODUCTION
The Latest Trends and Insights into The Industry
- PRODUCTION VOLUME AND VALUE
8. IMPORTS
The Largest Import Supplying Countries
- IMPORTS FROM 2012–2023
- IMPORTS BY COUNTRY
- IMPORT PRICES BY COUNTRY
9. EXPORTS
The Largest Destinations for Exports
- EXPORTS FROM 2012–2023
- EXPORTS BY COUNTRY
- EXPORT PRICES BY COUNTRY
-
10. PROFILES OF MAJOR PRODUCERS
The Largest Producers on The Market and Their Profiles
This Chapter is Available Only for the Professional Edition PRO -
LIST OF TABLES
- Key Findings In 2023
- Market Volume, In Physical Terms, 2012–2023
- Market Value, 2012–2023
- Per Capita Consumption In 2012-2023
- Imports, In Physical Terms, By Country, 2012–2023
- Imports, In Value Terms, By Country, 2012–2023
- Import Prices, By Country Of Origin, 2012–2023
- Exports, In Physical Terms, By Country, 2012–2023
- Exports, In Value Terms, By Country, 2012–2023
- Export Prices, By Country Of Destination, 2012–2023
-
LIST OF FIGURES
- Market Volume, In Physical Terms, 2012–2023
- Market Value, 2012–2023
- Market Structure – Domestic Supply vs. Imports, In Physical Terms, 2012-2023
- Market Structure – Domestic Supply vs. Imports, In Value Terms, 2012-2023
- Trade Balance, In Physical Terms, 2012-2023
- Trade Balance, In Value Terms, 2012-2023
- Per Capita Consumption, 2012-2023
- Market Volume Forecast to 2030
- Market Value Forecast to 2030
- Products: Market Size And Growth, By Type
- Products: Average Per Capita Consumption, By Type
- Products: Exports And Growth, By Type
- Products: Export Prices And Growth, By Type
- Production Volume And Growth
- Exports And Growth
- Export Prices And Growth
- Market Size And Growth
- Per Capita Consumption
- Imports And Growth
- Import Prices
- Production, In Physical Terms, 2012–2023
- Production, In Value Terms, 2012–2023
- Imports, In Physical Terms, 2012–2023
- Imports, In Value Terms, 2012–2023
- Imports, In Physical Terms, By Country, 2023
- Imports, In Physical Terms, By Country, 2012–2023
- Imports, In Value Terms, By Country, 2012–2023
- Import Prices, By Country Of Origin, 2012–2023
- Exports, In Physical Terms, 2012–2023
- Exports, In Value Terms, 2012–2023
- Exports, In Physical Terms, By Country, 2023
- Exports, In Physical Terms, By Country, 2012–2023
- Exports, In Value Terms, By Country, 2012–2023
- Export Prices, By Country Of Destination, 2012–2023


