South Africa - Woven Fabrics Of Cotton - Market Analysis, Forecast, Size, Trends and Insights
Get instant access to more than 2 million reports, dashboards, and datasets on the IndexBox Platform.
View PricingSouth Africa's Cotton Fabric Imports Drop to $88 Million in 2023
South Africa Cotton Fabric Imports
In 2023, overseas purchases of woven fabrics of cotton decreased by -5.9% to 82M square meters for the first time since 2020, thus ending a two-year rising trend. Over the period under review, imports saw a mild downturn. The growth pace was the most rapid in 2018 with an increase of 86% against the previous year. As a result, imports reached the peak of 186M square meters. From 2019 to 2023, the growth of imports remained at a lower figure.
In value terms, cotton fabric imports contracted significantly to $88M (IndexBox estimates) in 2023. In general, imports recorded a mild decrease. The most prominent rate of growth was recorded in 2021 when imports increased by 39%. Imports peaked at $113M in 2017; however, from 2018 to 2023, imports stood at a somewhat lower figure.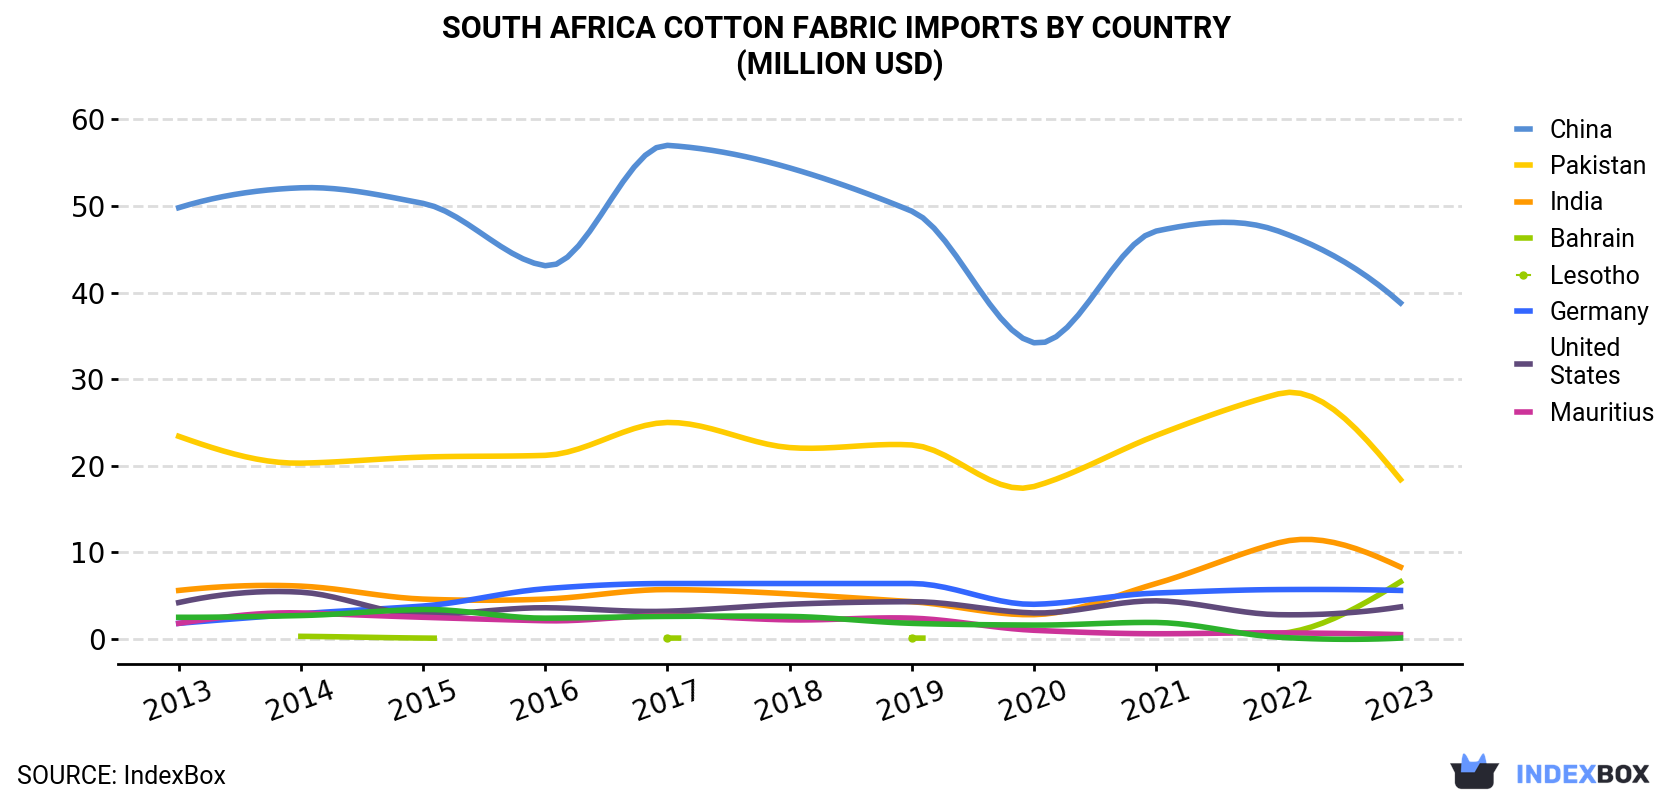
| COUNTRY | Import Value of Cotton Fabric in South Africa (million USD) | ||||||||||
|---|---|---|---|---|---|---|---|---|---|---|---|
| 2013 | 2014 | 2015 | 2016 | 2017 | 2018 | 2019 | 2020 | 2021 | 2022 | 2023 | |
| China | 49.8 | 52.1 | 50.3 | 43.1 | 57.0 | 54.4 | 49.4 | 34.2 | 47.1 | 47.1 | 38.8 |
| Pakistan | 23.4 | 20.3 | 21.0 | 21.2 | 25.0 | 22.1 | 22.4 | 17.6 | 23.5 | 28.3 | 18.4 |
| India | 5.6 | 6.1 | 4.6 | 4.6 | 5.7 | 5.2 | 4.3 | 2.8 | 6.4 | 11.1 | 8.3 |
| Bahrain | N/A | 0.3 | 0.1 | N/A | 0.1 | N/A | 0.1 | N/A | N/A | 0.6 | 6.6 |
| Lesotho | 1.8 | 2.9 | 3.8 | 5.8 | 6.4 | 6.4 | 6.4 | 4.0 | 5.3 | 5.7 | 5.6 |
| Germany | 4.2 | 5.4 | 2.8 | 3.6 | 3.2 | 4.0 | 4.3 | 3.0 | 4.4 | 2.8 | 3.7 |
| United States | 1.8 | 3.0 | 2.5 | 2.1 | 2.7 | 2.2 | 2.4 | 1.0 | 0.6 | 0.7 | 0.5 |
| Mauritius | 2.5 | 2.7 | 3.4 | 2.4 | 2.6 | 2.6 | 1.8 | 1.6 | 1.9 | 0.2 | 0.1 |
| Others | 15.8 | 14.1 | 14.1 | 9.3 | 9.8 | 10.0 | 7.9 | 6.1 | 8.6 | 8.4 | 6.1 |
| Total | 105 | 107 | 103 | 92.0 | 113 | 107 | 99.0 | 70.3 | 97.8 | 105 | 88.1 |
Imports by Country
China (30M square meters), Pakistan (28M square meters) and India (7.5M square meters) were the main suppliers of cotton fabric imports to South Africa, together accounting for 81% of total imports. Bahrain, Lesotho, Germany, the United States and Mauritius lagged somewhat behind, together accounting for a further 13%.
From 2013 to 2023, the most notable rate of growth in terms of purchases, amongst the main suppliers, was attained by Bahrain (with a CAGR of +96.7%), while imports for the other leaders experienced more modest paces of growth.
In value terms, China ($39M) constituted the largest supplier of woven fabrics of cotton to South Africa, comprising 44% of total imports. The second position in the ranking was held by Pakistan ($18M), with a 21% share of total imports. It was followed by India, with a 9.5% share.
From 2013 to 2023, the average annual rate of growth in terms of value from China amounted to -2.5%. The remaining supplying countries recorded the following average annual rates of imports growth: Pakistan (-2.4% per year) and India (+4.0% per year).
Imports by Type
In 2023, woven fabrics of cotton, containing 85% or more by weight of cotton, weighing not more than 200 g/m2 (53M square meters) constituted the largest type of woven fabrics of cotton supplied to South Africa, with a 67% share of total imports. Moreover, woven fabrics of cotton, containing 85% or more by weight of cotton, weighing not more than 200 g/m2 exceeded the figures recorded for the second-largest type, woven fabrics of cotton, containing 85% or more by weight of cotton, weighing more than 200g/m2 (12M square meters), fivefold. Woven fabrics of cotton, containing less than 85% by weight of cotton, mixed mainly or solely with man-made fibres, weighing not more than 200 g/m2 (9.4M square meters) ranked third in terms of total imports with a 12% share.
From 2013 to 2023, the average annual rate of growth in terms of the volume of woven fabrics of cotton, containing 85% or more by weight of cotton, weighing not more than 200 g/m2 imports amounted to -2.1%. With regard to the other supplied products, the following average annual rates of growth were recorded: woven fabrics of cotton, containing 85% or more by weight of cotton, weighing more than 200g/m2 (-5.3% per year) and woven fabrics of cotton, containing less than 85% by weight of cotton, mixed mainly or solely with man-made fibres, weighing not more than 200 g/m2 (+1.0% per year).
In value terms, woven fabrics of cotton with the largest imports in South Africa were woven fabrics of cotton, containing 85% or more by weight of cotton, weighing not more than 200 g/m2 ($46M), woven fabrics of cotton, containing 85% or more by weight of cotton, weighing more than 200g/m2 ($24M) and woven fabrics of cotton, containing less than 85% by weight of cotton, mixed mainly or solely with man-made fibres, weighing not more than 200 g/m2 ($10M), with a combined 92% share of total imports. Woven fabrics of cotton, containing less than 85% by weight of cotton, mixed mainly or solely with man-made fibres, weighing more than 200g/m2 and other woven fabrics of cotton, n.e.s. in chapter 52 lagged somewhat behind, together comprising a further 8.4%.
Import Prices by Country
In 2023, the cotton fabric price stood at $1.1 per square meter (CIF, South Africa), declining by -10.7% against the previous year. Overall, the import price, however, saw a relatively flat trend pattern. The growth pace was the most rapid in 2019 an increase of 75%. Over the period under review, average import prices reached the maximum at $1.2 per square meter in 2022, and then shrank in the following year.
Prices varied noticeably by country of origin: amid the top importers, the country with the highest price was Lesotho ($1.8 per square meter), while the price for Pakistan ($0.7 per square meter) was amongst the lowest.
From 2013 to 2023, the most notable rate of growth in terms of prices was attained by Lesotho (+7.8%), while the prices for the other major suppliers experienced more modest paces of growth.
This report provides an in-depth analysis of the cotton fabric market in South Africa. Within it, you will discover the latest data on market trends and opportunities by country, consumption, production and price developments, as well as the global trade (imports and exports). The forecast exhibits the market prospects through 2030.
Product coverage:
- Prodcom 13202020 - Woven fabrics of cotton weighing . .100 g/m., for medical gauzes, bandages and dressings
- Prodcom 13202060 - Woven fabrics of denim cotton weighing > .200 g/m. (including denim other than blue)
- Prodcom 132020Z1 - Cotton fabrics, . .200 g/m. (excluding gauze and coloured yarns)
- Prodcom 132020Z2 - Cotton fabrics, > .200 g/m. (excluding coloured yarns)
- Prodcom 132020Z3 - Woven fabrics of cotton of yarns of different colours (excluding denim)
Country coverage:
- South Africa
Data coverage:
- Market volume and value
- Per Capita consumption
- Forecast of the market dynamics in the medium term
- Trade (exports and imports) in South Africa
- Export and import prices
- Market trends, drivers and restraints
- Key market players and their profiles
Reasons to buy this report:
- Take advantage of the latest data
- Find deeper insights into current market developments
- Discover vital success factors affecting the market
This report is designed for manufacturers, distributors, importers, and wholesalers, as well as for investors, consultants and advisors.
In this report, you can find information that helps you to make informed decisions on the following issues:
- How to diversify your business and benefit from new market opportunities
- How to load your idle production capacity
- How to boost your sales on overseas markets
- How to increase your profit margins
- How to make your supply chain more sustainable
- How to reduce your production and supply chain costs
- How to outsource production to other countries
- How to prepare your business for global expansion
While doing this research, we combine the accumulated expertise of our analysts and the capabilities of artificial intelligence. The AI-based platform, developed by our data scientists, constitutes the key working tool for business analysts, empowering them to discover deep insights and ideas from the marketing data.
-
1. INTRODUCTION
Making Data-Driven Decisions to Grow Your Business
- REPORT DESCRIPTION
- RESEARCH METHODOLOGY AND AI PLATFORM
- DATA-DRIVEN DECISIONS FOR YOUR BUSINESS
- GLOSSARY AND SPECIFIC TERMS
-
2. EXECUTIVE SUMMARY
A Quick Overview of Market Performance
- KEY FINDINGS
- MARKET TRENDS This Chapter is Available Only for the Professional Edition PRO
-
3. MARKET OVERVIEW
Understanding the Current State of The Market and Its Prospects
- MARKET SIZE
- MARKET STRUCTURE
- TRADE BALANCE
- PER CAPITA CONSUMPTION
- MARKET FORECAST TO 2030
-
4. MOST PROMISING PRODUCT
Finding New Products to Diversify Your Business
This Chapter is Available Only for the Professional Edition PRO- TOP PRODUCTS TO DIVERSIFY YOUR BUSINESS
- BEST-SELLING PRODUCTS
- MOST CONSUMED PRODUCT
- MOST TRADED PRODUCT
- MOST PROFITABLE PRODUCT FOR EXPORT
-
5. MOST PROMISING SUPPLYING COUNTRIES
Choosing the Best Countries to Establish Your Sustainable Supply Chain
This Chapter is Available Only for the Professional Edition PRO- TOP COUNTRIES TO SOURCE YOUR PRODUCT
- TOP PRODUCING COUNTRIES
- TOP EXPORTING COUNTRIES
- LOW-COST EXPORTING COUNTRIES
-
6. MOST PROMISING OVERSEAS MARKETS
Choosing the Best Countries to Boost Your Exports
This Chapter is Available Only for the Professional Edition PRO- TOP OVERSEAS MARKETS FOR EXPORTING YOUR PRODUCT
- TOP CONSUMING MARKETS
- UNSATURATED MARKETS
- TOP IMPORTING MARKETS
- MOST PROFITABLE MARKETS
7. PRODUCTION
The Latest Trends and Insights into The Industry
- PRODUCTION VOLUME AND VALUE
8. IMPORTS
The Largest Import Supplying Countries
- IMPORTS FROM 2012–2023
- IMPORTS BY COUNTRY
- IMPORT PRICES BY COUNTRY
9. EXPORTS
The Largest Destinations for Exports
- EXPORTS FROM 2012–2023
- EXPORTS BY COUNTRY
- EXPORT PRICES BY COUNTRY
-
10. PROFILES OF MAJOR PRODUCERS
The Largest Producers on The Market and Their Profiles
This Chapter is Available Only for the Professional Edition PRO -
LIST OF TABLES
- Key Findings In 2023
- Market Volume, In Physical Terms, 2012–2023
- Market Value, 2012–2023
- Per Capita Consumption In 2012-2023
- Imports, In Physical Terms, By Country, 2012–2023
- Imports, In Value Terms, By Country, 2012–2023
- Import Prices, By Country Of Origin, 2012–2023
- Exports, In Physical Terms, By Country, 2012–2023
- Exports, In Value Terms, By Country, 2012–2023
- Export Prices, By Country Of Destination, 2012–2023
-
LIST OF FIGURES
- Market Volume, In Physical Terms, 2012–2023
- Market Value, 2012–2023
- Market Structure – Domestic Supply vs. Imports, In Physical Terms, 2012-2023
- Market Structure – Domestic Supply vs. Imports, In Value Terms, 2012-2023
- Trade Balance, In Physical Terms, 2012-2023
- Trade Balance, In Value Terms, 2012-2023
- Per Capita Consumption, 2012-2023
- Market Volume Forecast to 2030
- Market Value Forecast to 2030
- Products: Market Size And Growth, By Type
- Products: Average Per Capita Consumption, By Type
- Products: Exports And Growth, By Type
- Products: Export Prices And Growth, By Type
- Production Volume And Growth
- Exports And Growth
- Export Prices And Growth
- Market Size And Growth
- Per Capita Consumption
- Imports And Growth
- Import Prices
- Production, In Physical Terms, 2012–2023
- Production, In Value Terms, 2012–2023
- Imports, In Physical Terms, 2012–2023
- Imports, In Value Terms, 2012–2023
- Imports, In Physical Terms, By Country, 2023
- Imports, In Physical Terms, By Country, 2012–2023
- Imports, In Value Terms, By Country, 2012–2023
- Import Prices, By Country Of Origin, 2012–2023
- Exports, In Physical Terms, 2012–2023
- Exports, In Value Terms, 2012–2023
- Exports, In Physical Terms, By Country, 2023
- Exports, In Physical Terms, By Country, 2012–2023
- Exports, In Value Terms, By Country, 2012–2023
- Export Prices, By Country Of Destination, 2012–2023


