South Africa's Nucleic Acids Imports Plummet to $58M in 2023
South Africa Nucleic Acids Imports
In 2023, overseas purchases of nucleic acids and their salts decreased by -8.8% to 2.3K tons, falling for the second year in a row after two years of growth. Over the period under review, imports continue to indicate a pronounced shrinkage. The pace of growth appeared the most rapid in 2021 when imports increased by 24% against the previous year. As a result, imports attained the peak of 3.6K tons. From 2022 to 2023, the growth of imports remained at a somewhat lower figure.
In value terms, nucleic acids imports shrank notably to $58M (IndexBox estimates) in 2023. In general, imports saw a abrupt downturn. The most prominent rate of growth was recorded in 2020 when imports increased by 36%. Imports peaked at $128M in 2021; however, from 2022 to 2023, imports stood at a somewhat lower figure.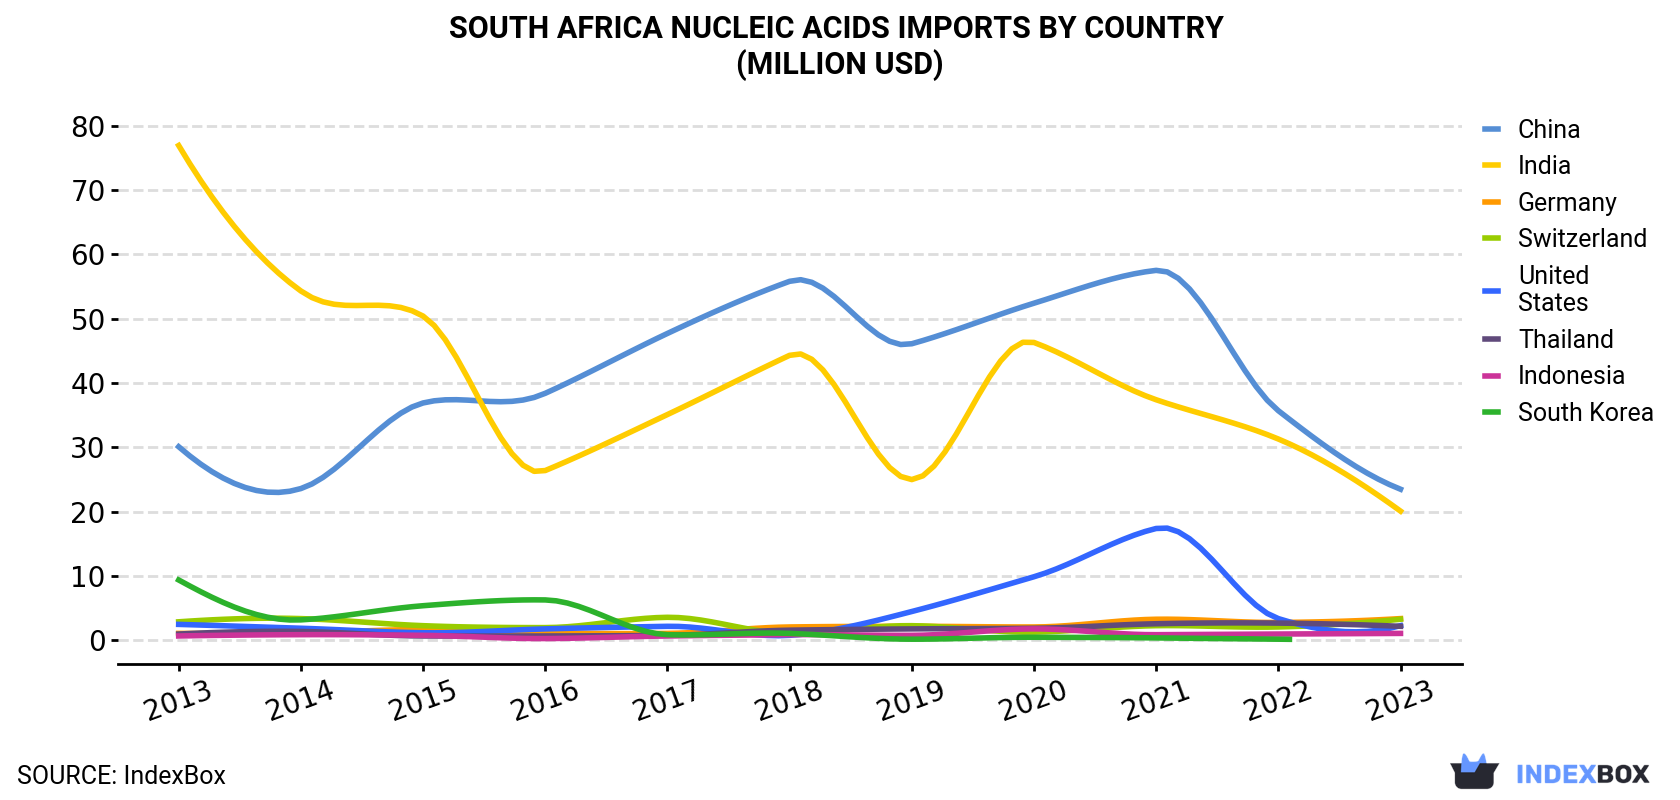
| COUNTRY | Import Value of Nucleic Acids in South Africa (million USD) | ||||||||||
|---|---|---|---|---|---|---|---|---|---|---|---|
| 2013 | 2014 | 2015 | 2016 | 2017 | 2018 | 2019 | 2020 | 2021 | 2022 | 2023 | |
| China | 30.1 | 23.6 | 36.9 | 38.4 | 47.7 | 55.8 | 46.1 | 52.4 | 57.5 | 35.7 | 23.5 |
| India | 76.9 | 54.3 | 50.4 | 26.4 | 35.1 | 44.3 | 25.0 | 46.3 | 37.4 | 31.3 | 20.1 |
| Germany | 1.1 | 1.2 | 1.7 | 1.2 | 1.1 | 2.1 | 2.2 | 2.1 | 3.3 | 2.8 | 3.4 |
| Switzerland | 2.9 | 3.4 | 2.3 | 2.0 | 3.6 | 1.1 | 2.3 | 1.3 | 2.3 | 2.1 | 3.3 |
| United States | 2.5 | 1.9 | 1.2 | 1.8 | 2.2 | 0.8 | 4.5 | 9.9 | 17.4 | 3.4 | 2.3 |
| Thailand | 1.0 | 1.4 | 0.7 | 0.7 | 0.8 | 1.6 | 1.8 | 1.9 | 2.6 | 2.7 | 2.2 |
| Indonesia | 0.7 | 0.9 | 0.8 | 0.3 | 0.7 | 0.9 | 0.8 | 1.8 | 0.9 | 1.0 | 1.1 |
| South Korea | 9.4 | 3.2 | 5.4 | 6.3 | 0.9 | 1.1 | 0.2 | 0.5 | 0.4 | 0.2 | N/A |
| Others | 3.0 | 2.9 | 2.2 | 2.2 | 2.7 | 4.0 | 7.5 | 6.8 | 6.1 | 3.6 | 2.5 |
| Total | 128 | 92.8 | 102 | 79.5 | 94.9 | 112 | 90.5 | 123 | 128 | 82.7 | 58.4 |
Imports by Country
In 2023, China (1.5K tons) constituted the largest supplier of nucleic acids to South Africa, with a 64% share of total imports. Moreover, nucleic acids imports from China exceeded the figures recorded by the second-largest supplier, India (218 tons), sevenfold. The third position in this ranking was taken by Thailand (208 tons), with a 9.1% share.
From 2013 to 2023, the average annual rate of growth in terms of volume from China totaled -2.4%. The remaining supplying countries recorded the following average annual rates of imports growth: India (-8.2% per year) and Thailand (+6.4% per year).
In value terms, China ($23M), India ($20M) and Germany ($3.4M) constituted the largest nucleic acids suppliers to South Africa, with a combined 81% share of total imports.
Germany, with a CAGR of +11.5%, recorded the highest rates of growth with regard to the value of imports, among the main suppliers over the period under review, while purchases for the other leaders experienced more modest paces of growth.
Imports by Type
In 2023, nucleic acids and their salts, other heterocyclic compounds, n.e.c. in heading number 2934 (1.9K tons) constituted the largest type of nucleic acids and their salts supplied to South Africa, accounting for a 83% share of total imports. Moreover, nucleic acids and their salts, other heterocyclic compounds, n.e.c. in heading number 2934 exceeded the figures recorded for the second-largest type, heterocyclic compounds; containing an unfused thiazole ring (whether or not hydrogenated) in the structure (203 tons), ninefold. Heterocyclic compounds; containing a benzothiazole ring-system (whether or not hydrogenated), not further fused (191 tons) ranked third in terms of total imports with an 8.3% share.
From 2013 to 2023, the average annual rate of growth in terms of the volume of nucleic acids and their salts, other heterocyclic compounds, n.e.c. in heading number 2934 imports totaled -2.7%. With regard to the other supplied products, the following average annual rates of growth were recorded: heterocyclic compounds; containing an unfused thiazole ring (whether or not hydrogenated) in the structure (+1.1% per year) and heterocyclic compounds; containing a benzothiazole ring-system (whether or not hydrogenated), not further fused (-6.5% per year).
In value terms, nucleic acids and their salts, other heterocyclic compounds, n.e.c. in heading number 2934 ($47M) constituted the largest type of nucleic acids and their salts supplied to South Africa, comprising 81% of total imports. The second position in the ranking was taken by heterocyclic compounds; containing an unfused thiazole ring (whether or not hydrogenated) in the structure ($10M), with an 18% share of total imports. It was followed by heterocyclic compounds; containing a benzothiazole ring-system (whether or not hydrogenated), not further fused, with a 1.3% share.
Import Prices by Country
In 2023, the nucleic acids price amounted to $25,559 per ton (CIF, South Africa), waning by -22.6% against the previous year. Overall, the import price continues to indicate a perceptible contraction. The pace of growth appeared the most rapid in 2020 when the average import price increased by 16%. As a result, import price attained the peak level of $42,884 per ton. From 2021 to 2023, the average import prices failed to regain momentum.
Prices varied noticeably by country of origin: amid the top importers, the country with the highest price was India ($92,573 per ton), while the price for Spain ($5,372 per ton) was amongst the lowest.
From 2013 to 2023, the most notable rate of growth in terms of prices was attained by Germany (+14.1%), while the prices for the other major suppliers experienced more modest paces of growth.
-
1. INTRODUCTION
Making Data-Driven Decisions to Grow Your Business
- REPORT DESCRIPTION
- RESEARCH METHODOLOGY AND AI PLATFORM
- DATA-DRIVEN DECISIONS FOR YOUR BUSINESS
- GLOSSARY AND SPECIFIC TERMS
-
2. EXECUTIVE SUMMARY
A Quick Overview of Market Performance
- KEY FINDINGS
- MARKET TRENDS This Chapter is Available Only for the Professional Edition PRO
-
3. MARKET OVERVIEW
Understanding the Current State of The Market and Its Prospects
- MARKET SIZE
- MARKET STRUCTURE
- TRADE BALANCE
- PER CAPITA CONSUMPTION
- MARKET FORECAST TO 2030
-
4. MOST PROMISING PRODUCT
Finding New Products to Diversify Your Business
This Chapter is Available Only for the Professional Edition PRO- TOP PRODUCTS TO DIVERSIFY YOUR BUSINESS
- BEST-SELLING PRODUCTS
- MOST CONSUMED PRODUCT
- MOST TRADED PRODUCT
- MOST PROFITABLE PRODUCT FOR EXPORT
-
5. MOST PROMISING SUPPLYING COUNTRIES
Choosing the Best Countries to Establish Your Sustainable Supply Chain
This Chapter is Available Only for the Professional Edition PRO- TOP COUNTRIES TO SOURCE YOUR PRODUCT
- TOP PRODUCING COUNTRIES
- TOP EXPORTING COUNTRIES
- LOW-COST EXPORTING COUNTRIES
-
6. MOST PROMISING OVERSEAS MARKETS
Choosing the Best Countries to Boost Your Exports
This Chapter is Available Only for the Professional Edition PRO- TOP OVERSEAS MARKETS FOR EXPORTING YOUR PRODUCT
- TOP CONSUMING MARKETS
- UNSATURATED MARKETS
- TOP IMPORTING MARKETS
- MOST PROFITABLE MARKETS
7. PRODUCTION
The Latest Trends and Insights into The Industry
- PRODUCTION VOLUME AND VALUE
8. IMPORTS
The Largest Import Supplying Countries
- IMPORTS FROM 2012–2023
- IMPORTS BY COUNTRY
- IMPORT PRICES BY COUNTRY
9. EXPORTS
The Largest Destinations for Exports
- EXPORTS FROM 2012–2023
- EXPORTS BY COUNTRY
- EXPORT PRICES BY COUNTRY
-
10. PROFILES OF MAJOR PRODUCERS
The Largest Producers on The Market and Their Profiles
This Chapter is Available Only for the Professional Edition PRO -
LIST OF TABLES
- Key Findings In 2023
- Market Volume, In Physical Terms, 2012–2023
- Market Value, 2012–2023
- Per Capita Consumption In 2012-2023
- Imports, In Physical Terms, By Country, 2012–2023
- Imports, In Value Terms, By Country, 2012–2023
- Import Prices, By Country Of Origin, 2012–2023
- Exports, In Physical Terms, By Country, 2012–2023
- Exports, In Value Terms, By Country, 2012–2023
- Export Prices, By Country Of Destination, 2012–2023
-
LIST OF FIGURES
- Market Volume, In Physical Terms, 2012–2023
- Market Value, 2012–2023
- Market Structure – Domestic Supply vs. Imports, In Physical Terms, 2012-2023
- Market Structure – Domestic Supply vs. Imports, In Value Terms, 2012-2023
- Trade Balance, In Physical Terms, 2012-2023
- Trade Balance, In Value Terms, 2012-2023
- Per Capita Consumption, 2012-2023
- Market Volume Forecast to 2030
- Market Value Forecast to 2030
- Products: Market Size And Growth, By Type
- Products: Average Per Capita Consumption, By Type
- Products: Exports And Growth, By Type
- Products: Export Prices And Growth, By Type
- Production Volume And Growth
- Exports And Growth
- Export Prices And Growth
- Market Size And Growth
- Per Capita Consumption
- Imports And Growth
- Import Prices
- Production, In Physical Terms, 2012–2023
- Production, In Value Terms, 2012–2023
- Imports, In Physical Terms, 2012–2023
- Imports, In Value Terms, 2012–2023
- Imports, In Physical Terms, By Country, 2023
- Imports, In Physical Terms, By Country, 2012–2023
- Imports, In Value Terms, By Country, 2012–2023
- Import Prices, By Country Of Origin, 2012–2023
- Exports, In Physical Terms, 2012–2023
- Exports, In Value Terms, 2012–2023
- Exports, In Physical Terms, By Country, 2023
- Exports, In Physical Terms, By Country, 2012–2023
- Exports, In Value Terms, By Country, 2012–2023
- Export Prices, By Country Of Destination, 2012–2023


