
World - Styrene - Market Analysis, Forecast, Size, Trends And Insights
Get instant access to more than 2 million reports, dashboards, and datasets on the IndexBox Platform.
View PricingGlobal Styrene Market to Witness Steady Growth with +2.4% CAGR Through 2030
IndexBox has just published a new report: World - Styrene - Market Analysis, Forecast, Size, Trends And Insights.
Driven by a growing demand for styrene on a global scale, the market is set to experience a steady rise in consumption. Forecasts predict a significant increase in market volume and value, with a projected CAGR of +2.4% and +4.4% respectively from 2023 to 2030.
Market Forecast
Driven by increasing demand for styrene worldwide, the market is expected to continue an upward consumption trend over the next seven years. Market performance is forecast to accelerate, expanding with an anticipated CAGR of +2.4% for the period from 2023 to 2030, which is projected to bring the market volume to 32M tons by the end of 2030.
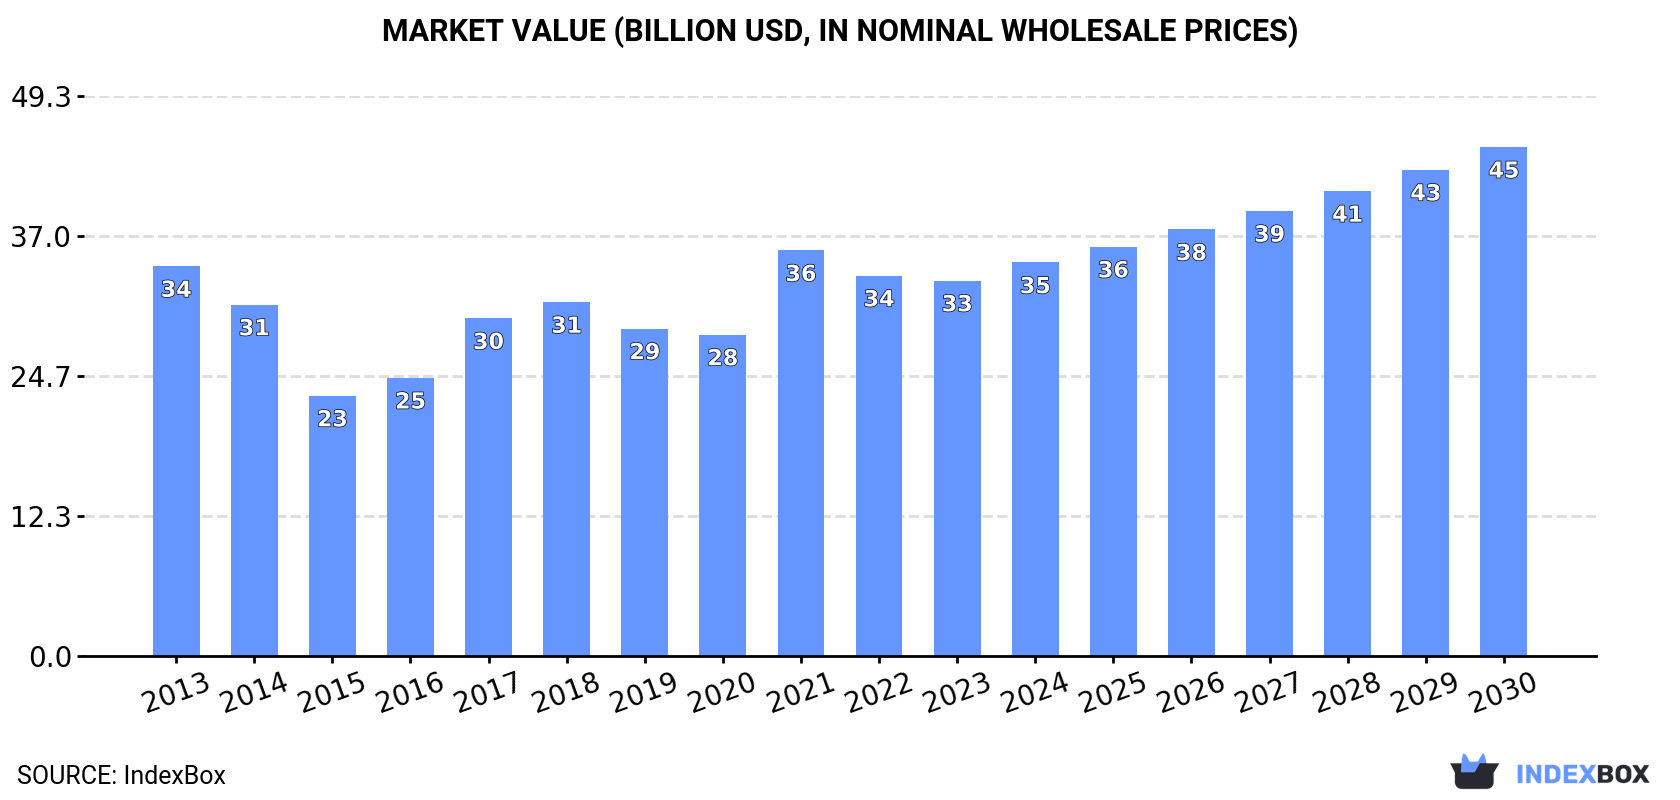
In value terms, the market is forecast to increase with an anticipated CAGR of +4.4% for the period from 2023 to 2030, which is projected to bring the market value to $44.8B (in nominal wholesale prices) by the end of 2030.
Consumption
World Consumption of Styrene
In 2023, consumption of styrene decreased by -0.3% to 27M tons, falling for the second consecutive year after six years of growth. The total consumption volume increased at an average annual rate of +1.6% from 2013 to 2023; however, the trend pattern indicated some noticeable fluctuations being recorded in certain years. Global consumption peaked at 28M tons in 2021; however, from 2022 to 2023, consumption remained at a lower figure.
The global styrene market size fell slightly to $33.1B in 2023, standing approx. at the previous year. This figure reflects the total revenues of producers and importers (excluding logistics costs, retail marketing costs, and retailers' margins, which will be included in the final consumer price). In general, consumption showed a relatively flat trend pattern. As a result, consumption attained the peak level of $35.7B. From 2022 to 2023, the growth of the global market remained at a somewhat lower figure.
Consumption By Country
The countries with the highest volumes of consumption in 2023 were China (4.3M tons), the United States (3.9M tons) and India (2.5M tons), with a combined 40% share of global consumption. The Netherlands, Indonesia, Brazil, Russia, Japan, Italy, Turkey, Canada, South Korea and Germany lagged somewhat behind, together accounting for a further 32%.
From 2013 to 2023, the biggest increases were recorded for Russia (with a CAGR of +5.8%), while consumption for the other global leaders experienced more modest paces of growth.
In value terms, the largest styrene markets worldwide were China ($5.3B), the United States ($4.3B) and India ($3.3B), together comprising 39% of the global market. The Netherlands, Brazil, Indonesia, Italy, Russia, Japan, Turkey, Germany, South Korea and Canada lagged somewhat behind, together comprising a further 34%.
Among the main consuming countries, Russia, with a CAGR of +3.0%, recorded the highest rates of growth with regard to market size over the period under review, while market for the other global leaders experienced more modest paces of growth.
In 2023, the highest levels of styrene per capita consumption was registered in the Netherlands (93 kg per person), followed by Canada (17 kg per person), Italy (12 kg per person) and South Korea (12 kg per person), while the world average per capita consumption of styrene was estimated at 3.4 kg per person.
In the Netherlands, styrene per capita consumption remained relatively stable over the period from 2013-2023. In the other countries, the average annual rates were as follows: Canada (+1.1% per year) and Italy (+1.6% per year).
Production
World Production of Styrene
In 2023, the amount of styrene produced worldwide amounted to 27M tons, leveling off at the previous year's figure. The total output volume increased at an average annual rate of +1.6% from 2013 to 2023; however, the trend pattern indicated some noticeable fluctuations being recorded throughout the analyzed period. The most prominent rate of growth was recorded in 2017 when the production volume increased by 13% against the previous year. Over the period under review, global production reached the peak volume at 28M tons in 2021; however, from 2022 to 2023, production stood at a somewhat lower figure.
In value terms, styrene production expanded significantly to $33.4B in 2023 estimated in export price. Over the period under review, production, however, showed a relatively flat trend pattern. The pace of growth appeared the most rapid in 2021 with an increase of 36% against the previous year. Over the period under review, global production hit record highs at $35.5B in 2013; however, from 2014 to 2023, production stood at a somewhat lower figure.
Production By Country
The countries with the highest volumes of production in 2023 were the United States (5.2M tons), China (3.9M tons) and the Netherlands (2.2M tons), together accounting for 41% of global production.
From 2013 to 2023, the most notable rate of growth in terms of production, amongst the leading producing countries, was attained by China (with a CAGR of +20.7%), while production for the other global leaders experienced more modest paces of growth.
Imports
World Imports of Styrene
In 2023, supplies from abroad of styrene decreased by -3.6% to 8.1M tons, falling for the third year in a row after two years of growth. Overall, imports recorded a pronounced downturn. The pace of growth appeared the most rapid in 2019 when imports increased by 7.3% against the previous year. Global imports peaked at 11M tons in 2013; however, from 2014 to 2023, imports stood at a somewhat lower figure.
In value terms, styrene imports dropped remarkably to $9.5B in 2023. Over the period under review, imports continue to indicate a deep contraction. The most prominent rate of growth was recorded in 2021 when imports increased by 55% against the previous year. Global imports peaked at $18.3B in 2013; however, from 2014 to 2023, imports stood at a somewhat lower figure.
Imports By Country
The purchases of the ten major importers of styrene, namely India, China, Belgium, the Netherlands, Turkey, Germany, South Korea, the United States, Mexico and Taiwan (Chinese), represented more than two-thirds of total import. The following importers - Brazil (216K tons), France (196K tons) and Malaysia (155K tons) - together made up 7% of total imports.
From 2013 to 2023, the biggest increases were recorded for Belgium (with a CAGR of +10.6%), while purchases for the other global leaders experienced more modest paces of growth.
In value terms, India ($1.1B), Belgium ($915M) and China ($825M) constituted the countries with the highest levels of imports in 2023, together comprising 30% of global imports.
Among the main importing countries, Belgium, with a CAGR of +7.0%, saw the highest rates of growth with regard to the value of imports, over the period under review, while purchases for the other global leaders experienced more modest paces of growth.
Import Prices By Country
In 2023, the average styrene import price amounted to $1,164 per ton, shrinking by -16.1% against the previous year. In general, the import price recorded a perceptible decline. The most prominent rate of growth was recorded in 2021 when the average import price increased by 65% against the previous year. Global import price peaked at $1,702 per ton in 2013; however, from 2014 to 2023, import prices failed to regain momentum.
Average prices varied noticeably amongst the major importing countries. In 2023, major importing countries recorded the following prices: in Germany ($1,284 per ton) and France ($1,231 per ton), while India ($1,031 per ton) and China ($1,044 per ton) were amongst the lowest.
From 2013 to 2023, the most notable rate of growth in terms of prices was attained by the United States (-2.8%), while the other global leaders experienced a decline in the import price figures.
Exports
World Exports of Styrene
In 2023, shipments abroad of styrene was finally on the rise to reach 8.8M tons for the first time since 2019, thus ending a three-year declining trend. Overall, exports, however, saw a pronounced curtailment. The pace of growth appeared the most rapid in 2019 with an increase of 6.4% against the previous year. Over the period under review, the global exports hit record highs at 11M tons in 2013; however, from 2014 to 2023, the exports failed to regain momentum.
In value terms, styrene exports reduced dramatically to $10.1B in 2023. Over the period under review, exports, however, showed a abrupt decline. The most prominent rate of growth was recorded in 2021 when exports increased by 59% against the previous year. The global exports peaked at $18.2B in 2013; however, from 2014 to 2023, the exports failed to regain momentum.
Exports By Country
The biggest shipments were from the United States (1.7M tons), Saudi Arabia (1.4M tons) and the Netherlands (1.3M tons), together finishing at 50% of total export. It was distantly followed by South Korea (624K tons), Singapore (515K tons), Kuwait (421K tons), Belgium (406K tons) and Canada (402K tons), together generating a 27% share of total exports. Taiwan (Chinese) (370K tons), China (366K tons), Spain (336K tons), Japan (332K tons) and France (241K tons) held a minor share of total exports.
From 2013 to 2023, the most notable rate of growth in terms of shipments, amongst the key exporting countries, was attained by China (with a CAGR of +21.4%), while the other global leaders experienced more modest paces of growth.
In value terms, the United States ($1.8B), Saudi Arabia ($1.7B) and the Netherlands ($1.5B) were the countries with the highest levels of exports in 2023, with a combined 50% share of global exports. South Korea, Belgium, Kuwait, Canada, Taiwan (Chinese), Spain, Singapore, China, Japan and France lagged somewhat behind, together accounting for a further 45%.
Belgium, with a CAGR of +16.1%, saw the highest growth rate of the value of exports, in terms of the main exporting countries over the period under review, while shipments for the other global leaders experienced more modest paces of growth.
Export Prices By Country
In 2023, the average styrene export price amounted to $1,143 per ton, waning by -15.5% against the previous year. Over the period under review, the export price recorded a pronounced reduction. The growth pace was the most rapid in 2021 an increase of 66%. Over the period under review, the average export prices reached the peak figure at $1,628 per ton in 2013; however, from 2014 to 2023, the export prices failed to regain momentum.
Prices varied noticeably by country of origin: amid the top suppliers, the country with the highest price was Belgium ($1,349 per ton), while Singapore ($722 per ton) was amongst the lowest.
From 2013 to 2023, the most notable rate of growth in terms of prices was attained by Belgium (-1.9%), while the other global leaders experienced a decline in the export price figures.
This report provides an in-depth analysis of the global styrene market. Within it, you will discover the latest data on market trends and opportunities by country, consumption, production and price developments, as well as the global trade (imports and exports). The forecast exhibits the market prospects through 2030.
Product coverage:
- Prodcom 20141250 - Styrene
Country coverage:
Worldwide - the report contains statistical data for 200 countries and includes detailed profiles of the 50 largest consuming countries:
- USA
- China
- Japan
- Germany
- United Kingdom
- France
- Brazil
- Italy
- Russian Federation
- India
- Canada
- Australia
- Republic of Korea
- Spain
- Mexico
- Indonesia
- Netherlands
- Turkey
- Saudi Arabia
- Switzerland
- Sweden
- Nigeria
- Poland
- Belgium
- Argentina
- Norway
- Austria
- Thailand
- United Arab Emirates
- Colombia
- Denmark
- South Africa
- Malaysia
- Israel
- Singapore
- Egypt
- Philippines
- Finland
- Chile
- Ireland
- Pakistan
- Greece
- Portugal
- Kazakhstan
- Algeria
- Czech Republic
- Qatar
- Peru
- Romania
- Vietnam
+ the largest producing countries
Data coverage:
- Global market volume and value
- Per Capita consumption
- Forecast of the market dynamics in the medium term
- Global production, split by region and country
- Global trade (exports and imports)
- Export and import prices
- Market trends, drivers and restraints
- Key market players and their profiles
Company coverage:
Reasons to buy this report:
- Take advantage of the latest data
- Find deeper insights into current market developments
- Discover vital success factors affecting the market
This report is designed for manufacturers, distributors, importers, and wholesalers, as well as for investors, consultants and advisors.
In this report, you can find information that helps you to make informed decisions on the following issues:
- How to diversify your business and benefit from new market opportunities
- How to load your idle production capacity
- How to boost your sales on overseas markets
- How to increase your profit margins
- How to make your supply chain more sustainable
- How to reduce your production and supply chain costs
- How to outsource production to other countries
- How to prepare your business for global expansion
While doing this research, we combine the accumulated expertise of our analysts and the capabilities of artificial intelligence. The AI-based platform, developed by our data scientists, constitutes the key working tool for business analysts, empowering them to discover deep insights and ideas from the marketing data.
-
1. INTRODUCTION
Making Data-Driven Decisions to Grow Your Business
- REPORT DESCRIPTION
- RESEARCH METHODOLOGY AND AI PLATFORM
- DATA-DRIVEN DECISIONS FOR YOUR BUSINESS
- GLOSSARY AND SPECIFIC TERMS
-
2. EXECUTIVE SUMMARY
A Quick Overview of Market Performance
- KEY FINDINGS
- MARKET TRENDS This Chapter is Available Only for the Professional Edition PRO
-
3. MARKET OVERVIEW
Understanding the Current State of The Market and Its Prospects
- MARKET SIZE
- CONSUMPTION BY COUNTRY
- MARKET FORECAST TO 2030
-
4. MOST PROMISING PRODUCT
Finding New Products to Diversify Your Business
This Chapter is Available Only for the Professional Edition PRO- TOP PRODUCTS TO DIVERSIFY YOUR BUSINESS
- BEST-SELLING PRODUCTS
- MOST CONSUMED PRODUCT
- MOST TRADED PRODUCT
- MOST PROFITABLE PRODUCT FOR EXPORT
-
5. MOST PROMISING SUPPLYING COUNTRIES
Choosing the Best Countries to Establish Your Sustainable Supply Chain
This Chapter is Available Only for the Professional Edition PRO- TOP COUNTRIES TO SOURCE YOUR PRODUCT
- TOP PRODUCING COUNTRIES
- TOP EXPORTING COUNTRIES
- LOW-COST EXPORTING COUNTRIES
-
6. MOST PROMISING OVERSEAS MARKETS
Choosing the Best Countries to Boost Your Exports
This Chapter is Available Only for the Professional Edition PRO- TOP OVERSEAS MARKETS FOR EXPORTING YOUR PRODUCT
- TOP CONSUMING MARKETS
- UNSATURATED MARKETS
- TOP IMPORTING MARKETS
- MOST PROFITABLE MARKETS
7. GLOBAL PRODUCTION
The Latest Trends and Insights into The Industry
- PRODUCTION VOLUME AND VALUE
- PRODUCTION BY COUNTRY
8. GLOBAL IMPORTS
The Largest Importers on The Market and How They Succeed
- IMPORTS FROM 2012–2023
- IMPORTS BY COUNTRY
- IMPORT PRICES BY COUNTRY
9. GLOBAL EXPORTS
The Largest Exporters on The Market and How They Succeed
- EXPORTS FROM 2012–2023
- EXPORTS BY COUNTRY
- EXPORT PRICES BY COUNTRY
-
10. PROFILES OF MAJOR PRODUCERS
The Largest Producers on The Market and Their Profiles
This Chapter is Available Only for the Professional Edition PRO -
11. COUNTRY PROFILES
The Largest Markets And Their Profiles
This Chapter is Available Only for the Professional Edition PRO- United States
- China
- Japan
- Germany
- United Kingdom
- France
- Brazil
- Italy
- Russian Federation
- India
- Canada
- Australia
- Republic of Korea
- Spain
- Mexico
- Indonesia
- Netherlands
- Turkey
- Saudi Arabia
- Switzerland
- Sweden
- Nigeria
- Poland
- Belgium
- Argentina
- Norway
- Austria
- Thailand
- United Arab Emirates
- Colombia
- Denmark
- South Africa
- Malaysia
- Israel
- Singapore
- Egypt
- Philippines
- Finland
- Chile
- Ireland
- Pakistan
- Greece
- Portugal
- Kazakhstan
- Algeria
- Czech Republic
- Qatar
- Peru
- Romania
- Vietnam
-
LIST OF TABLES
- Key Findings In 2023
- Market Volume, In Physical Terms, 2012–2023
- Market Value, 2012–2023
- Per Capita Consumption, By Country, 2018–2023
- Production, In Physical Terms, By Country, 2012–2023
- Imports, In Physical Terms, By Country, 2012–2023
- Imports, In Value Terms, By Country, 2012–2023
- Import Prices, By Country Of Destination, 2012–2023
- Exports, In Physical Terms, By Country, 2012–2023
- Exports, In Value Terms, By Country, 2012–2023
- Export Prices, By Country Of Origin, 2012–2023
-
LIST OF FIGURES
- Market Volume, In Physical Terms, 2012–2023
- Market Value, 2012–2023
- Consumption, By Country, 2023
- Market Volume Forecast to 2030
- Market Value Forecast to 2030
- Products: Market Size And Growth, By Type
- Products: Average Per Capita Consumption, By Type
- Products: Exports And Growth, By Type
- Products: Export Prices And Growth, By Type
- Production Volume And Growth
- Exports And Growth
- Export Prices And Growth
- Market Size And Growth
- Per Capita Consumption
- Imports And Growth
- Import Prices
- Production, In Physical Terms, 2012–2023
- Production, In Value Terms, 2012–2023
- Production, By Country, 2023
- Production, In Physical Terms, By Country, 2012–2023
- Imports, In Physical Terms, 2012–2023
- Imports, In Value Terms, 2012–2023
- Imports, In Physical Terms, By Country, 2023
- Imports, In Physical Terms, By Country, 2012–2023
- Imports, In Value Terms, By Country, 2012–2023
- Import Prices, By Country, 2012–2023
- Exports, In Physical Terms, 2012–2023
- Exports, In Value Terms, 2012–2023
- Exports, In Physical Terms, By Country, 2023
- Exports, In Physical Terms, By Country, 2012–2023
- Exports, In Value Terms, By Country, 2012–2023
- Export Prices, 2012–2023


