
World - Synthetic Rubber - Market Analysis, Forecast, Size, Trends And Insights
Get instant access to more than 2 million reports, dashboards, and datasets on the IndexBox Platform.
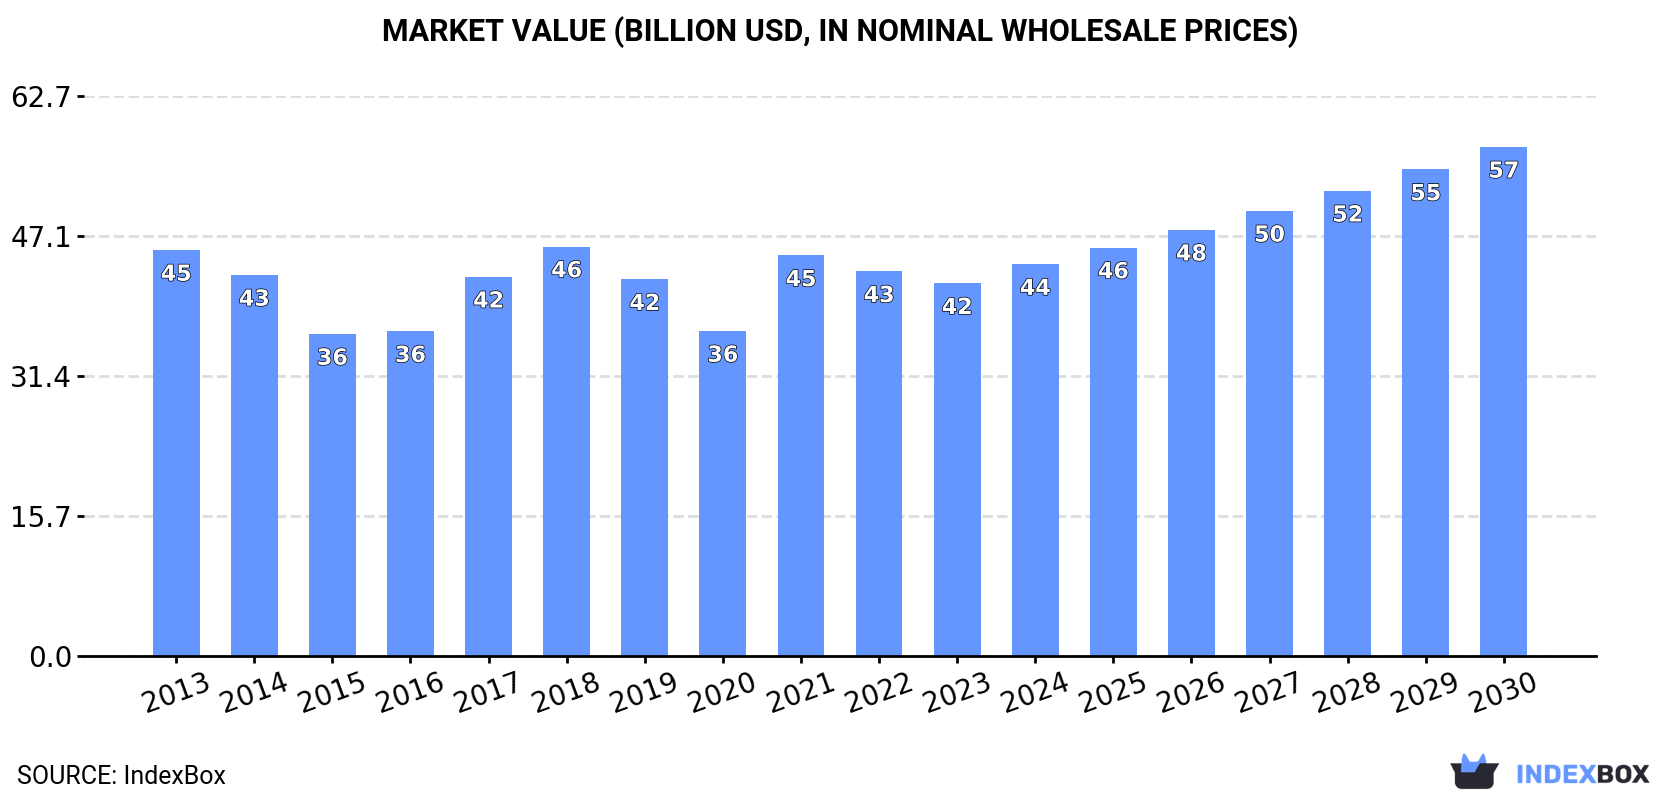
View PricingGlobal Synthetic Rubber Market: Volume to Reach 24M Tons and Value to Hit $57B by 2030
IndexBox has just published a new report: World - Synthetic Rubber - Market Analysis, Forecast, Size, Trends And Insights.
The global market for synthetic rubber is expected to continue to rise over the next seven years, driven by increasing demand. Market performance is forecasted to accelerate with a projected compound annual growth rate of +2.6% in volume, reaching 24 million tons by 2030. In value terms, the market is anticipated to grow at a CAGR of +4.6%, reaching $57 billion by the end of 2030.
Market Forecast
Driven by increasing demand for synthetic rubber worldwide, the market is expected to continue an upward consumption trend over the next seven-year period. Market performance is forecast to accelerate, expanding with an anticipated CAGR of +2.6% for the period from 2023 to 2030, which is projected to bring the market volume to 24M tons by the end of 2030.
In value terms, the market is forecast to increase with an anticipated CAGR of +4.6% for the period from 2023 to 2030, which is projected to bring the market value to $57B (in nominal wholesale prices) by the end of 2030.
Consumption
World Consumption of Synthetic Rubber
In 2023, the amount of synthetic rubber consumed worldwide declined modestly to 20M tons, approximately mirroring the year before. The total consumption volume increased at an average annual rate of +1.2% over the period from 2013 to 2023; the trend pattern remained relatively stable, with only minor fluctuations throughout the analyzed period. As a result, consumption attained the peak volume of 22M tons. From 2019 to 2023, the growth of the global consumption failed to regain momentum.
The global synthetic rubber market revenue dropped modestly to $41.8B in 2023, shrinking by -3.1% against the previous year. This figure reflects the total revenues of producers and importers (excluding logistics costs, retail marketing costs, and retailers' margins, which will be included in the final consumer price). Over the period under review, consumption continues to indicate a relatively flat trend pattern. Global consumption peaked at $45.9B in 2018; however, from 2019 to 2023, consumption failed to regain momentum.
Consumption By Country
China (5.9M tons) remains the largest synthetic rubber consuming country worldwide, comprising approx. 29% of total volume. Moreover, synthetic rubber consumption in China exceeded the figures recorded by the second-largest consumer, the United States (2.7M tons), twofold. Japan (1.4M tons) ranked third in terms of total consumption with a 6.8% share.
In China, synthetic rubber consumption expanded at an average annual rate of +7.7% over the period from 2013-2023. In the other countries, the average annual rates were as follows: the United States (+0.3% per year) and Japan (+1.4% per year).
In value terms, China ($10.1B), the United States ($6.5B) and Japan ($4B) appeared to be the countries with the highest levels of market value in 2023, together accounting for 49% of the global market. Mexico, Italy, Indonesia, Germany, Canada, India, Brazil, Russia, Turkey and South Korea lagged somewhat behind, together accounting for a further 29%.
Among the main consuming countries, Canada, with a CAGR of +6.0%, recorded the highest growth rate of market size over the period under review, while market for the other global leaders experienced more modest paces of growth.
The countries with the highest levels of synthetic rubber per capita consumption in 2023 were Japan (11 kg per person), Canada (11 kg per person) and Italy (10 kg per person).
From 2013 to 2023, the biggest increases were recorded for Canada (with a CAGR of +7.2%), while consumption for the other global leaders experienced more modest paces of growth.
Production
World Production of Synthetic Rubber
In 2023, the amount of synthetic rubber produced worldwide expanded modestly to 20M tons, picking up by 1.5% against 2022. The total output volume increased at an average annual rate of +1.4% from 2013 to 2023; the trend pattern remained consistent, with somewhat noticeable fluctuations being observed in certain years. The growth pace was the most rapid in 2016 when the production volume increased by 8.8% against the previous year. Global production peaked at 20M tons in 2018; however, from 2019 to 2023, production remained at a lower figure.
In value terms, synthetic rubber production stood at $42.1B in 2023 estimated in export price. Over the period under review, production, however, continues to indicate a relatively flat trend pattern. The pace of growth appeared the most rapid in 2021 when the production volume increased by 20% against the previous year. Global production peaked at $44B in 2018; however, from 2019 to 2023, production remained at a lower figure.
Production By Country
The countries with the highest volumes of production in 2023 were the United States (3.1M tons), South Korea (1.9M tons) and Japan (1.8M tons), together comprising 34% of global production. China, Russia, Thailand, Vietnam, Germany, Indonesia, Mexico, Taiwan (Chinese), France and Italy lagged somewhat behind, together accounting for a further 48%.
From 2013 to 2023, the most notable rate of growth in terms of production, amongst the key producing countries, was attained by Thailand (with a CAGR of +22.5%), while production for the other global leaders experienced more modest paces of growth.
Imports
World Imports of Synthetic Rubber
In 2023, overseas purchases of synthetic rubber decreased by -4% to 13M tons, falling for the second year in a row after two years of growth. The total import volume increased at an average annual rate of +3.6% over the period from 2013 to 2023; however, the trend pattern indicated some noticeable fluctuations being recorded in certain years. The most prominent rate of growth was recorded in 2016 when imports increased by 15% against the previous year. Global imports peaked at 14M tons in 2021; however, from 2022 to 2023, imports failed to regain momentum.
In value terms, synthetic rubber imports fell sharply to $27B in 2023. Overall, imports, however, recorded a relatively flat trend pattern. The most prominent rate of growth was recorded in 2017 when imports increased by 34% against the previous year. Over the period under review, global imports hit record highs at $32.1B in 2022, and then dropped sharply in the following year.
Imports By Country
China represented the major importer of synthetic rubber in the world, with the volume of imports recording 5.2M tons, which was approx. 39% of total imports in 2023. It was distantly followed by Thailand (635K tons), creating a 4.7% share of total imports. The following importers - Malaysia (546K tons), the United States (535K tons), India (525K tons), Belgium (434K tons), Germany (408K tons), Turkey (408K tons), Indonesia (366K tons), Vietnam (354K tons), Italy (299K tons), Poland (266K tons) and Brazil (241K tons) - together made up 33% of total imports.
China was also the fastest-growing in terms of the synthetic rubber imports, with a CAGR of +13.2% from 2013 to 2023. At the same time, Vietnam (+8.2%), Turkey (+4.4%), Thailand (+2.9%), Indonesia (+2.2%), Poland (+1.4%), Italy (+1.2%) and Malaysia (+1.0%) displayed positive paces of growth. India, the United States, Brazil and Belgium experienced a relatively flat trend pattern. By contrast, Germany (-2.0%) illustrated a downward trend over the same period. From 2013 to 2023, the share of China increased by +23 percentage points. The shares of the other countries remained relatively stable throughout the analyzed period.
In value terms, China ($8.1B) constitutes the largest market for imported synthetic rubber worldwide, comprising 30% of global imports. The second position in the ranking was taken by the United States ($1.3B), with a 4.9% share of global imports. It was followed by Belgium, with a 4.4% share.
In China, synthetic rubber imports expanded at an average annual rate of +6.3% over the period from 2013-2023. The remaining importing countries recorded the following average annual rates of imports growth: the United States (-2.4% per year) and Belgium (-0.1% per year).
Import Prices By Country
In 2023, the average synthetic rubber import price amounted to $2,006 per ton, which is down by -12.4% against the previous year. In general, the import price showed a perceptible shrinkage. The pace of growth appeared the most rapid in 2021 when the average import price increased by 29% against the previous year. Global import price peaked at $2,698 per ton in 2013; however, from 2014 to 2023, import prices stood at a somewhat lower figure.
Prices varied noticeably by country of destination: amid the top importers, the country with the highest price was Germany ($2,917 per ton), while Malaysia ($1,209 per ton) was amongst the lowest.
From 2013 to 2023, the most notable rate of growth in terms of prices was attained by Belgium (+0.2%), while the other global leaders experienced a decline in the import price figures.
Exports
World Exports of Synthetic Rubber
In 2023, global synthetic rubber exports contracted modestly to 13M tons, which is down by -1.9% compared with the previous year. Overall, total exports indicated a measured expansion from 2013 to 2023: its volume increased at an average annual rate of +4.1% over the last decade. The trend pattern, however, indicated some noticeable fluctuations being recorded throughout the analyzed period. The growth pace was the most rapid in 2016 when exports increased by 17% against the previous year. The global exports peaked at 14M tons in 2022, and then fell slightly in the following year.
In value terms, synthetic rubber exports dropped to $26.5B in 2023. In general, total exports indicated mild growth from 2013 to 2023: its value increased at an average annual rate of +1.5% over the last decade. The trend pattern, however, indicated some noticeable fluctuations being recorded throughout the analyzed period. The pace of growth appeared the most rapid in 2017 with an increase of 38% against the previous year. Over the period under review, the global exports reached the peak figure at $29.7B in 2022, and then dropped in the following year.
Exports By Country
Thailand (1,854K tons), South Korea (1,708K tons), Vietnam (1,294K tons), Russia (1,081K tons), China (913K tons), the United States (897K tons), Taiwan (Chinese) (700K tons), Germany (695K tons), Japan (617K tons), Malaysia (511K tons) and Belgium (487K tons) represented roughly 80% of total exports in 2023.
From 2013 to 2023, the most notable rate of growth in terms of shipments, amongst the key exporting countries, was attained by Vietnam (with a CAGR of +85.7%), while the other global leaders experienced more modest paces of growth.
In value terms, South Korea ($2.8B), Thailand ($2.6B) and the United States ($2.5B) were the countries with the highest levels of exports in 2023, with a combined 30% share of global exports. Vietnam, Japan, Russia, China, Germany, Taiwan (Chinese), Belgium and Malaysia lagged somewhat behind, together accounting for a further 49%.
Vietnam, with a CAGR of +65.7%, recorded the highest growth rate of the value of exports, among the main exporting countries over the period under review, while shipments for the other global leaders experienced more modest paces of growth.
Export Prices By Country
The average synthetic rubber export price stood at $1,985 per ton in 2023, reducing by -8.8% against the previous year. In general, the export price recorded a perceptible contraction. The pace of growth appeared the most rapid in 2021 an increase of 29%. The global export price peaked at $2,549 per ton in 2013; however, from 2014 to 2023, the export prices failed to regain momentum.
Prices varied noticeably by country of origin: amid the top suppliers, the country with the highest price was Japan ($3,304 per ton), while Malaysia ($1,335 per ton) was amongst the lowest.
From 2013 to 2023, the most notable rate of growth in terms of prices was attained by Taiwan (Chinese) (+0.4%), while the other global leaders experienced mixed trends in the export price figures.
This report provides an in-depth analysis of the global synthetic rubber market. Within it, you will discover the latest data on market trends and opportunities by country, consumption, production and price developments, as well as the global trade (imports and exports). The forecast exhibits the market prospects through 2030.
Product coverage:
- Prodcom 20171050 - Synthetic latex rubber
- Prodcom 20171090 - Synthetic rubber (excluding latex)
Country coverage:
Worldwide - the report contains statistical data for 200 countries and includes detailed profiles of the 50 largest consuming countries:
- USA
- China
- Japan
- Germany
- United Kingdom
- France
- Brazil
- Italy
- Russian Federation
- India
- Canada
- Australia
- Republic of Korea
- Spain
- Mexico
- Indonesia
- Netherlands
- Turkey
- Saudi Arabia
- Switzerland
- Sweden
- Nigeria
- Poland
- Belgium
- Argentina
- Norway
- Austria
- Thailand
- United Arab Emirates
- Colombia
- Denmark
- South Africa
- Malaysia
- Israel
- Singapore
- Egypt
- Philippines
- Finland
- Chile
- Ireland
- Pakistan
- Greece
- Portugal
- Kazakhstan
- Algeria
- Czech Republic
- Qatar
- Peru
- Romania
- Vietnam
+ the largest producing countries
Data coverage:
- Global market volume and value
- Per Capita consumption
- Forecast of the market dynamics in the medium term
- Global production, split by region and country
- Global trade (exports and imports)
- Export and import prices
- Market trends, drivers and restraints
- Key market players and their profiles
Company coverage:
Reasons to buy this report:
- Take advantage of the latest data
- Find deeper insights into current market developments
- Discover vital success factors affecting the market
This report is designed for manufacturers, distributors, importers, and wholesalers, as well as for investors, consultants and advisors.
In this report, you can find information that helps you to make informed decisions on the following issues:
- How to diversify your business and benefit from new market opportunities
- How to load your idle production capacity
- How to boost your sales on overseas markets
- How to increase your profit margins
- How to make your supply chain more sustainable
- How to reduce your production and supply chain costs
- How to outsource production to other countries
- How to prepare your business for global expansion
While doing this research, we combine the accumulated expertise of our analysts and the capabilities of artificial intelligence. The AI-based platform, developed by our data scientists, constitutes the key working tool for business analysts, empowering them to discover deep insights and ideas from the marketing data.
-
1. INTRODUCTION
Making Data-Driven Decisions to Grow Your Business
- REPORT DESCRIPTION
- RESEARCH METHODOLOGY AND AI PLATFORM
- DATA-DRIVEN DECISIONS FOR YOUR BUSINESS
- GLOSSARY AND SPECIFIC TERMS
-
2. EXECUTIVE SUMMARY
A Quick Overview of Market Performance
- KEY FINDINGS
- MARKET TRENDS This Chapter is Available Only for the Professional Edition PRO
-
3. MARKET OVERVIEW
Understanding the Current State of The Market and Its Prospects
- MARKET SIZE
- CONSUMPTION BY COUNTRY
- MARKET FORECAST TO 2030
-
4. MOST PROMISING PRODUCT
Finding New Products to Diversify Your Business
This Chapter is Available Only for the Professional Edition PRO- TOP PRODUCTS TO DIVERSIFY YOUR BUSINESS
- BEST-SELLING PRODUCTS
- MOST CONSUMED PRODUCT
- MOST TRADED PRODUCT
- MOST PROFITABLE PRODUCT FOR EXPORT
-
5. MOST PROMISING SUPPLYING COUNTRIES
Choosing the Best Countries to Establish Your Sustainable Supply Chain
This Chapter is Available Only for the Professional Edition PRO- TOP COUNTRIES TO SOURCE YOUR PRODUCT
- TOP PRODUCING COUNTRIES
- TOP EXPORTING COUNTRIES
- LOW-COST EXPORTING COUNTRIES
-
6. MOST PROMISING OVERSEAS MARKETS
Choosing the Best Countries to Boost Your Exports
This Chapter is Available Only for the Professional Edition PRO- TOP OVERSEAS MARKETS FOR EXPORTING YOUR PRODUCT
- TOP CONSUMING MARKETS
- UNSATURATED MARKETS
- TOP IMPORTING MARKETS
- MOST PROFITABLE MARKETS
7. GLOBAL PRODUCTION
The Latest Trends and Insights into The Industry
- PRODUCTION VOLUME AND VALUE
- PRODUCTION BY COUNTRY
8. GLOBAL IMPORTS
The Largest Importers on The Market and How They Succeed
- IMPORTS FROM 2012–2023
- IMPORTS BY COUNTRY
- IMPORT PRICES BY COUNTRY
9. GLOBAL EXPORTS
The Largest Exporters on The Market and How They Succeed
- EXPORTS FROM 2012–2023
- EXPORTS BY COUNTRY
- EXPORT PRICES BY COUNTRY
-
10. PROFILES OF MAJOR PRODUCERS
The Largest Producers on The Market and Their Profiles
This Chapter is Available Only for the Professional Edition PRO -
11. COUNTRY PROFILES
The Largest Markets And Their Profiles
This Chapter is Available Only for the Professional Edition PRO- United States
- China
- Japan
- Germany
- United Kingdom
- France
- Brazil
- Italy
- Russian Federation
- India
- Canada
- Australia
- Republic of Korea
- Spain
- Mexico
- Indonesia
- Netherlands
- Turkey
- Saudi Arabia
- Switzerland
- Sweden
- Nigeria
- Poland
- Belgium
- Argentina
- Norway
- Austria
- Thailand
- United Arab Emirates
- Colombia
- Denmark
- South Africa
- Malaysia
- Israel
- Singapore
- Egypt
- Philippines
- Finland
- Chile
- Ireland
- Pakistan
- Greece
- Portugal
- Kazakhstan
- Algeria
- Czech Republic
- Qatar
- Peru
- Romania
- Vietnam
-
LIST OF TABLES
- Key Findings In 2023
- Market Volume, In Physical Terms, 2012–2023
- Market Value, 2012–2023
- Per Capita Consumption, By Country, 2018–2023
- Production, In Physical Terms, By Country, 2012–2023
- Imports, In Physical Terms, By Country, 2012–2023
- Imports, In Value Terms, By Country, 2012–2023
- Import Prices, By Country Of Destination, 2012–2023
- Exports, In Physical Terms, By Country, 2012–2023
- Exports, In Value Terms, By Country, 2012–2023
- Export Prices, By Country Of Origin, 2012–2023
-
LIST OF FIGURES
- Market Volume, In Physical Terms, 2012–2023
- Market Value, 2012–2023
- Consumption, By Country, 2023
- Market Volume Forecast to 2030
- Market Value Forecast to 2030
- Products: Market Size And Growth, By Type
- Products: Average Per Capita Consumption, By Type
- Products: Exports And Growth, By Type
- Products: Export Prices And Growth, By Type
- Production Volume And Growth
- Exports And Growth
- Export Prices And Growth
- Market Size And Growth
- Per Capita Consumption
- Imports And Growth
- Import Prices
- Production, In Physical Terms, 2012–2023
- Production, In Value Terms, 2012–2023
- Production, By Country, 2023
- Production, In Physical Terms, By Country, 2012–2023
- Imports, In Physical Terms, 2012–2023
- Imports, In Value Terms, 2012–2023
- Imports, In Physical Terms, By Country, 2023
- Imports, In Physical Terms, By Country, 2012–2023
- Imports, In Value Terms, By Country, 2012–2023
- Import Prices, By Country, 2012–2023
- Exports, In Physical Terms, 2012–2023
- Exports, In Value Terms, 2012–2023
- Exports, In Physical Terms, By Country, 2023
- Exports, In Physical Terms, By Country, 2012–2023
- Exports, In Value Terms, By Country, 2012–2023
- Export Prices, 2012–2023


