
World - Instruments And Apparatus For Measuring Or Checking Pressure Of Liquids Or Gasses - Market Analysis, Forecast, Size, Trends and Insights
Get instant access to more than 2 million reports, dashboards, and datasets on the IndexBox Platform.
View PricingGlobal Pressure Instruments Market to Grow at 4.0% CAGR, Reaching 2.1B Units by 2030
IndexBox has just published a new report: World - Instruments And Apparatus For Measuring Or Checking Pressure Of Liquids Or Gasses - Market Analysis, Forecast, Size, Trends and Insights.
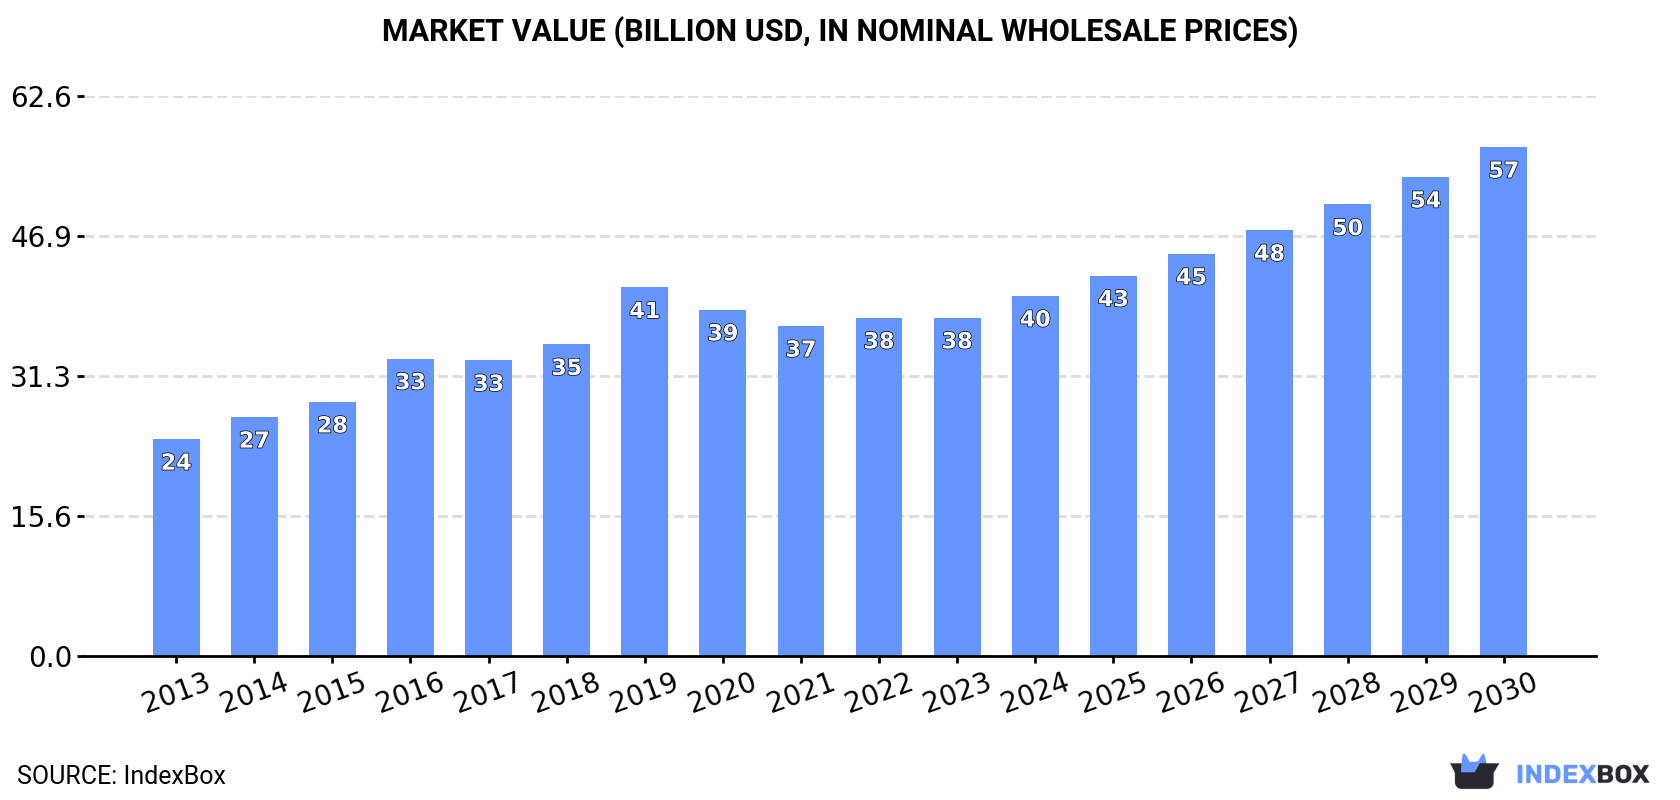
The global market for pressure measurement instruments is expected to continue growing steadily over the next seven years, driven by increasing demand worldwide. Market performance is forecasted to slow down slightly, with a projected CAGR of +4.0% in volume and +6.0% in value. By 2030, the market is anticipated to reach 2.1B units and $56.9B in value, indicating a positive outlook for the industry.
Market Forecast
Driven by increasing demand for instruments and apparatus for measuring or checking pressure of liquids or gasses worldwide, the market is expected to continue an upward consumption trend over the next seven-year period. Market performance is forecast to decelerate, expanding with an anticipated CAGR of +4.0% for the period from 2023 to 2030, which is projected to bring the market volume to 2.1B units by the end of 2030.
In value terms, the market is forecast to increase with an anticipated CAGR of +6.0% for the period from 2023 to 2030, which is projected to bring the market value to $56.9B (in nominal wholesale prices) by the end of 2030.
Consumption
World Consumption of Instruments And Apparatus For Measuring Or Checking Pressure Of Liquids Or Gasses
In 2023, the amount of instruments and apparatus for measuring or checking pressure of liquids or gasses consumed worldwide declined slightly to 1.6B units, stabilizing at 2022 figures. Overall, the total consumption indicated strong growth from 2013 to 2023: its volume increased at an average annual rate of +5.1% over the last decade. The trend pattern, however, indicated some noticeable fluctuations being recorded throughout the analyzed period. Based on 2023 figures, consumption decreased by -5.5% against 2021 indices. Over the period under review, global consumption hit record highs at 1.7B units in 2021; however, from 2022 to 2023, consumption failed to regain momentum.
The global test and measurement market value stood at $37.8B in 2023, remaining relatively unchanged against the previous year. This figure reflects the total revenues of producers and importers (excluding logistics costs, retail marketing costs, and retailers' margins, which will be included in the final consumer price). In general, the total consumption indicated a temperate expansion from 2013 to 2023: its value increased at an average annual rate of +4.5% over the last decade. The trend pattern, however, indicated some noticeable fluctuations being recorded throughout the analyzed period. Based on 2023 figures, consumption increased by +2.5% against 2021 indices. As a result, consumption reached the peak level of $41.2B. From 2020 to 2023, the growth of the global market remained at a lower figure.
Consumption By Country
The countries with the highest volumes of consumption in 2023 were China (296M units), the United States (229M units) and India (160M units), with a combined 44% share of global consumption. Brazil, Germany, Turkey, Mexico, South Korea, Japan, the UK, Thailand, Egypt and the Philippines lagged somewhat behind, together accounting for a further 34%.
From 2013 to 2023, the biggest increases were recorded for Japan (with a CAGR of +16.7%), while consumption for the other global leaders experienced more modest paces of growth.
In value terms, the largest test and measurement markets worldwide were the Philippines ($4.7B), China ($4B) and India ($3.5B), with a combined 32% share of the global market. The United States, Egypt, Turkey, Germany, the UK, South Korea, Thailand, Japan, Mexico and Brazil lagged somewhat behind, together comprising a further 15%.
Thailand, with a CAGR of +9.4%, recorded the highest growth rate of market size in terms of the main consuming countries over the period under review, while market for the other global leaders experienced more modest paces of growth.
The countries with the highest levels of test and measurement per capita consumption in 2023 were South Korea (873 units per 1000 persons), Germany (768 units per 1000 persons) and the United States (679 units per 1000 persons).
From 2013 to 2023, the most notable rate of growth in terms of consumption, amongst the main consuming countries, was attained by Japan (with a CAGR of +17.0%), while consumption for the other global leaders experienced more modest paces of growth.
Production
World Production of Instruments And Apparatus For Measuring Or Checking Pressure Of Liquids Or Gasses
Global test and measurement production stood at 1.3B units in 2023, approximately reflecting the previous year's figure. Overall, the total production indicated a notable increase from 2013 to 2023: its volume increased at an average annual rate of +2.4% over the last decade. The trend pattern, however, indicated some noticeable fluctuations being recorded throughout the analyzed period. Based on 2023 figures, production decreased by -1.9% against 2019 indices. The pace of growth appeared the most rapid in 2018 with an increase of 36%. Over the period under review, global production attained the peak volume at 1.4B units in 2019; however, from 2020 to 2023, production remained at a lower figure.
In value terms, test and measurement production rose slightly to $44.1B in 2023 estimated in export price. In general, the total production indicated notable growth from 2013 to 2023: its value increased at an average annual rate of +4.4% over the last decade. The trend pattern, however, indicated some noticeable fluctuations being recorded throughout the analyzed period. Based on 2023 figures, production decreased by -3.6% against 2019 indices. The growth pace was the most rapid in 2018 with an increase of 27%. Global production peaked at $45.8B in 2019; however, from 2020 to 2023, production remained at a lower figure.
Production By Country
China (459M units) constituted the country with the largest volume of test and measurement production, accounting for 34% of total volume. Moreover, test and measurement production in China exceeded the figures recorded by the second-largest producer, India (137M units), threefold. Brazil (132M units) ranked third in terms of total production with a 9.8% share.
In China, test and measurement production increased at an average annual rate of +4.1% over the period from 2013-2023. In the other countries, the average annual rates were as follows: India (+9.0% per year) and Brazil (+12.4% per year).
Imports
World Imports of Instruments And Apparatus For Measuring Or Checking Pressure Of Liquids Or Gasses
Global test and measurement imports reduced slightly to 1.2B units in 2023, which is down by -4.7% on the previous year. Over the period under review, total imports indicated strong growth from 2013 to 2023: its volume increased at an average annual rate of +5.9% over the last decade. The trend pattern, however, indicated some noticeable fluctuations being recorded throughout the analyzed period. Based on 2023 figures, imports decreased by -10.9% against 2021 indices. The pace of growth was the most pronounced in 2015 with an increase of 24%. Over the period under review, global imports hit record highs at 1.4B units in 2021; however, from 2022 to 2023, imports failed to regain momentum.
In value terms, test and measurement imports expanded markedly to $11.6B in 2023. The total import value increased at an average annual rate of +4.7% over the period from 2013 to 2023; however, the trend pattern indicated some noticeable fluctuations being recorded in certain years. The growth pace was the most rapid in 2021 when imports increased by 15% against the previous year. Global imports peaked in 2023 and are expected to retain growth in the immediate term.
Imports By Country
The countries with the highest levels of test and measurement imports in 2023 were the United States (238M units), China (184M units) and Germany (171M units), together accounting for 48% of total import. Mexico (97M units) took the next position in the ranking, followed by South Korea (58M units). All these countries together took near 13% share of total imports. The following importers - Japan (38M units), the UK (36M units), Singapore (33M units), Poland (30M units), the Czech Republic (26M units), India (26M units), Italy (26M units) and Turkey (25M units) - together made up 19% of total imports.
From 2013 to 2023, the most notable rate of growth in terms of purchases, amongst the key importing countries, was attained by India (with a CAGR of +29.7%), while imports for the other global leaders experienced more modest paces of growth.
In value terms, the largest test and measurement importing markets worldwide were the United States ($1.8B), China ($1.5B) and Germany ($1.4B), together comprising 41% of global imports. Mexico, South Korea, the UK, Italy, Japan, Poland, Turkey, India, the Czech Republic and Singapore lagged somewhat behind, together comprising a further 24%.
India, with a CAGR of +14.6%, saw the highest growth rate of the value of imports, among the main importing countries over the period under review, while purchases for the other global leaders experienced more modest paces of growth.
Import Prices By Country
The average test and measurement import price stood at $9.4 per unit in 2023, surging by 13% against the previous year. In general, the import price, however, saw a slight reduction. Over the period under review, average import prices hit record highs at $10 per unit in 2013; however, from 2014 to 2023, import prices failed to regain momentum.
There were significant differences in the average prices amongst the major importing countries. In 2023, amid the top importers, the country with the highest price was Italy ($13 per unit), while Singapore ($4.4 per unit) was amongst the lowest.
From 2013 to 2023, the most notable rate of growth in terms of prices was attained by Italy (+4.7%), while the other global leaders experienced more modest paces of growth.
Exports
World Exports of Instruments And Apparatus For Measuring Or Checking Pressure Of Liquids Or Gasses
Global test and measurement exports reduced modestly to 1B units in 2023, waning by -4.4% against the previous year's figure. Overall, total exports indicated a pronounced expansion from 2013 to 2023: its volume increased at an average annual rate of +2.3% over the last decade. The trend pattern, however, indicated some noticeable fluctuations being recorded throughout the analyzed period. Based on 2023 figures, exports decreased by -7.3% against 2021 indices. The pace of growth was the most pronounced in 2018 with an increase of 36%. Over the period under review, the global exports reached the maximum at 1.1B units in 2021; however, from 2022 to 2023, the exports failed to regain momentum.
In value terms, test and measurement exports expanded rapidly to $11.2B in 2023. The total export value increased at an average annual rate of +4.2% over the period from 2013 to 2023; however, the trend pattern indicated some noticeable fluctuations being recorded throughout the analyzed period. The pace of growth was the most pronounced in 2021 with an increase of 17% against the previous year. Over the period under review, the global exports attained the maximum in 2023 and are expected to retain growth in the immediate term.
Exports By Country
In 2023, China (346M units), distantly followed by Germany (212M units), Mexico (98M units) and Malaysia (53M units) represented the main exporters of instruments and apparatus for measuring or checking pressure of liquids or gasses, together constituting 69% of total exports. Singapore (30M units), Taiwan (Chinese) (30M units), Poland (28M units), Spain (20M units), the UK (19M units), the Czech Republic (19M units), France (19M units), Japan (18M units) and Bulgaria (17M units) held a minor share of total exports.
From 2013 to 2023, the most notable rate of growth in terms of shipments, amongst the main exporting countries, was attained by the Czech Republic (with a CAGR of +21.8%), while the other global leaders experienced more modest paces of growth.
In value terms, the largest test and measurement supplying countries worldwide were Germany ($2.6B), China ($1.4B) and Mexico ($665M), together accounting for 41% of global exports. The UK, France, Japan, Malaysia, Poland, Taiwan (Chinese), Singapore, the Czech Republic, Bulgaria and Spain lagged somewhat behind, together comprising a further 20%.
Bulgaria, with a CAGR of +21.2%, recorded the highest growth rate of the value of exports, in terms of the main exporting countries over the period under review, while shipments for the other global leaders experienced more modest paces of growth.
Export Prices By Country
In 2023, the average test and measurement export price amounted to $11 per unit, rising by 13% against the previous year. Over the period from 2013 to 2023, it increased at an average annual rate of +1.9%. The most prominent rate of growth was recorded in 2015 an increase of 17%. Over the period under review, the average export prices reached the peak figure at $12 per unit in 2017; however, from 2018 to 2023, the export prices remained at a lower figure.
Prices varied noticeably by country of origin: amid the top suppliers, the country with the highest price was France ($23 per unit), while China ($4 per unit) was amongst the lowest.
From 2013 to 2023, the most notable rate of growth in terms of prices was attained by the UK (+14.1%), while the other global leaders experienced more modest paces of growth.
This report provides an in-depth analysis of the global test and measurement market. Within it, you will discover the latest data on market trends and opportunities by country, consumption, production and price developments, as well as the global trade (imports and exports). The forecast exhibits the market prospects through 2030.
Product coverage:
- Prodcom 26515271 - Electronic pressure gauges, sensors, indicators and transmitters
- Prodcom 26515274 - Non-electronic spiral or metal diaphragm type pressure gauges
- Prodcom 26515279 - Other instruments for measuring or checking pressure: others
Country coverage:
Worldwide - the report contains statistical data for 200 countries and includes detailed profiles of the 50 largest consuming countries:
- USA
- China
- Japan
- Germany
- United Kingdom
- France
- Brazil
- Italy
- Russian Federation
- India
- Canada
- Australia
- Republic of Korea
- Spain
- Mexico
- Indonesia
- Netherlands
- Turkey
- Saudi Arabia
- Switzerland
- Sweden
- Nigeria
- Poland
- Belgium
- Argentina
- Norway
- Austria
- Thailand
- United Arab Emirates
- Colombia
- Denmark
- South Africa
- Malaysia
- Israel
- Singapore
- Egypt
- Philippines
- Finland
- Chile
- Ireland
- Pakistan
- Greece
- Portugal
- Kazakhstan
- Algeria
- Czech Republic
- Qatar
- Peru
- Romania
- Vietnam
+ the largest producing countries
Data coverage:
- Global market volume and value
- Per Capita consumption
- Forecast of the market dynamics in the medium term
- Global production, split by region and country
- Global trade (exports and imports)
- Export and import prices
- Market trends, drivers and restraints
- Key market players and their profiles
Reasons to buy this report:
- Take advantage of the latest data
- Find deeper insights into current market developments
- Discover vital success factors affecting the market
This report is designed for manufacturers, distributors, importers, and wholesalers, as well as for investors, consultants and advisors.
In this report, you can find information that helps you to make informed decisions on the following issues:
- How to diversify your business and benefit from new market opportunities
- How to load your idle production capacity
- How to boost your sales on overseas markets
- How to increase your profit margins
- How to make your supply chain more sustainable
- How to reduce your production and supply chain costs
- How to outsource production to other countries
- How to prepare your business for global expansion
While doing this research, we combine the accumulated expertise of our analysts and the capabilities of artificial intelligence. The AI-based platform, developed by our data scientists, constitutes the key working tool for business analysts, empowering them to discover deep insights and ideas from the marketing data.
-
1. INTRODUCTION
Making Data-Driven Decisions to Grow Your Business
- REPORT DESCRIPTION
- RESEARCH METHODOLOGY AND AI PLATFORM
- DATA-DRIVEN DECISIONS FOR YOUR BUSINESS
- GLOSSARY AND SPECIFIC TERMS
-
2. EXECUTIVE SUMMARY
A Quick Overview of Market Performance
- KEY FINDINGS
- MARKET TRENDS This Chapter is Available Only for the Professional Edition PRO
-
3. MARKET OVERVIEW
Understanding the Current State of The Market and Its Prospects
- MARKET SIZE
- CONSUMPTION BY COUNTRY
- MARKET FORECAST TO 2030
-
4. MOST PROMISING PRODUCT
Finding New Products to Diversify Your Business
This Chapter is Available Only for the Professional Edition PRO- TOP PRODUCTS TO DIVERSIFY YOUR BUSINESS
- BEST-SELLING PRODUCTS
- MOST CONSUMED PRODUCT
- MOST TRADED PRODUCT
- MOST PROFITABLE PRODUCT FOR EXPORT
-
5. MOST PROMISING SUPPLYING COUNTRIES
Choosing the Best Countries to Establish Your Sustainable Supply Chain
This Chapter is Available Only for the Professional Edition PRO- TOP COUNTRIES TO SOURCE YOUR PRODUCT
- TOP PRODUCING COUNTRIES
- TOP EXPORTING COUNTRIES
- LOW-COST EXPORTING COUNTRIES
-
6. MOST PROMISING OVERSEAS MARKETS
Choosing the Best Countries to Boost Your Exports
This Chapter is Available Only for the Professional Edition PRO- TOP OVERSEAS MARKETS FOR EXPORTING YOUR PRODUCT
- TOP CONSUMING MARKETS
- UNSATURATED MARKETS
- TOP IMPORTING MARKETS
- MOST PROFITABLE MARKETS
7. GLOBAL PRODUCTION
The Latest Trends and Insights into The Industry
- PRODUCTION VOLUME AND VALUE
- PRODUCTION BY COUNTRY
8. GLOBAL IMPORTS
The Largest Importers on The Market and How They Succeed
- IMPORTS FROM 2012–2023
- IMPORTS BY COUNTRY
- IMPORT PRICES BY COUNTRY
9. GLOBAL EXPORTS
The Largest Exporters on The Market and How They Succeed
- EXPORTS FROM 2012–2023
- EXPORTS BY COUNTRY
- EXPORT PRICES BY COUNTRY
-
10. PROFILES OF MAJOR PRODUCERS
The Largest Producers on The Market and Their Profiles
This Chapter is Available Only for the Professional Edition PRO -
11. COUNTRY PROFILES
The Largest Markets And Their Profiles
This Chapter is Available Only for the Professional Edition PRO- United States
- China
- Japan
- Germany
- United Kingdom
- France
- Brazil
- Italy
- Russian Federation
- India
- Canada
- Australia
- Republic of Korea
- Spain
- Mexico
- Indonesia
- Netherlands
- Turkey
- Saudi Arabia
- Switzerland
- Sweden
- Nigeria
- Poland
- Belgium
- Argentina
- Norway
- Austria
- Thailand
- United Arab Emirates
- Colombia
- Denmark
- South Africa
- Malaysia
- Israel
- Singapore
- Egypt
- Philippines
- Finland
- Chile
- Ireland
- Pakistan
- Greece
- Portugal
- Kazakhstan
- Algeria
- Czech Republic
- Qatar
- Peru
- Romania
- Vietnam
-
LIST OF TABLES
- Key Findings In 2023
- Market Volume, In Physical Terms, 2012–2023
- Market Value, 2012–2023
- Per Capita Consumption, By Country, 2018–2023
- Production, In Physical Terms, By Country, 2012–2023
- Imports, In Physical Terms, By Country, 2012–2023
- Imports, In Value Terms, By Country, 2012–2023
- Import Prices, By Country Of Destination, 2012–2023
- Exports, In Physical Terms, By Country, 2012–2023
- Exports, In Value Terms, By Country, 2012–2023
- Export Prices, By Country Of Origin, 2012–2023
-
LIST OF FIGURES
- Market Volume, In Physical Terms, 2012–2023
- Market Value, 2012–2023
- Consumption, By Country, 2023
- Market Volume Forecast to 2030
- Market Value Forecast to 2030
- Products: Market Size And Growth, By Type
- Products: Average Per Capita Consumption, By Type
- Products: Exports And Growth, By Type
- Products: Export Prices And Growth, By Type
- Production Volume And Growth
- Exports And Growth
- Export Prices And Growth
- Market Size And Growth
- Per Capita Consumption
- Imports And Growth
- Import Prices
- Production, In Physical Terms, 2012–2023
- Production, In Value Terms, 2012–2023
- Production, By Country, 2023
- Production, In Physical Terms, By Country, 2012–2023
- Imports, In Physical Terms, 2012–2023
- Imports, In Value Terms, 2012–2023
- Imports, In Physical Terms, By Country, 2023
- Imports, In Physical Terms, By Country, 2012–2023
- Imports, In Value Terms, By Country, 2012–2023
- Import Prices, By Country, 2012–2023
- Exports, In Physical Terms, 2012–2023
- Exports, In Value Terms, 2012–2023
- Exports, In Physical Terms, By Country, 2023
- Exports, In Physical Terms, By Country, 2012–2023
- Exports, In Value Terms, By Country, 2012–2023
- Export Prices, 2012–2023


