
Thailand - Roasted Coffee (Not Decaffeinated) - Market Analysis, Forecast, Size, Trends And Insights
Get instant access to more than 2 million reports, dashboards, and datasets on the IndexBox Platform.
View PricingThailand's Imports of Non-Decaffeinated Roasted Coffee Surge to $27M in 2023
Thailand Roasted Coffee Imports
Non-decaffeinated roasted coffee imports into Thailand dropped slightly to 1.6K tons in 2023, leveling off at the previous year. In general, imports, however, enjoyed resilient growth. The most prominent rate of growth was recorded in 2014 with an increase of 104% against the previous year. Over the period under review, imports reached the maximum at 3.4K tons in 2020; however, from 2021 to 2023, imports stood at a somewhat lower figure.
In value terms, non-decaffeinated roasted coffee imports expanded significantly to $27M (IndexBox estimates) in 2023. Over the period under review, imports, however, enjoyed a strong expansion. The growth pace was the most rapid in 2017 with an increase of 64% against the previous year. Imports peaked at $28M in 2020; however, from 2021 to 2023, imports remained at a lower figure.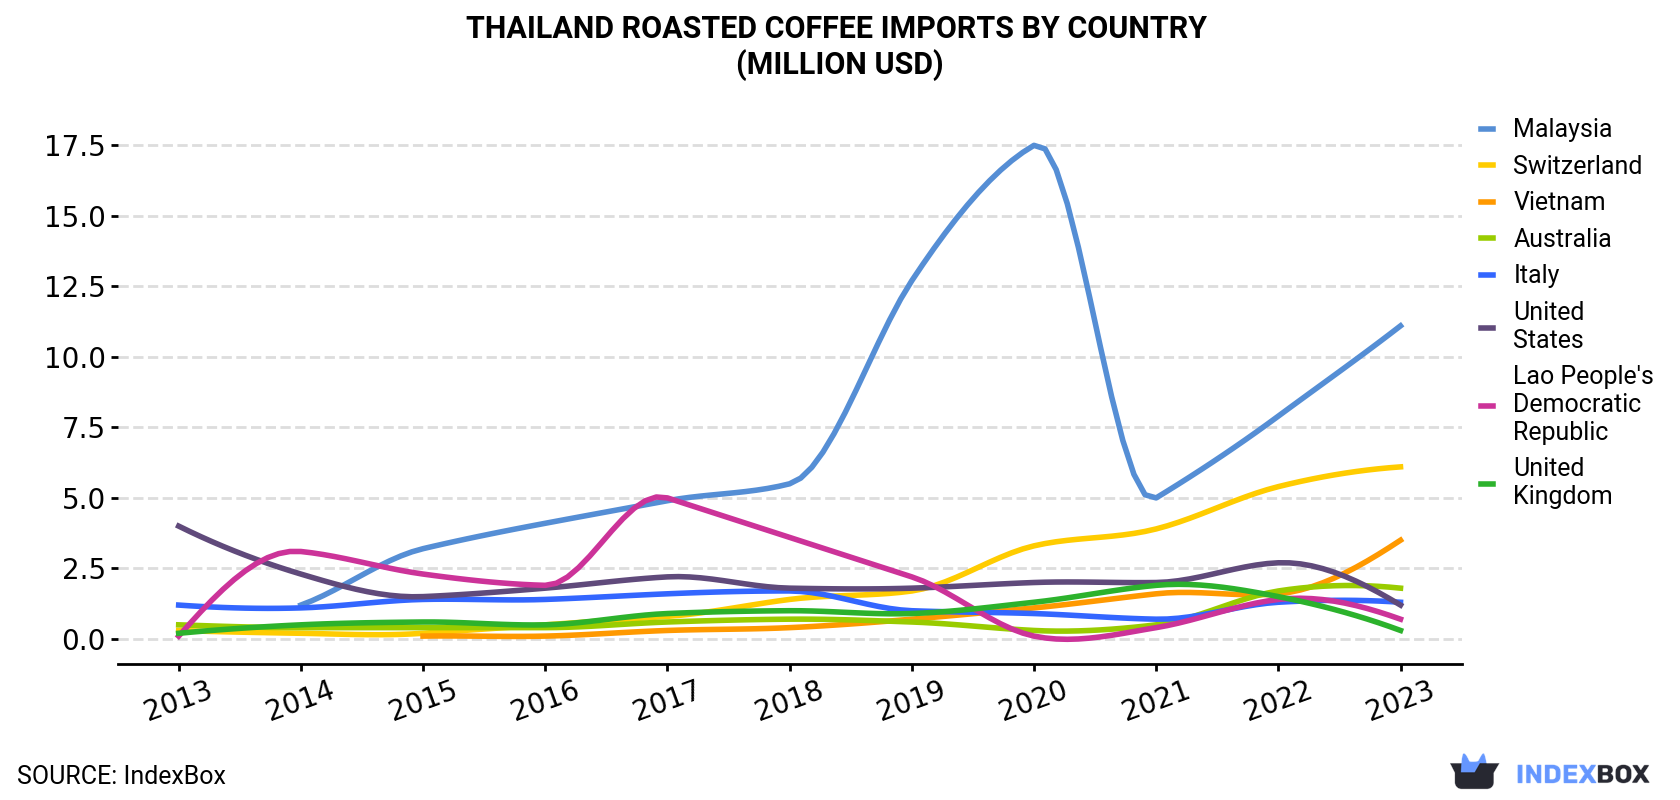
| COUNTRY | Import Value of Roasted Coffee in Thailand (million USD) | ||||||||||
|---|---|---|---|---|---|---|---|---|---|---|---|
| 2013 | 2014 | 2015 | 2016 | 2017 | 2018 | 2019 | 2020 | 2021 | 2022 | 2023 | |
| Malaysia | N/A | 1.2 | 3.2 | 4.1 | 4.9 | 5.5 | 12.7 | 17.5 | 5.0 | 7.9 | 11.1 |
| Switzerland | 0.3 | 0.2 | 0.2 | 0.5 | 0.8 | 1.4 | 1.7 | 3.3 | 3.9 | 5.4 | 6.1 |
| Vietnam | N/A | N/A | 0.1 | 0.1 | 0.3 | 0.4 | 0.7 | 1.1 | 1.6 | 1.6 | 3.5 |
| Australia | 0.5 | 0.4 | 0.4 | 0.4 | 0.6 | 0.7 | 0.6 | 0.3 | 0.5 | 1.7 | 1.8 |
| Italy | 1.2 | 1.1 | 1.4 | 1.4 | 1.6 | 1.7 | 1.0 | 0.9 | 0.7 | 1.3 | 1.3 |
| United States | 4.0 | 2.3 | 1.5 | 1.8 | 2.2 | 1.8 | 1.8 | 2.0 | 2.0 | 2.7 | 1.2 |
| Lao People's Democratic Republic | 0.1 | 3.1 | 2.3 | 1.9 | 5.0 | 3.6 | 2.2 | 0.1 | 0.4 | 1.4 | 0.7 |
| United Kingdom | 0.2 | 0.5 | 0.6 | 0.5 | 0.9 | 1.0 | 0.9 | 1.3 | 1.9 | 1.5 | 0.3 |
| Others | 0.5 | 0.6 | 0.6 | 0.8 | 2.6 | 2.0 | 1.6 | 1.3 | 1.1 | 0.9 | 1.0 |
| Total | 6.8 | 9.5 | 10.4 | 11.5 | 18.8 | 18.2 | 23.3 | 27.9 | 17.1 | 24.4 | 27.0 |
Imports by Country
In 2023, Malaysia (742 tons) constituted the largest non-decaffeinated roasted coffee supplier to Thailand, with a 46% share of total imports. Moreover, non-decaffeinated roasted coffee imports from Malaysia exceeded the figures recorded by the second-largest supplier, Vietnam (254 tons), threefold. The third position in this ranking was held by Switzerland (199 tons), with a 12% share.
From 2013 to 2023, the average annual growth rate of volume from Malaysia stood at +286.4%. The remaining supplying countries recorded the following average annual rates of imports growth: Vietnam (+178.7% per year) and Switzerland (+26.6% per year).
In value terms, the largest non-decaffeinated roasted coffee suppliers to Thailand were Malaysia ($11M), Switzerland ($6.1M) and Vietnam ($3.5M), with a combined 77% share of total imports.
Among the main suppliers, Malaysia, with a CAGR of +295.0%, recorded the highest rates of growth with regard to the value of imports, over the period under review, while purchases for the other leaders experienced more modest paces of growth.
Import Prices by Country
In 2023, the roasted coffee price stood at $16,812 per ton (CIF, Thailand), rising by 13% against the previous year. Over the period under review, the import price saw a notable expansion. The most prominent rate of growth was recorded in 2021 an increase of 47% against the previous year. Over the period under review, average import prices hit record highs in 2023 and is likely to continue growth in the near future.
Prices varied noticeably by country of origin: amid the top importers, the country with the highest price was Indonesia ($34,645 per ton), while the price for Lao People's Democratic Republic ($7,958 per ton) was amongst the lowest.
From 2013 to 2023, the most notable rate of growth in terms of prices was attained by Indonesia (+18.4%), while the prices for the other major suppliers experienced more modest paces of growth.
This report provides an in-depth analysis of the non-decaffeinated roasted coffee market in Thailand. Within it, you will discover the latest data on market trends and opportunities by country, consumption, production and price developments, as well as the global trade (imports and exports). The forecast exhibits the market prospects through 2030.
Product coverage:
- Prodcom 10831150 - Roasted coffee, not decaffeinated
Country coverage:
- Thailand
Data coverage:
- Market volume and value
- Per Capita consumption
- Forecast of the market dynamics in the medium term
- Trade (exports and imports) in Thailand
- Export and import prices
- Market trends, drivers and restraints
- Key market players and their profiles
Reasons to buy this report:
- Take advantage of the latest data
- Find deeper insights into current market developments
- Discover vital success factors affecting the market
This report is designed for manufacturers, distributors, importers, and wholesalers, as well as for investors, consultants and advisors.
In this report, you can find information that helps you to make informed decisions on the following issues:
- How to diversify your business and benefit from new market opportunities
- How to load your idle production capacity
- How to boost your sales on overseas markets
- How to increase your profit margins
- How to make your supply chain more sustainable
- How to reduce your production and supply chain costs
- How to outsource production to other countries
- How to prepare your business for global expansion
While doing this research, we combine the accumulated expertise of our analysts and the capabilities of artificial intelligence. The AI-based platform, developed by our data scientists, constitutes the key working tool for business analysts, empowering them to discover deep insights and ideas from the marketing data.
-
1. INTRODUCTION
Making Data-Driven Decisions to Grow Your Business
- REPORT DESCRIPTION
- RESEARCH METHODOLOGY AND AI PLATFORM
- DATA-DRIVEN DECISIONS FOR YOUR BUSINESS
- GLOSSARY AND SPECIFIC TERMS
-
2. EXECUTIVE SUMMARY
A Quick Overview of Market Performance
- KEY FINDINGS
- MARKET TRENDS This Chapter is Available Only for the Professional Edition PRO
-
3. MARKET OVERVIEW
Understanding the Current State of The Market and Its Prospects
- MARKET SIZE
- MARKET STRUCTURE
- TRADE BALANCE
- PER CAPITA CONSUMPTION
- MARKET FORECAST TO 2030
-
4. MOST PROMISING PRODUCT
Finding New Products to Diversify Your Business
This Chapter is Available Only for the Professional Edition PRO- TOP PRODUCTS TO DIVERSIFY YOUR BUSINESS
- BEST-SELLING PRODUCTS
- MOST CONSUMED PRODUCT
- MOST TRADED PRODUCT
- MOST PROFITABLE PRODUCT FOR EXPORT
-
5. MOST PROMISING SUPPLYING COUNTRIES
Choosing the Best Countries to Establish Your Sustainable Supply Chain
This Chapter is Available Only for the Professional Edition PRO- TOP COUNTRIES TO SOURCE YOUR PRODUCT
- TOP PRODUCING COUNTRIES
- TOP EXPORTING COUNTRIES
- LOW-COST EXPORTING COUNTRIES
-
6. MOST PROMISING OVERSEAS MARKETS
Choosing the Best Countries to Boost Your Exports
This Chapter is Available Only for the Professional Edition PRO- TOP OVERSEAS MARKETS FOR EXPORTING YOUR PRODUCT
- TOP CONSUMING MARKETS
- UNSATURATED MARKETS
- TOP IMPORTING MARKETS
- MOST PROFITABLE MARKETS
7. PRODUCTION
The Latest Trends and Insights into The Industry
- PRODUCTION VOLUME AND VALUE
8. IMPORTS
The Largest Import Supplying Countries
- IMPORTS FROM 2012–2023
- IMPORTS BY COUNTRY
- IMPORT PRICES BY COUNTRY
9. EXPORTS
The Largest Destinations for Exports
- EXPORTS FROM 2012–2023
- EXPORTS BY COUNTRY
- EXPORT PRICES BY COUNTRY
-
10. PROFILES OF MAJOR PRODUCERS
The Largest Producers on The Market and Their Profiles
This Chapter is Available Only for the Professional Edition PRO -
LIST OF TABLES
- Key Findings In 2023
- Market Volume, In Physical Terms, 2012–2023
- Market Value, 2012–2023
- Per Capita Consumption In 2012-2023
- Imports, In Physical Terms, By Country, 2012–2023
- Imports, In Value Terms, By Country, 2012–2023
- Import Prices, By Country Of Origin, 2012–2023
- Exports, In Physical Terms, By Country, 2012–2023
- Exports, In Value Terms, By Country, 2012–2023
- Export Prices, By Country Of Destination, 2012–2023
-
LIST OF FIGURES
- Market Volume, In Physical Terms, 2012–2023
- Market Value, 2012–2023
- Market Structure – Domestic Supply vs. Imports, In Physical Terms, 2012-2023
- Market Structure – Domestic Supply vs. Imports, In Value Terms, 2012-2023
- Trade Balance, In Physical Terms, 2012-2023
- Trade Balance, In Value Terms, 2012-2023
- Per Capita Consumption, 2012-2023
- Market Volume Forecast to 2030
- Market Value Forecast to 2030
- Products: Market Size And Growth, By Type
- Products: Average Per Capita Consumption, By Type
- Products: Exports And Growth, By Type
- Products: Export Prices And Growth, By Type
- Production Volume And Growth
- Exports And Growth
- Export Prices And Growth
- Market Size And Growth
- Per Capita Consumption
- Imports And Growth
- Import Prices
- Production, In Physical Terms, 2012–2023
- Production, In Value Terms, 2012–2023
- Imports, In Physical Terms, 2012–2023
- Imports, In Value Terms, 2012–2023
- Imports, In Physical Terms, By Country, 2023
- Imports, In Physical Terms, By Country, 2012–2023
- Imports, In Value Terms, By Country, 2012–2023
- Import Prices, By Country Of Origin, 2012–2023
- Exports, In Physical Terms, 2012–2023
- Exports, In Value Terms, 2012–2023
- Exports, In Physical Terms, By Country, 2023
- Exports, In Physical Terms, By Country, 2012–2023
- Exports, In Value Terms, By Country, 2012–2023
- Export Prices, By Country Of Destination, 2012–2023


