
Turkey - Expansible Polystyrene In Primary Forms - Market Analysis, Forecast, Size, Trends And Insights
Get instant access to more than 2 million reports, dashboards, and datasets on the IndexBox Platform.
View PricingTurkey's Expansible Polystyrene Export Declines by 34%, Falling to $213M in 2023
Turkey Expansible Polystyrene Exports
In 2023, overseas shipments of expansible polystyrene in primary forms decreased by -7.4% to 136K tons, falling for the second consecutive year after five years of growth. Overall, exports, however, enjoyed a significant expansion. The most prominent rate of growth was recorded in 2018 with an increase of 125%. Over the period under review, the exports hit record highs at 153K tons in 2021; however, from 2022 to 2023, the exports stood at a somewhat lower figure.
In value terms, expansible polystyrene exports fell rapidly to $213M (IndexBox estimates) in 2023. Over the period under review, exports, however, recorded a significant increase. The growth pace was the most rapid in 2021 with an increase of 177%. The exports peaked at $323M in 2022, and then reduced dramatically in the following year.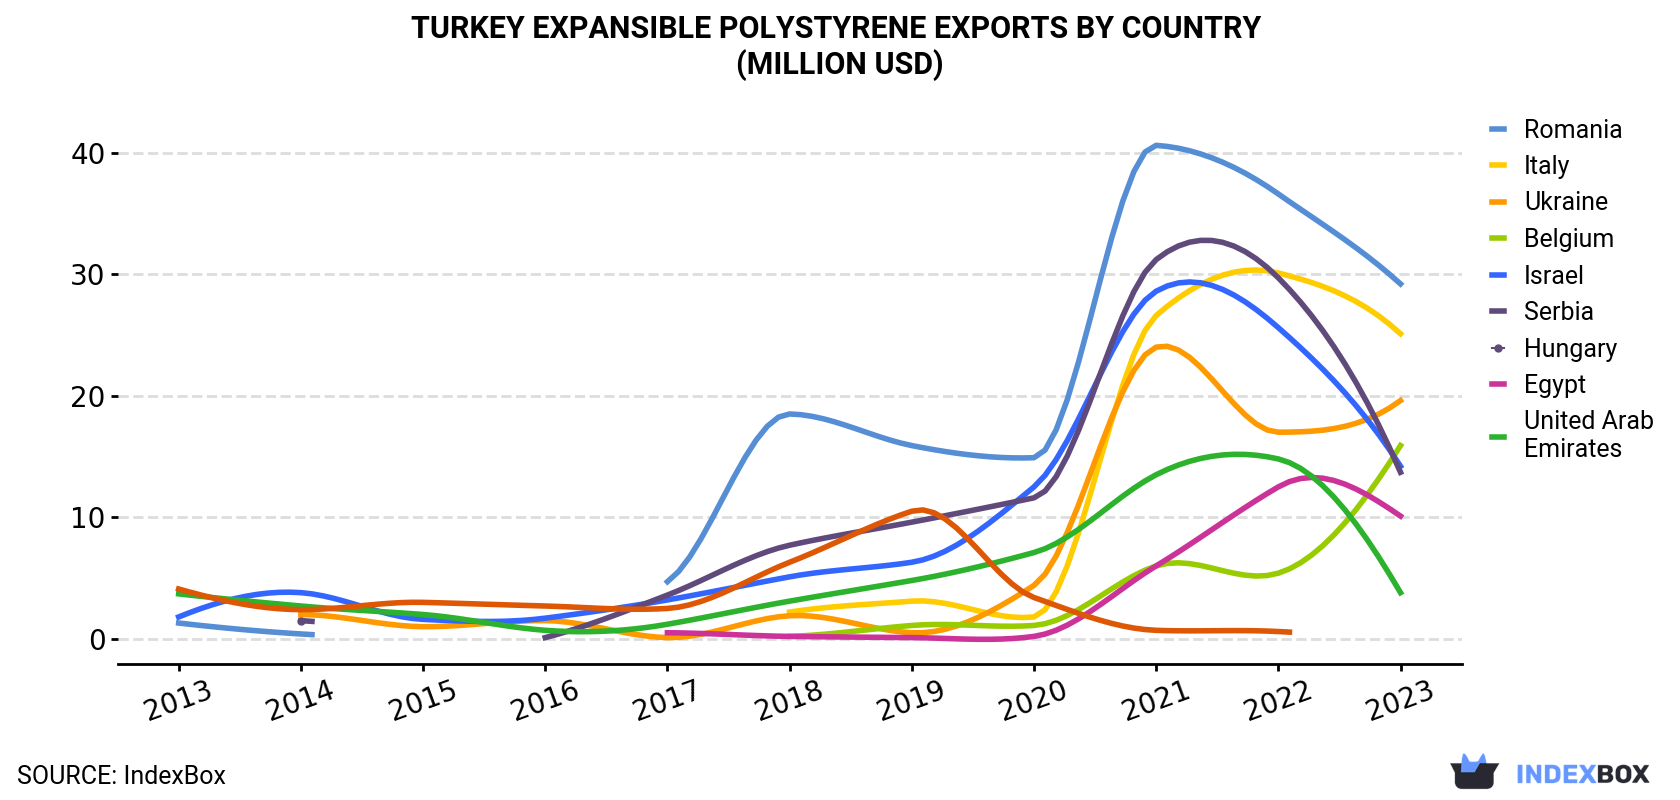
| COUNTRY | Export Value of Expansible Polystyrene in Turkey (million USD) | ||||||||||
|---|---|---|---|---|---|---|---|---|---|---|---|
| 2013 | 2014 | 2015 | 2016 | 2017 | 2018 | 2019 | 2020 | 2021 | 2022 | 2023 | |
| Romania | 1.3 | 0.4 | N/A | N/A | 4.7 | 18.5 | 15.9 | 14.9 | 40.6 | 36.6 | 29.2 |
| Italy | N/A | N/A | N/A | N/A | N/A | 2.2 | 3.1 | 1.8 | 26.6 | 30.1 | 25.1 |
| Ukraine | N/A | 2.0 | 1.0 | 1.5 | 0.1 | 1.9 | 0.5 | 4.4 | 24.0 | 17.0 | 19.6 |
| Belgium | N/A | N/A | N/A | N/A | N/A | 0.2 | 1.1 | 1.1 | 6.0 | 5.4 | 15.9 |
| Israel | 1.8 | 3.8 | 1.6 | 1.7 | 3.2 | 5.1 | 6.3 | 12.5 | 28.6 | 25.6 | 14.2 |
| Serbia | N/A | 1.5 | N/A | 0.1 | 3.6 | 7.7 | 9.6 | 11.6 | 31.2 | 29.7 | 13.7 |
| Hungary | N/A | N/A | N/A | N/A | 0.5 | 0.2 | 0.1 | 0.2 | 6.0 | 12.5 | 10.1 |
| Egypt | 3.7 | 2.7 | 2.0 | 0.7 | 1.2 | 3.1 | 4.8 | 7.1 | 13.5 | 14.8 | 3.8 |
| United Arab Emirates | 4.1 | 2.4 | 3.0 | 2.7 | 2.5 | 6.3 | 10.5 | 3.4 | 0.7 | 0.6 | N/A |
| Others | 22.5 | 14.0 | 18.2 | 10.3 | 13.9 | 23.1 | 39.5 | 48.5 | 115 | 150 | 81.4 |
| Total | 33.4 | 26.8 | 25.9 | 17.0 | 29.7 | 68.3 | 91.3 | 106 | 292 | 323 | 213 |
Exports by Country
Romania (19K tons), Italy (15K tons) and Ukraine (13K tons) were the main destinations of expansible polystyrene exports from Turkey, together accounting for 34% of total exports. Belgium, Israel, Serbia, Hungary, Egypt and the United Arab Emirates lagged somewhat behind, together accounting for a further 28%.
From 2013 to 2023, the biggest increases were recorded for Belgium (with a CAGR of +138.9%), while shipments for the other leaders experienced more modest paces of growth.
In value terms, the largest markets for expansible polystyrene exported from Turkey were Romania ($29M), Italy ($25M) and Ukraine ($20M), with a combined 35% share of total exports. Belgium, Israel, Serbia, Hungary, Egypt and the United Arab Emirates lagged somewhat behind, together comprising a further 27%.
In terms of the main countries of destination, Belgium, with a CAGR of +134.9%, recorded the highest growth rate of the value of exports, over the period under review, while shipments for the other leaders experienced more modest paces of growth.
Export Prices by Country
In 2023, the expansible polystyrene price stood at $1,569 per ton (FOB, Turkey), waning by -28.6% against the previous year. Over the period under review, the export price showed a perceptible decline. The pace of growth appeared the most rapid in 2021 when the average export price increased by 85%. Over the period under review, the average export prices reached the maximum at $2,198 per ton in 2022, and then declined dramatically in the following year.
Average prices varied noticeably for the major overseas markets. In 2023, amid the top suppliers, the highest price was recorded for prices to Austria ($1,779 per ton) and Italy ($1,670 per ton), while the average price for exports to Israel ($1,469 per ton) and Ukraine ($1,505 per ton) were amongst the lowest.
From 2013 to 2023, the most notable rate of growth in terms of prices was recorded for supplies to Bosnia and Herzegovina (+4.3%), while the prices for the other major destinations experienced mixed trend patterns.
This report provides an in-depth analysis of the expansible polystyrene market in Turkey. Within it, you will discover the latest data on market trends and opportunities by country, consumption, production and price developments, as well as the global trade (imports and exports). The forecast exhibits the market prospects through 2030.
Product coverage:
- Prodcom 20162035 - Expansible polystyrene, in primary forms
Country coverage:
- Turkey
Data coverage:
- Market volume and value
- Per Capita consumption
- Forecast of the market dynamics in the medium term
- Trade (exports and imports) in Turkey
- Export and import prices
- Market trends, drivers and restraints
- Key market players and their profiles
Reasons to buy this report:
- Take advantage of the latest data
- Find deeper insights into current market developments
- Discover vital success factors affecting the market
This report is designed for manufacturers, distributors, importers, and wholesalers, as well as for investors, consultants and advisors.
In this report, you can find information that helps you to make informed decisions on the following issues:
- How to diversify your business and benefit from new market opportunities
- How to load your idle production capacity
- How to boost your sales on overseas markets
- How to increase your profit margins
- How to make your supply chain more sustainable
- How to reduce your production and supply chain costs
- How to outsource production to other countries
- How to prepare your business for global expansion
While doing this research, we combine the accumulated expertise of our analysts and the capabilities of artificial intelligence. The AI-based platform, developed by our data scientists, constitutes the key working tool for business analysts, empowering them to discover deep insights and ideas from the marketing data.
-
1. INTRODUCTION
Making Data-Driven Decisions to Grow Your Business
- REPORT DESCRIPTION
- RESEARCH METHODOLOGY AND AI PLATFORM
- DATA-DRIVEN DECISIONS FOR YOUR BUSINESS
- GLOSSARY AND SPECIFIC TERMS
-
2. EXECUTIVE SUMMARY
A Quick Overview of Market Performance
- KEY FINDINGS
- MARKET TRENDS This Chapter is Available Only for the Professional Edition PRO
-
3. MARKET OVERVIEW
Understanding the Current State of The Market and Its Prospects
- MARKET SIZE
- MARKET STRUCTURE
- TRADE BALANCE
- PER CAPITA CONSUMPTION
- MARKET FORECAST TO 2030
-
4. MOST PROMISING PRODUCT
Finding New Products to Diversify Your Business
This Chapter is Available Only for the Professional Edition PRO- TOP PRODUCTS TO DIVERSIFY YOUR BUSINESS
- BEST-SELLING PRODUCTS
- MOST CONSUMED PRODUCT
- MOST TRADED PRODUCT
- MOST PROFITABLE PRODUCT FOR EXPORT
-
5. MOST PROMISING SUPPLYING COUNTRIES
Choosing the Best Countries to Establish Your Sustainable Supply Chain
This Chapter is Available Only for the Professional Edition PRO- TOP COUNTRIES TO SOURCE YOUR PRODUCT
- TOP PRODUCING COUNTRIES
- TOP EXPORTING COUNTRIES
- LOW-COST EXPORTING COUNTRIES
-
6. MOST PROMISING OVERSEAS MARKETS
Choosing the Best Countries to Boost Your Exports
This Chapter is Available Only for the Professional Edition PRO- TOP OVERSEAS MARKETS FOR EXPORTING YOUR PRODUCT
- TOP CONSUMING MARKETS
- UNSATURATED MARKETS
- TOP IMPORTING MARKETS
- MOST PROFITABLE MARKETS
7. PRODUCTION
The Latest Trends and Insights into The Industry
- PRODUCTION VOLUME AND VALUE
8. IMPORTS
The Largest Import Supplying Countries
- IMPORTS FROM 2012–2023
- IMPORTS BY COUNTRY
- IMPORT PRICES BY COUNTRY
9. EXPORTS
The Largest Destinations for Exports
- EXPORTS FROM 2012–2023
- EXPORTS BY COUNTRY
- EXPORT PRICES BY COUNTRY
-
10. PROFILES OF MAJOR PRODUCERS
The Largest Producers on The Market and Their Profiles
This Chapter is Available Only for the Professional Edition PRO -
LIST OF TABLES
- Key Findings In 2023
- Market Volume, In Physical Terms, 2012–2023
- Market Value, 2012–2023
- Per Capita Consumption In 2012-2023
- Imports, In Physical Terms, By Country, 2012–2023
- Imports, In Value Terms, By Country, 2012–2023
- Import Prices, By Country Of Origin, 2012–2023
- Exports, In Physical Terms, By Country, 2012–2023
- Exports, In Value Terms, By Country, 2012–2023
- Export Prices, By Country Of Destination, 2012–2023
-
LIST OF FIGURES
- Market Volume, In Physical Terms, 2012–2023
- Market Value, 2012–2023
- Market Structure – Domestic Supply vs. Imports, In Physical Terms, 2012-2023
- Market Structure – Domestic Supply vs. Imports, In Value Terms, 2012-2023
- Trade Balance, In Physical Terms, 2012-2023
- Trade Balance, In Value Terms, 2012-2023
- Per Capita Consumption, 2012-2023
- Market Volume Forecast to 2030
- Market Value Forecast to 2030
- Products: Market Size And Growth, By Type
- Products: Average Per Capita Consumption, By Type
- Products: Exports And Growth, By Type
- Products: Export Prices And Growth, By Type
- Production Volume And Growth
- Exports And Growth
- Export Prices And Growth
- Market Size And Growth
- Per Capita Consumption
- Imports And Growth
- Import Prices
- Production, In Physical Terms, 2012–2023
- Production, In Value Terms, 2012–2023
- Imports, In Physical Terms, 2012–2023
- Imports, In Value Terms, 2012–2023
- Imports, In Physical Terms, By Country, 2023
- Imports, In Physical Terms, By Country, 2012–2023
- Imports, In Value Terms, By Country, 2012–2023
- Import Prices, By Country Of Origin, 2012–2023
- Exports, In Physical Terms, 2012–2023
- Exports, In Value Terms, 2012–2023
- Exports, In Physical Terms, By Country, 2023
- Exports, In Physical Terms, By Country, 2012–2023
- Exports, In Value Terms, By Country, 2012–2023
- Export Prices, By Country Of Destination, 2012–2023


