
Turkey - Refrigerators And Freezers - Market Analysis, Forecast, Size, Trends and Insights
Get instant access to more than 2 million reports, dashboards, and datasets on the IndexBox Platform.
View PricingTurkey's Refrigerator and Freezer Exports Drop to $3.1 Billion in 2023
Turkey Refrigerator and Freezer Exports
In 2023, overseas shipments of refrigerators and freezers decreased by -14% to 13M units, falling for the second consecutive year after six years of growth. The total export volume increased at an average annual rate of +1.1% over the period from 2013 to 2023; however, the trend pattern indicated some noticeable fluctuations being recorded in certain years. The most prominent rate of growth was recorded in 2021 when exports increased by 16%. As a result, the exports attained the peak of 15M units. From 2022 to 2023, the growth of the exports failed to regain momentum.
In value terms, refrigerator and freezer exports shrank to $3.1B (IndexBox estimates) in 2023. Over the period under review, exports, however, saw a relatively flat trend pattern. The pace of growth appeared the most rapid in 2021 with an increase of 33% against the previous year. As a result, the exports attained the peak of $3.5B. From 2022 to 2023, the growth of the exports failed to regain momentum.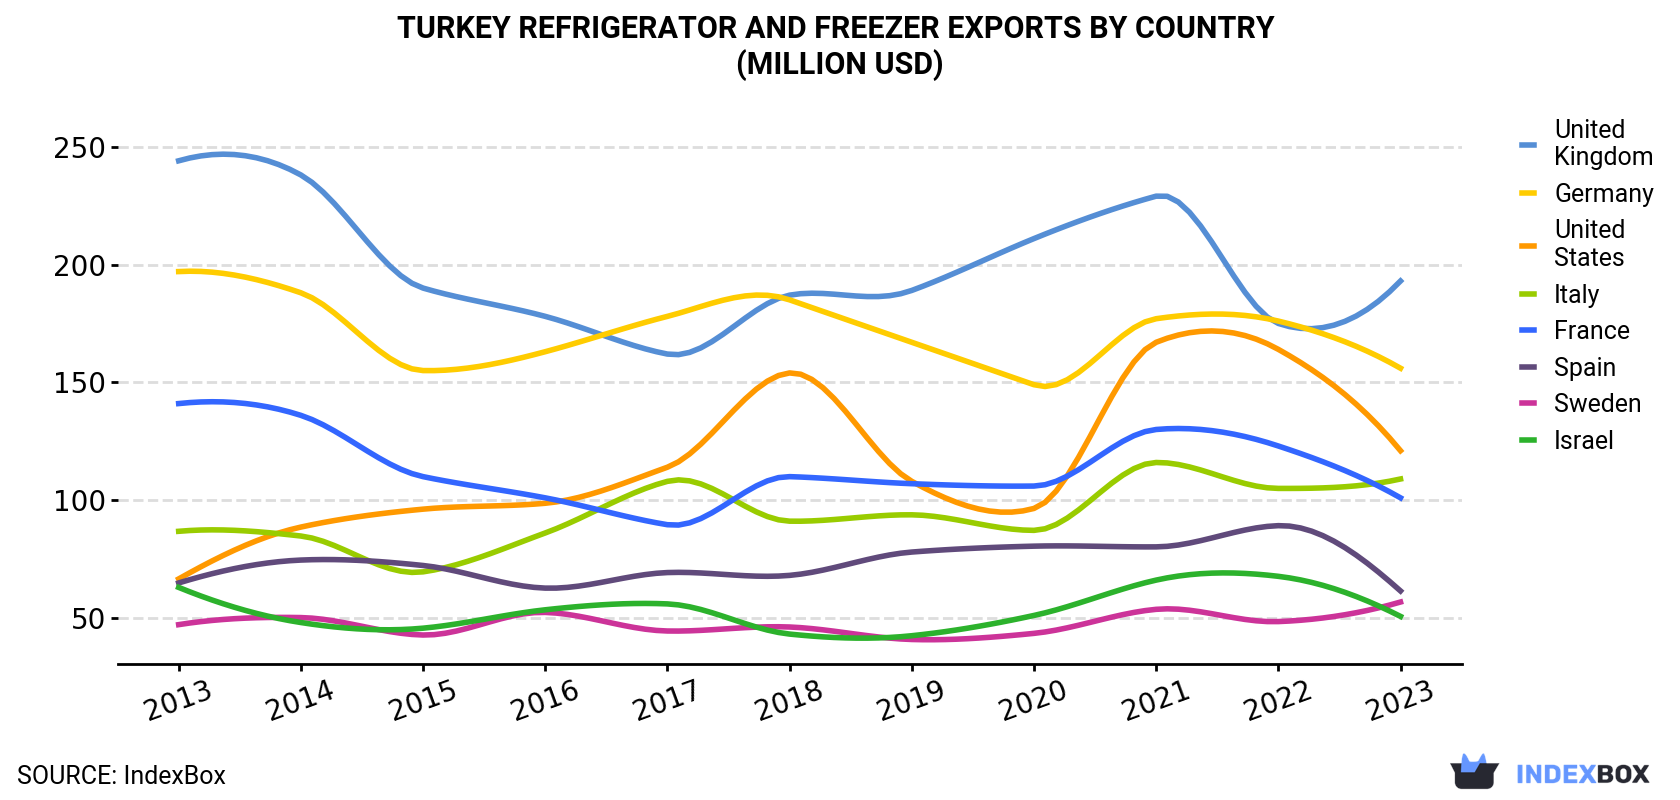
| COUNTRY | Export Value of Refrigerator and Freezer in Turkey (million USD) | ||||||||||
|---|---|---|---|---|---|---|---|---|---|---|---|
| 2013 | 2014 | 2015 | 2016 | 2017 | 2018 | 2019 | 2020 | 2021 | 2022 | 2023 | |
| United Kingdom | 244 | 238 | 190 | 178 | 162 | 187 | 189 | 211 | 229 | 175 | 193 |
| Germany | 197 | 188 | 155 | 163 | 178 | 185 | 167 | 149 | 177 | 176 | 156 |
| United States | 66.6 | 88.6 | 96.2 | 98.7 | 114 | 154 | 108 | 96.5 | 167 | 164 | 121 |
| Italy | 86.8 | 84.8 | 69.6 | 86.1 | 108 | 91.1 | 93.8 | 87.2 | 116 | 105 | 109 |
| France | 141 | 136 | 110 | 101 | 89.6 | 110 | 107 | 106 | 130 | 123 | 101 |
| Spain | 64.9 | 74.6 | 72.3 | 62.7 | 69.3 | 68.1 | 78.0 | 80.5 | 80.2 | 89.2 | 61.5 |
| Sweden | 47.2 | 50.2 | 42.8 | 52.4 | 44.5 | 46.2 | 40.9 | 43.5 | 53.7 | 48.5 | 56.8 |
| Israel | 63.0 | 48.1 | 45.7 | 53.5 | 56.0 | 43.2 | 42.5 | 51.1 | 66.1 | 67.7 | 50.7 |
| Others | 2,018 | 1,982 | 1,707 | 1,815 | 1,857 | 2,005 | 1,899 | 1,838 | 2,520 | 2,444 | 2,268 |
| Total | 2,928 | 2,890 | 2,489 | 2,611 | 2,679 | 2,890 | 2,725 | 2,663 | 3,539 | 3,394 | 3,118 |
Exports by Country
the UK (979K units), Germany (595K units) and Italy (511K units) were the main destinations of refrigerator and freezer exports from Turkey, with a combined 16% share of total exports. France, Spain, Sweden, Israel and the United States lagged somewhat behind, together comprising a further 10%.
From 2013 to 2023, the biggest increases were recorded for the United States (with a CAGR of +10.3%), while shipments for the other leaders experienced more modest paces of growth.
In value terms, the largest markets for refrigerator and freezer exported from Turkey were the UK ($193M), Germany ($156M) and the United States ($121M), with a combined 15% share of total exports.
the United States, with a CAGR of +6.1%, recorded the highest rates of growth with regard to the value of exports, among the main countries of destination over the period under review, while shipments for the other leaders experienced more modest paces of growth.
Exports by Type
Combined refrigerators-freezers (7.8M units) and household refrigerators and freezers (not combined) (5.1M units) were the main products of refrigerator and freezer exports from Turkey.
From 2013 to 2023, the most notable rate of growth in terms of shipments, amongst the major product types, was attained by combined refrigerators-freezers (with a CAGR of +3.3%).
In value terms, refrigerators and freezers with the largest exports in Turkey were combined refrigerators-freezers ($2B) and household refrigerators and freezers (not combined) ($1.1B).
Combined refrigerators-freezers, with a CAGR of +1.6%, recorded the highest growth rate of the value of exports, among the main product categories over the period under review.
Export Prices by Country
In 2023, the refrigerator and freezer price stood at $242 per unit (FOB, Turkey), surging by 6.8% against the previous year. In general, the export price, however, saw a relatively flat trend pattern. The most prominent rate of growth was recorded in 2021 when the average export price increased by 14%. Over the period under review, the average export prices hit record highs at $261 per unit in 2014; however, from 2015 to 2023, the export prices stood at a somewhat lower figure.
There were significant differences in the average prices for the major export markets. In 2023, amid the top suppliers, the country with the highest price was Egypt ($319 per unit), while the average price for exports to Poland ($187 per unit) was amongst the lowest.
From 2013 to 2023, the most notable rate of growth in terms of prices was recorded for supplies to Egypt (+2.3%), while the prices for the other major destinations experienced more modest paces of growth.
This report provides an in-depth analysis of the refrigerator and freezer market in Turkey. Within it, you will discover the latest data on market trends and opportunities by country, consumption, production and price developments, as well as the global trade (imports and exports). The forecast exhibits the market prospects through 2030.
Product coverage:
- Prodcom 27511110 - Combined refrigerators-freezers, with separate external doors
- Prodcom 27511133 - Household-type refrigerators (including compression-type, e lectrical absorption-type) (excluding built-in)
- Prodcom 27511135 - Compression-type built-in refrigerators
- Prodcom 27511150 - Chest freezers of a capacity . .800 litres
- Prodcom 27511170 - Upright freezers of a capacity . .900 litres
Country coverage:
- Turkey
Data coverage:
- Market volume and value
- Per Capita consumption
- Forecast of the market dynamics in the medium term
- Trade (exports and imports) in Turkey
- Export and import prices
- Market trends, drivers and restraints
- Key market players and their profiles
Reasons to buy this report:
- Take advantage of the latest data
- Find deeper insights into current market developments
- Discover vital success factors affecting the market
This report is designed for manufacturers, distributors, importers, and wholesalers, as well as for investors, consultants and advisors.
In this report, you can find information that helps you to make informed decisions on the following issues:
- How to diversify your business and benefit from new market opportunities
- How to load your idle production capacity
- How to boost your sales on overseas markets
- How to increase your profit margins
- How to make your supply chain more sustainable
- How to reduce your production and supply chain costs
- How to outsource production to other countries
- How to prepare your business for global expansion
While doing this research, we combine the accumulated expertise of our analysts and the capabilities of artificial intelligence. The AI-based platform, developed by our data scientists, constitutes the key working tool for business analysts, empowering them to discover deep insights and ideas from the marketing data.
-
1. INTRODUCTION
Making Data-Driven Decisions to Grow Your Business
- REPORT DESCRIPTION
- RESEARCH METHODOLOGY AND AI PLATFORM
- DATA-DRIVEN DECISIONS FOR YOUR BUSINESS
- GLOSSARY AND SPECIFIC TERMS
-
2. EXECUTIVE SUMMARY
A Quick Overview of Market Performance
- KEY FINDINGS
- MARKET TRENDS This Chapter is Available Only for the Professional Edition PRO
-
3. MARKET OVERVIEW
Understanding the Current State of The Market and Its Prospects
- MARKET SIZE
- MARKET STRUCTURE
- TRADE BALANCE
- PER CAPITA CONSUMPTION
- MARKET FORECAST TO 2030
-
4. MOST PROMISING PRODUCT
Finding New Products to Diversify Your Business
This Chapter is Available Only for the Professional Edition PRO- TOP PRODUCTS TO DIVERSIFY YOUR BUSINESS
- BEST-SELLING PRODUCTS
- MOST CONSUMED PRODUCT
- MOST TRADED PRODUCT
- MOST PROFITABLE PRODUCT FOR EXPORT
-
5. MOST PROMISING SUPPLYING COUNTRIES
Choosing the Best Countries to Establish Your Sustainable Supply Chain
This Chapter is Available Only for the Professional Edition PRO- TOP COUNTRIES TO SOURCE YOUR PRODUCT
- TOP PRODUCING COUNTRIES
- TOP EXPORTING COUNTRIES
- LOW-COST EXPORTING COUNTRIES
-
6. MOST PROMISING OVERSEAS MARKETS
Choosing the Best Countries to Boost Your Exports
This Chapter is Available Only for the Professional Edition PRO- TOP OVERSEAS MARKETS FOR EXPORTING YOUR PRODUCT
- TOP CONSUMING MARKETS
- UNSATURATED MARKETS
- TOP IMPORTING MARKETS
- MOST PROFITABLE MARKETS
7. PRODUCTION
The Latest Trends and Insights into The Industry
- PRODUCTION VOLUME AND VALUE
8. IMPORTS
The Largest Import Supplying Countries
- IMPORTS FROM 2012–2023
- IMPORTS BY COUNTRY
- IMPORT PRICES BY COUNTRY
9. EXPORTS
The Largest Destinations for Exports
- EXPORTS FROM 2012–2023
- EXPORTS BY COUNTRY
- EXPORT PRICES BY COUNTRY
-
10. PROFILES OF MAJOR PRODUCERS
The Largest Producers on The Market and Their Profiles
This Chapter is Available Only for the Professional Edition PRO -
LIST OF TABLES
- Key Findings In 2023
- Market Volume, In Physical Terms, 2012–2023
- Market Value, 2012–2023
- Per Capita Consumption In 2012-2023
- Imports, In Physical Terms, By Country, 2012–2023
- Imports, In Value Terms, By Country, 2012–2023
- Import Prices, By Country Of Origin, 2012–2023
- Exports, In Physical Terms, By Country, 2012–2023
- Exports, In Value Terms, By Country, 2012–2023
- Export Prices, By Country Of Destination, 2012–2023
-
LIST OF FIGURES
- Market Volume, In Physical Terms, 2012–2023
- Market Value, 2012–2023
- Market Structure – Domestic Supply vs. Imports, In Physical Terms, 2012-2023
- Market Structure – Domestic Supply vs. Imports, In Value Terms, 2012-2023
- Trade Balance, In Physical Terms, 2012-2023
- Trade Balance, In Value Terms, 2012-2023
- Per Capita Consumption, 2012-2023
- Market Volume Forecast to 2030
- Market Value Forecast to 2030
- Products: Market Size And Growth, By Type
- Products: Average Per Capita Consumption, By Type
- Products: Exports And Growth, By Type
- Products: Export Prices And Growth, By Type
- Production Volume And Growth
- Exports And Growth
- Export Prices And Growth
- Market Size And Growth
- Per Capita Consumption
- Imports And Growth
- Import Prices
- Production, In Physical Terms, 2012–2023
- Production, In Value Terms, 2012–2023
- Imports, In Physical Terms, 2012–2023
- Imports, In Value Terms, 2012–2023
- Imports, In Physical Terms, By Country, 2023
- Imports, In Physical Terms, By Country, 2012–2023
- Imports, In Value Terms, By Country, 2012–2023
- Import Prices, By Country Of Origin, 2012–2023
- Exports, In Physical Terms, 2012–2023
- Exports, In Value Terms, 2012–2023
- Exports, In Physical Terms, By Country, 2023
- Exports, In Physical Terms, By Country, 2012–2023
- Exports, In Value Terms, By Country, 2012–2023
- Export Prices, By Country Of Destination, 2012–2023


