United Kingdom - Tanks, Casks, Drums, Cans, Boxes And Similar Containers - Market Analysis, Forecast, Size, Trends and Insights
Get instant access to more than 2 million reports, dashboards, and datasets on the IndexBox Platform.
View PricingImports of Containers in the UK Drop by 14% to $47M in December 2023
United Kingdom Container Imports
In December 2023, the amount of tanks, casks, drums, cans, boxes and similar containers imported into the UK reduced to 150M units, dropping by -14.3% against the month before. In general, imports showed a mild reduction. The growth pace was the most rapid in March 2023 when imports increased by 40% against the previous month. Imports peaked at 247M units in June 2023; however, from July 2023 to December 2023, imports remained at a lower figure.
In value terms, container imports shrank to $47M (IndexBox estimates) in December 2023. Over the period under review, imports saw a relatively flat trend pattern. The pace of growth was the most pronounced in March 2023 with an increase of 32% against the previous month. Over the period under review, imports attained the peak figure at 81M units in August 2023; however, from September 2023 to December 2023, imports stood at a somewhat lower figure.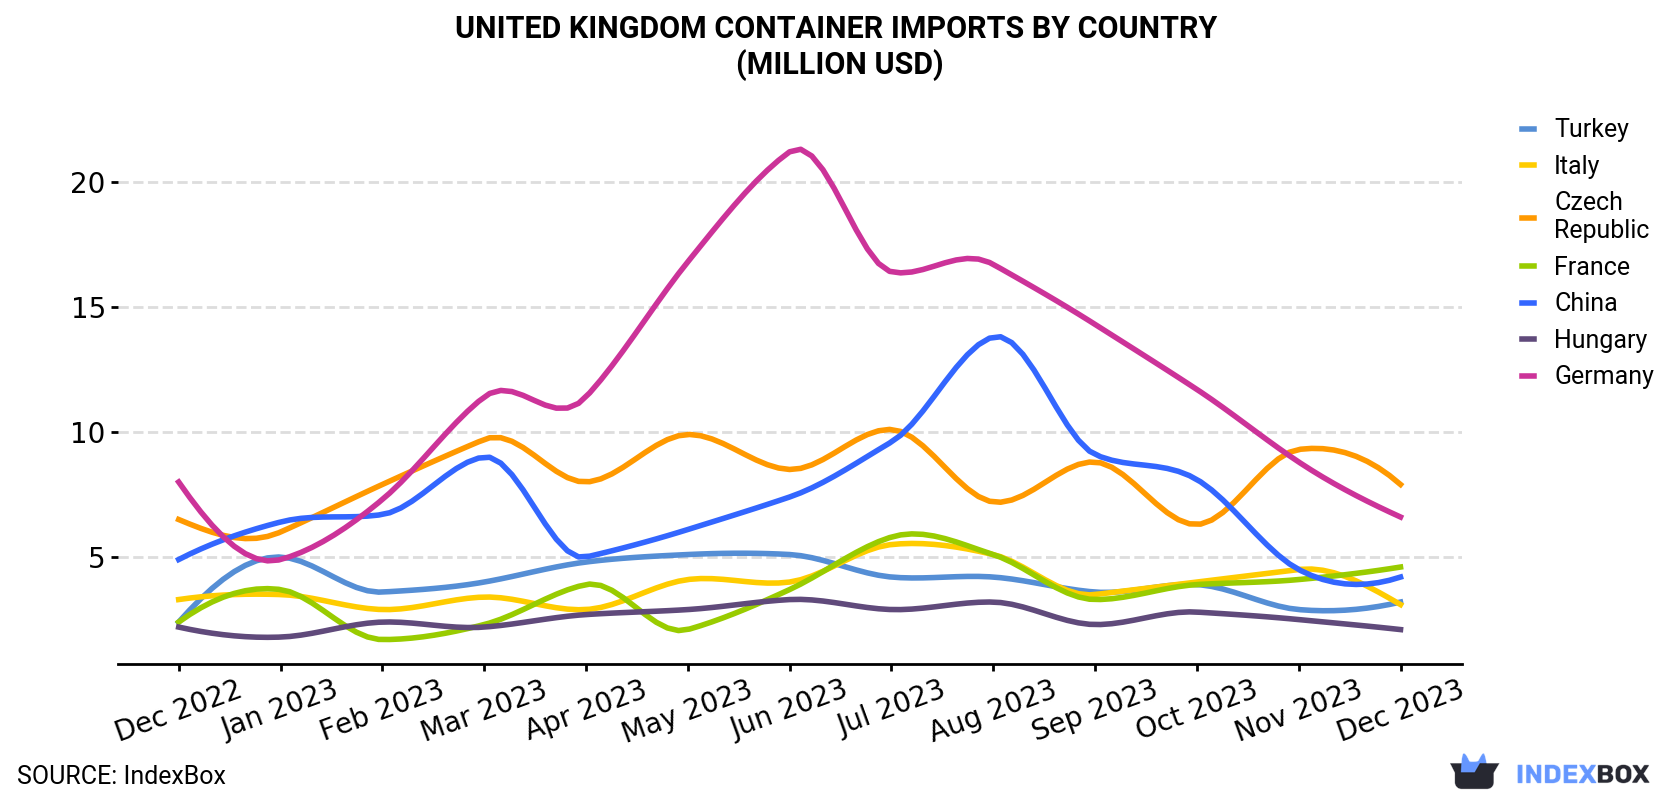
| COUNTRY | Import Value of Container in United Kingdom (million USD) | ||||||||||||
|---|---|---|---|---|---|---|---|---|---|---|---|---|---|
| Dec 2022 | Jan 2023 | Feb 2023 | Mar 2023 | Apr 2023 | May 2023 | Jun 2023 | Jul 2023 | Aug 2023 | Sep 2023 | Oct 2023 | Nov 2023 | Dec 2023 | |
| Czech Republic | 6.5 | 6.0 | 7.9 | 9.7 | 8.0 | 9.9 | 8.5 | 10.1 | 7.2 | 8.8 | 6.3 | 9.3 | 7.9 |
| Germany | 8.0 | 4.9 | 7.3 | 11.4 | 11.4 | 16.8 | 21.2 | 16.4 | 16.7 | 14.3 | 11.7 | 8.8 | 6.6 |
| France | 2.4 | 3.7 | 1.7 | 2.3 | 3.9 | 2.1 | 3.7 | 5.8 | 5.1 | 3.3 | 3.9 | 4.1 | 4.6 |
| China | 4.9 | 6.4 | 6.7 | 9.0 | 5.0 | 6.1 | 7.4 | 9.6 | 13.8 | 9.1 | 8.1 | 4.5 | 4.2 |
| Turkey | 2.4 | 5.0 | 3.6 | 4.0 | 4.8 | 5.1 | 5.1 | 4.2 | 4.2 | 3.6 | 3.9 | 2.9 | 3.2 |
| Italy | 3.3 | 3.5 | 2.9 | 3.4 | 2.9 | 4.1 | 4.0 | 5.5 | 5.1 | 3.5 | 4.0 | 4.5 | 3.1 |
| Hungary | 2.2 | 1.8 | 2.4 | 2.2 | 2.7 | 2.9 | 3.3 | 2.9 | 3.2 | 2.3 | 2.8 | 2.5 | 2.1 |
| Others | 19.7 | 13.5 | 14.6 | 19.8 | 20.4 | 23.9 | 22.2 | 21.8 | 26.1 | 16.2 | 26.5 | 17.7 | 15.0 |
| Total | 49.3 | 44.8 | 47.0 | 61.8 | 59.3 | 70.9 | 75.4 | 76.3 | 81.4 | 61.2 | 67.1 | 54.2 | 46.7 |
Imports by Country
The Czech Republic (27M units), Germany (19M units) and Turkey (16M units) were the main suppliers of container imports to the UK, together comprising 41% of total imports. These countries were followed by China, France, Italy and Hungary, which together accounted for a further 31%.
From December 2022 to December 2023, the most notable rate of growth in terms of purchases, amongst the main suppliers, was attained by France (with a CAGR of +12.6%), while imports for the other leaders experienced more modest paces of growth.
In value terms, the largest container suppliers to the UK were the Czech Republic ($7.9M), Germany ($6.6M) and France ($4.6M), with a combined 41% share of total imports.
France, with a CAGR of +5.5%, saw the highest rates of growth with regard to the value of imports, among the main suppliers over the period under review, while purchases for the other leaders experienced more modest paces of growth.
Imports by Type
Aluminium casks, drums, cans, boxes etc (including rigid, collapsible tubular containers), for materials other than compressed, liquefied gas, 300l capacity or less, lined, heat-insulated or not (80M units) and tanks, casks, drums, cans, boxes and similar containers, for any material (excluding compressed or liquefied gas), of iron or steel, capacity not exceeding 300l, whether or not lined or heat-insulated (71M units) were the main products of container imports to the UK.
From December 2022 to December 2023, the most notable rate of growth in terms of purchases, amongst the major product types, was attained by tanks, casks, drums, cans, boxes and similar containers, for any material (excluding compressed or liquefied gas), of iron or steel, capacity not exceeding 300l, whether or not lined or heat-insulated (with a CAGR of +0.6%).
In value terms, tanks, casks, drums, cans, boxes and similar containers, for any material (excluding compressed or liquefied gas), of iron or steel, capacity not exceeding 300l, whether or not lined or heat-insulated ($24M) and aluminium casks, drums, cans, boxes etc (including rigid, collapsible tubular containers), for materials other than compressed, liquefied gas, 300l capacity or less, lined, heat-insulated or not ($23M) were the most imported types of tanks, casks, drums, cans, boxes and similar containers in the UK.
Import Prices by Country
In December 2023, the container price stood at $311 per thousand units (CIF, United Kingdom), remaining stable against the previous month. Over the period under review, the import price showed a relatively flat trend pattern. The most prominent rate of growth was recorded in April 2023 when the average import price increased by 8.6% m-o-m. The import price peaked at $341 per thousand units in August 2023; however, from September 2023 to December 2023, import prices stood at a somewhat lower figure.
There were significant differences in the average prices amongst the major supplying countries. In December 2023, the country with the highest price was Italy ($380 per thousand units), while the price for Turkey ($207 per thousand units) was amongst the lowest.
From December 2022 to December 2023, the most notable rate of growth in terms of prices was attained by Portugal (+3.1%), while the prices for the other major suppliers experienced more modest paces of growth.
This report provides an in-depth analysis of the container market in the UK. Within it, you will discover the latest data on market trends and opportunities by country, consumption, production and price developments, as well as the global trade (imports and exports). The forecast exhibits the market prospects through 2030.
Product coverage:
- Prodcom 25911100 - Tanks, casks, drums, cans... (excluding for gas) of iron or steel, . .50 l, . .300 l
- Prodcom 25911200 - Tanks, casks, drums... (excluding for gas) of iron or steel, < .50 l
- Prodcom 25921133 - Cans used for preserving food and drink of iron or steel, < .50 l, food cans
- Prodcom 25921135 - Cans used for preserving food and drink of iron or steel, < .50 l, drinks
- Prodcom 25921150 - Cans other than for preserving food and drink of iron or steel, < .50 l
- Prodcom 25921210 - Aluminium collapsible tubular containers of a capacity . .300 litres, for any material except compressed or liquefied gas
- Prodcom 25921240 - Casks, drums, cans, boxes and similar containers, of aluminium, for any material (other than compressed or liquefied gas), n.e.s. (other than collapsible tubular containers and containers for aerosols)
- Prodcom 25921260 - Aluminium aerosol containers, with a capacity . .300 litres
Country coverage:
- United Kingdom
Data coverage:
- Market volume and value
- Per Capita consumption
- Forecast of the market dynamics in the medium term
- Trade (exports and imports) in the UK
- Export and import prices
- Market trends, drivers and restraints
- Key market players and their profiles
Reasons to buy this report:
- Take advantage of the latest data
- Find deeper insights into current market developments
- Discover vital success factors affecting the market
This report is designed for manufacturers, distributors, importers, and wholesalers, as well as for investors, consultants and advisors.
In this report, you can find information that helps you to make informed decisions on the following issues:
- How to diversify your business and benefit from new market opportunities
- How to load your idle production capacity
- How to boost your sales on overseas markets
- How to increase your profit margins
- How to make your supply chain more sustainable
- How to reduce your production and supply chain costs
- How to outsource production to other countries
- How to prepare your business for global expansion
While doing this research, we combine the accumulated expertise of our analysts and the capabilities of artificial intelligence. The AI-based platform, developed by our data scientists, constitutes the key working tool for business analysts, empowering them to discover deep insights and ideas from the marketing data.
-
1. INTRODUCTION
Making Data-Driven Decisions to Grow Your Business
- REPORT DESCRIPTION
- RESEARCH METHODOLOGY AND AI PLATFORM
- DATA-DRIVEN DECISIONS FOR YOUR BUSINESS
- GLOSSARY AND SPECIFIC TERMS
-
2. EXECUTIVE SUMMARY
A Quick Overview of Market Performance
- KEY FINDINGS
- MARKET TRENDS This Chapter is Available Only for the Professional Edition PRO
-
3. MARKET OVERVIEW
Understanding the Current State of The Market and Its Prospects
- MARKET SIZE
- MARKET STRUCTURE
- TRADE BALANCE
- PER CAPITA CONSUMPTION
- MARKET FORECAST TO 2030
-
4. MOST PROMISING PRODUCT
Finding New Products to Diversify Your Business
This Chapter is Available Only for the Professional Edition PRO- TOP PRODUCTS TO DIVERSIFY YOUR BUSINESS
- BEST-SELLING PRODUCTS
- MOST CONSUMED PRODUCT
- MOST TRADED PRODUCT
- MOST PROFITABLE PRODUCT FOR EXPORT
-
5. MOST PROMISING SUPPLYING COUNTRIES
Choosing the Best Countries to Establish Your Sustainable Supply Chain
This Chapter is Available Only for the Professional Edition PRO- TOP COUNTRIES TO SOURCE YOUR PRODUCT
- TOP PRODUCING COUNTRIES
- TOP EXPORTING COUNTRIES
- LOW-COST EXPORTING COUNTRIES
-
6. MOST PROMISING OVERSEAS MARKETS
Choosing the Best Countries to Boost Your Exports
This Chapter is Available Only for the Professional Edition PRO- TOP OVERSEAS MARKETS FOR EXPORTING YOUR PRODUCT
- TOP CONSUMING MARKETS
- UNSATURATED MARKETS
- TOP IMPORTING MARKETS
- MOST PROFITABLE MARKETS
7. PRODUCTION
The Latest Trends and Insights into The Industry
- PRODUCTION VOLUME AND VALUE
8. IMPORTS
The Largest Import Supplying Countries
- IMPORTS FROM 2012–2023
- IMPORTS BY COUNTRY
- IMPORT PRICES BY COUNTRY
9. EXPORTS
The Largest Destinations for Exports
- EXPORTS FROM 2012–2023
- EXPORTS BY COUNTRY
- EXPORT PRICES BY COUNTRY
-
10. PROFILES OF MAJOR PRODUCERS
The Largest Producers on The Market and Their Profiles
This Chapter is Available Only for the Professional Edition PRO -
LIST OF TABLES
- Key Findings In 2023
- Market Volume, In Physical Terms, 2012–2023
- Market Value, 2012–2023
- Per Capita Consumption In 2012-2023
- Imports, In Physical Terms, By Country, 2012–2023
- Imports, In Value Terms, By Country, 2012–2023
- Import Prices, By Country Of Origin, 2012–2023
- Exports, In Physical Terms, By Country, 2012–2023
- Exports, In Value Terms, By Country, 2012–2023
- Export Prices, By Country Of Destination, 2012–2023
-
LIST OF FIGURES
- Market Volume, In Physical Terms, 2012–2023
- Market Value, 2012–2023
- Market Structure – Domestic Supply vs. Imports, In Physical Terms, 2012-2023
- Market Structure – Domestic Supply vs. Imports, In Value Terms, 2012-2023
- Trade Balance, In Physical Terms, 2012-2023
- Trade Balance, In Value Terms, 2012-2023
- Per Capita Consumption, 2012-2023
- Market Volume Forecast to 2030
- Market Value Forecast to 2030
- Products: Market Size And Growth, By Type
- Products: Average Per Capita Consumption, By Type
- Products: Exports And Growth, By Type
- Products: Export Prices And Growth, By Type
- Production Volume And Growth
- Exports And Growth
- Export Prices And Growth
- Market Size And Growth
- Per Capita Consumption
- Imports And Growth
- Import Prices
- Production, In Physical Terms, 2012–2023
- Production, In Value Terms, 2012–2023
- Imports, In Physical Terms, 2012–2023
- Imports, In Value Terms, 2012–2023
- Imports, In Physical Terms, By Country, 2023
- Imports, In Physical Terms, By Country, 2012–2023
- Imports, In Value Terms, By Country, 2012–2023
- Import Prices, By Country Of Origin, 2012–2023
- Exports, In Physical Terms, 2012–2023
- Exports, In Value Terms, 2012–2023
- Exports, In Physical Terms, By Country, 2023
- Exports, In Physical Terms, By Country, 2012–2023
- Exports, In Value Terms, By Country, 2012–2023
- Export Prices, By Country Of Destination, 2012–2023


