
United Kingdom - Electronic Integrated Circuits and Microassemblies - Market Analysis, Forecast, Size, Trends and Insights
Get instant access to more than 2 million reports, dashboards, and datasets on the IndexBox Platform.
View PricingUK Sees Significant Drop in Electronic Chip Imports to $2.6B in 2023
United Kingdom Electronic Chip Imports
In 2023, after two years of growth, there was significant decline in purchases abroad of electronic chips, when their volume decreased by -16.6% to 513M units. In general, total imports indicated a mild expansion from 2013 to 2023: its volume increased at an average annual rate of +1.0% over the last decade. The trend pattern, however, indicated some noticeable fluctuations being recorded throughout the analyzed period. Based on 2023 figures, imports increased by +61.4% against 2020 indices. The most prominent rate of growth was recorded in 2021 with an increase of 51% against the previous year. Imports peaked at 616M units in 2022, and then declined notably in the following year.
In value terms, electronic chip imports declined to $2.6B (IndexBox estimates) in 2023. Over the period under review, total imports indicated a pronounced increase from 2013 to 2023: its value increased at an average annual rate of +4.5% over the last decade. The trend pattern, however, indicated some noticeable fluctuations being recorded throughout the analyzed period. Based on 2023 figures, imports increased by +49.7% against 2020 indices. The growth pace was the most rapid in 2021 with an increase of 49%. Imports peaked at $3B in 2022, and then declined in the following year.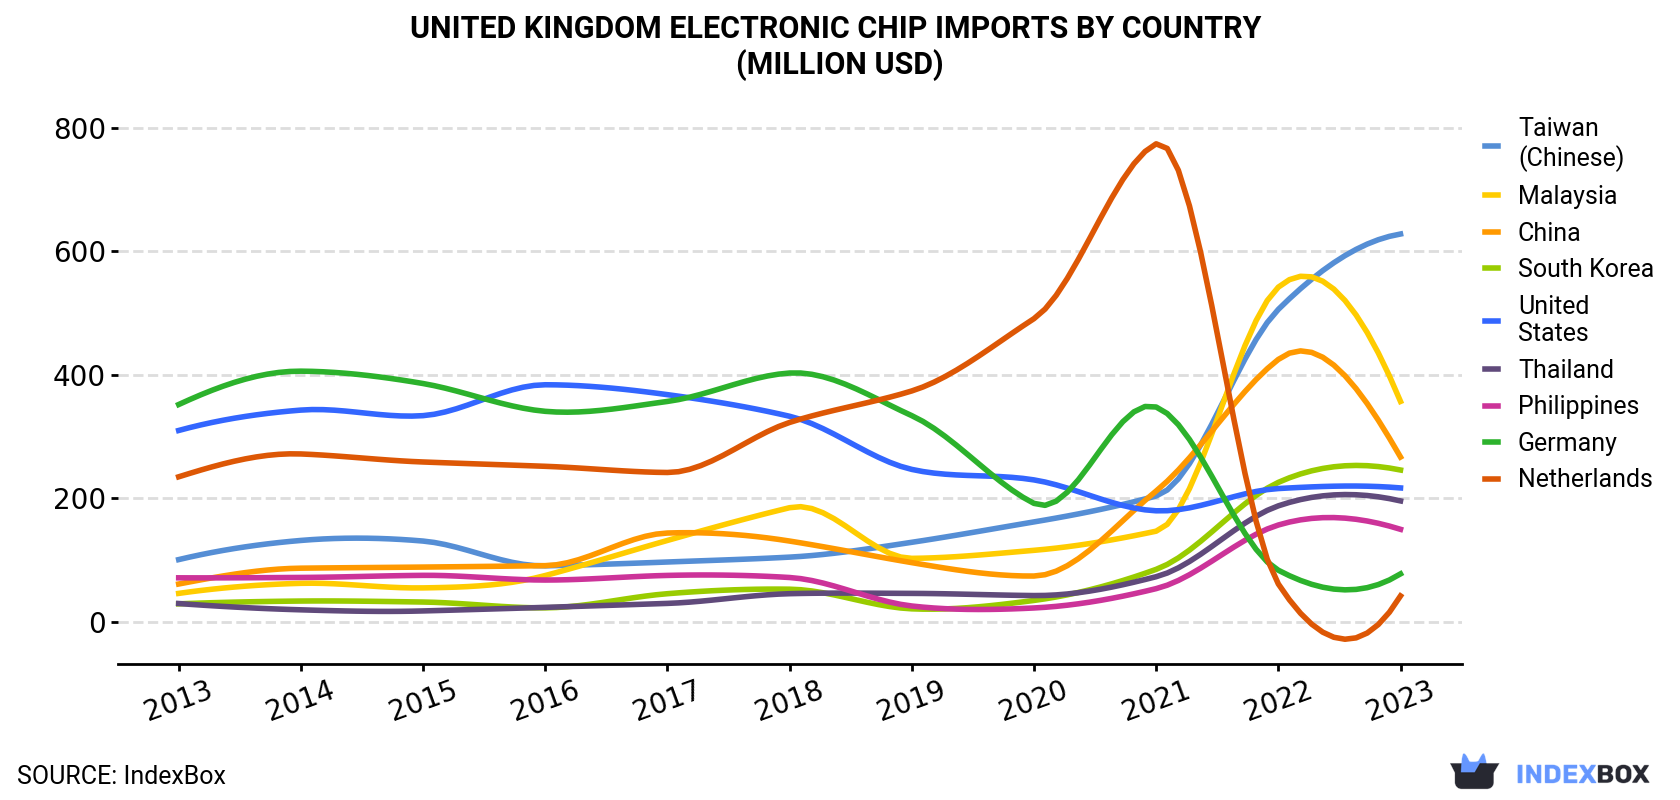
| COUNTRY | Import Value of Electronic Chip in United Kingdom (million USD) | ||||||||||
|---|---|---|---|---|---|---|---|---|---|---|---|
| 2013 | 2014 | 2015 | 2016 | 2017 | 2018 | 2019 | 2020 | 2021 | 2022 | 2023 | |
| Taiwan (Chinese) | 101 | 132 | 131 | 90.9 | 97.1 | 105 | 129 | 162 | 204 | 506 | 628 |
| Malaysia | 46.3 | 62.6 | 55.2 | 75.2 | 132 | 185 | 103 | 116 | 147 | 542 | 357 |
| China | 61.5 | 87.1 | 88.9 | 91.2 | 144 | 131 | 96.1 | 74.4 | 212 | 425 | 267 |
| South Korea | 29.4 | 33.9 | 32.3 | 22.9 | 45.8 | 53.1 | 21.3 | 34.9 | 85.2 | 226 | 246 |
| United States | 310 | 343 | 334 | 384 | 368 | 333 | 247 | 230 | 180 | 216 | 217 |
| Thailand | 29.9 | 19.7 | 17.9 | 23.7 | 30.1 | 45.8 | 46.3 | 42.8 | 73.3 | 188 | 196 |
| Philippines | 71.5 | 72.1 | 75.5 | 67.9 | 75.4 | 72.0 | 25.9 | 22.7 | 54.0 | 157 | 150 |
| Germany | 352 | 406 | 386 | 341 | 357 | 403 | 334 | 192 | 348 | 83.8 | 77.9 |
| Netherlands | 235 | 272 | 259 | 252 | 242 | 323 | 374 | 491 | 774 | 61.6 | 42.2 |
| Others | 438 | 437 | 441 | 460 | 340 | 369 | 392 | 369 | 516 | 591 | 416 |
| Total | 1,675 | 1,863 | 1,822 | 1,810 | 1,830 | 2,019 | 1,769 | 1,736 | 2,593 | 2,996 | 2,597 |
Imports by Country
Malaysia (150M units), Taiwan (Chinese) (83M units) and the United States (74M units) were the main suppliers of electronic chip imports to the UK, with a combined 60% share of total imports.
From 2013 to 2023, the most notable rate of growth in terms of purchases, amongst the main suppliers, was attained by Malaysia (with a CAGR of +33.2%), while imports for the other leaders experienced more modest paces of growth.
In value terms, the largest electronic chip suppliers to the UK were Taiwan (Chinese) ($628M), Malaysia ($357M) and China ($267M), with a combined 48% share of total imports. South Korea, the United States, Thailand, the Philippines, Germany and the Netherlands lagged somewhat behind, together comprising a further 36%.
South Korea, with a CAGR of +23.7%, recorded the highest rates of growth with regard to the value of imports, among the main suppliers over the period under review, while purchases for the other leaders experienced more modest paces of growth.
Imports by Type
In 2023, electronic integrated circuits; n.e.c. in heading no. 8542 (292M units) constituted the largest type of electronic chips supplied to the UK, accounting for a 57% share of total imports. Moreover, electronic integrated circuits; n.e.c. in heading no. 8542 exceeded the figures recorded for the second-largest type, electronic integrated circuits (108M units), threefold. The third position in this ranking was taken by electronic integrated circuits; processors and controllers, whether or not combined with memories, converters, logic circuits, amplifiers, clock and timing circuits, or other circuits (61M units), with a 12% share.
From 2013 to 2023, the average annual growth rate of the volume of electronic integrated circuits; n.e.c. in heading no. 8542 imports amounted to +12.1%. With regard to the other supplied products, the following average annual rates of growth were recorded: electronic integrated circuits (+1.1% per year) and electronic integrated circuits; processors and controllers, whether or not combined with memories, converters, logic circuits, amplifiers, clock and timing circuits, or other circuits (+9.8% per year).
In value terms, electronic chips with the largest imports in the UK were electronic integrated circuits; processors and controllers, whether or not combined with memories, converters, logic circuits, amplifiers, clock and timing circuits, or other circuits ($1.2B), electronic integrated circuits; n.e.c. in heading no. 8542 ($1.1B) and multichip integrated circuits: memories ($250M), together accounting for 96% of total imports.
Import Prices by Country
In 2023, the electronic chip price amounted to $5.1 per unit (CIF, United Kingdom), growing by 4% against the previous year. Over the last decade, it increased at an average annual rate of +3.4%. The pace of growth appeared the most rapid in 2019 when the average import price increased by 15% against the previous year. Over the period under review, average import prices hit record highs at $5.5 per unit in 2020; however, from 2021 to 2023, import prices failed to regain momentum.
Prices varied noticeably by country of origin: amid the top importers, the country with the highest price was Japan ($15 per unit), while the price for Hong Kong ($1.3 per unit) was amongst the lowest.
From 2013 to 2023, the most notable rate of growth in terms of prices was attained by Japan (+24.7%), while the prices for the other major suppliers experienced more modest paces of growth.
This report provides an in-depth analysis of the electronic chip market in the UK. Within it, you will discover the latest data on market trends and opportunities by country, consumption, production and price developments, as well as the global trade (imports and exports). The forecast exhibits the market prospects through 2030.
Product coverage:
- Prodcom 26113003 - Multichip integrated circuits: processors and controllers, w hether or not combined with memories, converters, logic circuits, amplifiers, clock and timing circuits, or other circuits
- Prodcom 26113006 - Electronic integrated circuits (excluding multichip circuits): processors and controllers, whether or not combined with memories, converters, logic circuits, amplifiers, clock and timing circuits, or other circuits
- Prodcom 26113023 - Multichip integrated circuits: memories
- Prodcom 26113027 - Electronic integrated circuits (excluding multichip circuits): dynamic random-access memories (D-RAMs)
- Prodcom 26113034 - Electronic integrated circuits (excluding multichip circuits): static random-access memories (S-RAMs), including cache random-access memories (cache-RAMs)
- Prodcom 26113054 - Electronic integrated circuits (excluding multichip circuits): UV erasable, programmable, read only memories (EPROMs)
- Prodcom 26113065 - Electronic integrated circuits (excluding multichip circuits): electrically erasable, programmable, read only memories (E.PROMs), including flash E.PROMs
- Prodcom 26113067 - Electronic integrated circuits (excluding multichip circuits): other memories
- Prodcom 26113080 - Electronic integrated circuits: amplifiers
- Prodcom 26113091 - Other multichip integrated circuits n.e.c.
- Prodcom 26113094 - Other electronic integrated circuits n.e.c.
Country coverage:
- United Kingdom
Data coverage:
- Market volume and value
- Per Capita consumption
- Forecast of the market dynamics in the medium term
- Trade (exports and imports) in the UK
- Export and import prices
- Market trends, drivers and restraints
- Key market players and their profiles
Reasons to buy this report:
- Take advantage of the latest data
- Find deeper insights into current market developments
- Discover vital success factors affecting the market
This report is designed for manufacturers, distributors, importers, and wholesalers, as well as for investors, consultants and advisors.
In this report, you can find information that helps you to make informed decisions on the following issues:
- How to diversify your business and benefit from new market opportunities
- How to load your idle production capacity
- How to boost your sales on overseas markets
- How to increase your profit margins
- How to make your supply chain more sustainable
- How to reduce your production and supply chain costs
- How to outsource production to other countries
- How to prepare your business for global expansion
While doing this research, we combine the accumulated expertise of our analysts and the capabilities of artificial intelligence. The AI-based platform, developed by our data scientists, constitutes the key working tool for business analysts, empowering them to discover deep insights and ideas from the marketing data.
-
1. INTRODUCTION
Making Data-Driven Decisions to Grow Your Business
- REPORT DESCRIPTION
- RESEARCH METHODOLOGY AND AI PLATFORM
- DATA-DRIVEN DECISIONS FOR YOUR BUSINESS
- GLOSSARY AND SPECIFIC TERMS
-
2. EXECUTIVE SUMMARY
A Quick Overview of Market Performance
- KEY FINDINGS
- MARKET TRENDS This Chapter is Available Only for the Professional Edition PRO
-
3. MARKET OVERVIEW
Understanding the Current State of The Market and Its Prospects
- MARKET SIZE
- MARKET STRUCTURE
- TRADE BALANCE
- PER CAPITA CONSUMPTION
- MARKET FORECAST TO 2030
-
4. MOST PROMISING PRODUCT
Finding New Products to Diversify Your Business
This Chapter is Available Only for the Professional Edition PRO- TOP PRODUCTS TO DIVERSIFY YOUR BUSINESS
- BEST-SELLING PRODUCTS
- MOST CONSUMED PRODUCT
- MOST TRADED PRODUCT
- MOST PROFITABLE PRODUCT FOR EXPORT
-
5. MOST PROMISING SUPPLYING COUNTRIES
Choosing the Best Countries to Establish Your Sustainable Supply Chain
This Chapter is Available Only for the Professional Edition PRO- TOP COUNTRIES TO SOURCE YOUR PRODUCT
- TOP PRODUCING COUNTRIES
- TOP EXPORTING COUNTRIES
- LOW-COST EXPORTING COUNTRIES
-
6. MOST PROMISING OVERSEAS MARKETS
Choosing the Best Countries to Boost Your Exports
This Chapter is Available Only for the Professional Edition PRO- TOP OVERSEAS MARKETS FOR EXPORTING YOUR PRODUCT
- TOP CONSUMING MARKETS
- UNSATURATED MARKETS
- TOP IMPORTING MARKETS
- MOST PROFITABLE MARKETS
7. PRODUCTION
The Latest Trends and Insights into The Industry
- PRODUCTION VOLUME AND VALUE
8. IMPORTS
The Largest Import Supplying Countries
- IMPORTS FROM 2012–2023
- IMPORTS BY COUNTRY
- IMPORT PRICES BY COUNTRY
9. EXPORTS
The Largest Destinations for Exports
- EXPORTS FROM 2012–2023
- EXPORTS BY COUNTRY
- EXPORT PRICES BY COUNTRY
-
10. PROFILES OF MAJOR PRODUCERS
The Largest Producers on The Market and Their Profiles
This Chapter is Available Only for the Professional Edition PRO -
LIST OF TABLES
- Key Findings In 2023
- Market Volume, In Physical Terms, 2012–2023
- Market Value, 2012–2023
- Per Capita Consumption In 2012-2023
- Imports, In Physical Terms, By Country, 2012–2023
- Imports, In Value Terms, By Country, 2012–2023
- Import Prices, By Country Of Origin, 2012–2023
- Exports, In Physical Terms, By Country, 2012–2023
- Exports, In Value Terms, By Country, 2012–2023
- Export Prices, By Country Of Destination, 2012–2023
-
LIST OF FIGURES
- Market Volume, In Physical Terms, 2012–2023
- Market Value, 2012–2023
- Market Structure – Domestic Supply vs. Imports, In Physical Terms, 2012-2023
- Market Structure – Domestic Supply vs. Imports, In Value Terms, 2012-2023
- Trade Balance, In Physical Terms, 2012-2023
- Trade Balance, In Value Terms, 2012-2023
- Per Capita Consumption, 2012-2023
- Market Volume Forecast to 2030
- Market Value Forecast to 2030
- Products: Market Size And Growth, By Type
- Products: Average Per Capita Consumption, By Type
- Products: Exports And Growth, By Type
- Products: Export Prices And Growth, By Type
- Production Volume And Growth
- Exports And Growth
- Export Prices And Growth
- Market Size And Growth
- Per Capita Consumption
- Imports And Growth
- Import Prices
- Production, In Physical Terms, 2012–2023
- Production, In Value Terms, 2012–2023
- Imports, In Physical Terms, 2012–2023
- Imports, In Value Terms, 2012–2023
- Imports, In Physical Terms, By Country, 2023
- Imports, In Physical Terms, By Country, 2012–2023
- Imports, In Value Terms, By Country, 2012–2023
- Import Prices, By Country Of Origin, 2012–2023
- Exports, In Physical Terms, 2012–2023
- Exports, In Value Terms, 2012–2023
- Exports, In Physical Terms, By Country, 2023
- Exports, In Physical Terms, By Country, 2012–2023
- Exports, In Value Terms, By Country, 2012–2023
- Export Prices, By Country Of Destination, 2012–2023


