
U.S. Electronic Connector Market. Analysis And Forecast to 2030
Get instant access to more than 2 million reports, dashboards, and datasets on the IndexBox Platform.
View PricingElectronic Connector Imports Into the U.S. Drop 15% to $2.6 Billion in 2023
U.S. Electronic Connector Imports
In 2023, supplies from abroad of electronic connectors decreased by -35% to 2.6B units for the first time since 2020, thus ending a two-year rising trend. Overall, imports recorded a noticeable curtailment. The pace of growth appeared the most rapid in 2021 when imports increased by 33% against the previous year. Imports peaked at 4.5B units in 2017; however, from 2018 to 2023, imports stood at a somewhat lower figure.
In value terms, electronic connector imports contracted remarkably to $2.6B (IndexBox estimates) in 2023. The total import value increased at an average annual rate of +3.6% from 2013 to 2023; however, the trend pattern indicated some noticeable fluctuations being recorded throughout the analyzed period. The most prominent rate of growth was recorded in 2021 with an increase of 23%. Imports peaked at $3B in 2022, and then shrank dramatically in the following year.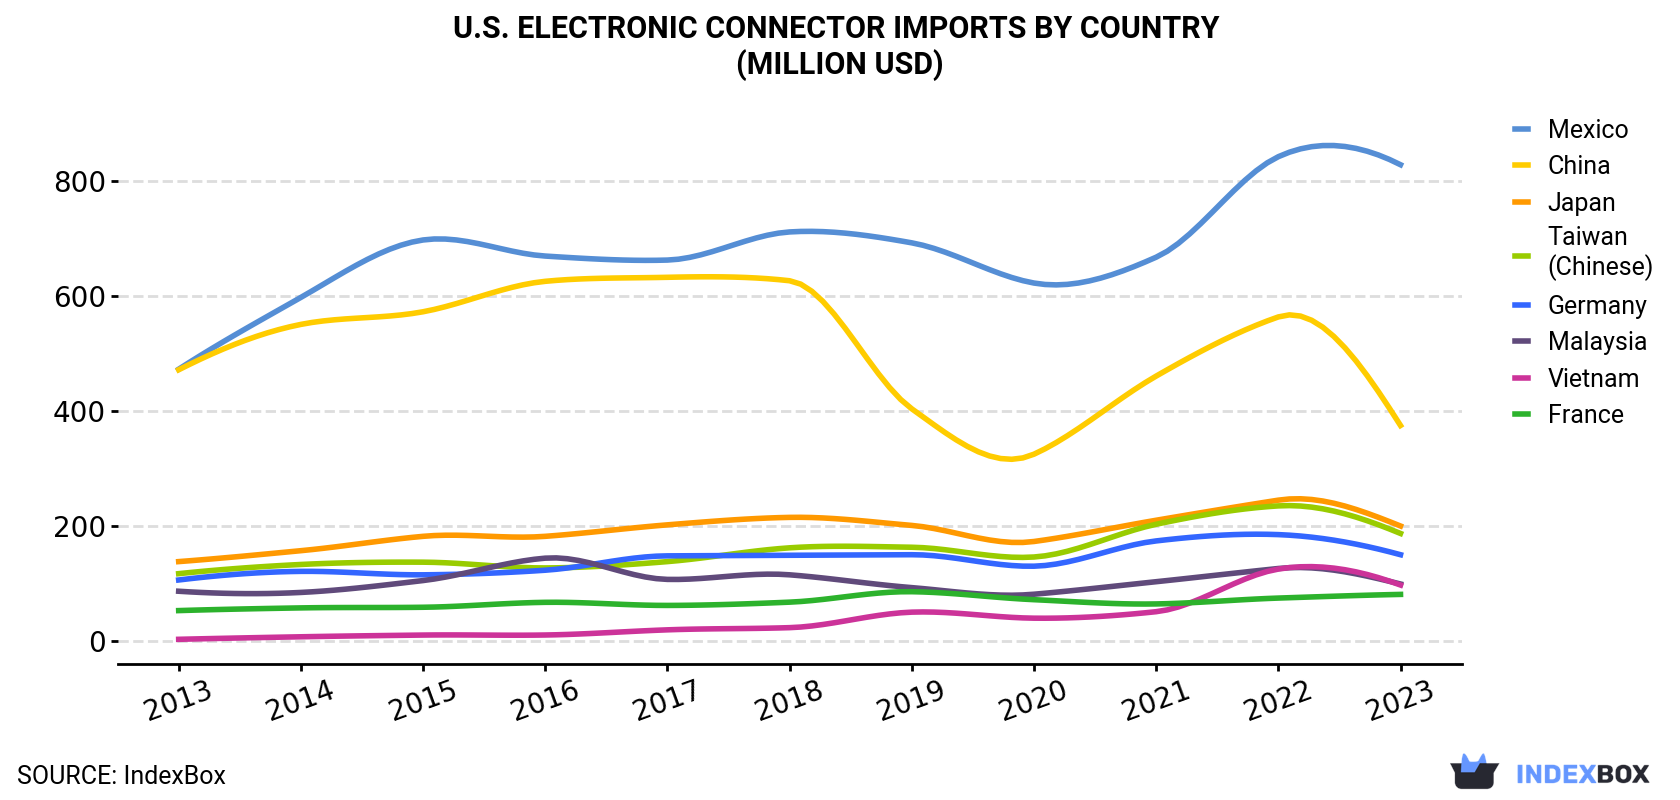
| COUNTRY | Import Value of Electronic Connector in U.S. (million USD) | ||||||||||
|---|---|---|---|---|---|---|---|---|---|---|---|
| 2013 | 2014 | 2015 | 2016 | 2017 | 2018 | 2019 | 2020 | 2021 | 2022 | 2023 | |
| Mexico | 473 | 598 | 698 | 670 | 663 | 712 | 693 | 623 | 668 | 843 | 829 |
| China | 472 | 551 | 573 | 626 | 633 | 627 | 404 | 325 | 461 | 564 | 375 |
| Japan | 138 | 157 | 182 | 182 | 202 | 215 | 201 | 173 | 210 | 245 | 200 |
| Taiwan (Chinese) | 117 | 133 | 137 | 127 | 138 | 162 | 163 | 146 | 203 | 235 | 187 |
| Germany | 106 | 121 | 115 | 123 | 148 | 149 | 150 | 130 | 174 | 185 | 150 |
| Malaysia | 86.4 | 84.3 | 105 | 144 | 107 | 115 | 92.7 | 81.2 | 103 | 126 | 99.0 |
| Vietnam | 2.7 | 7.1 | 10.1 | 10.2 | 19.2 | 23.0 | 50.0 | 39.5 | 50.8 | 125 | 97.2 |
| France | 52.7 | 57.4 | 58.5 | 67.1 | 61.7 | 67.4 | 85.6 | 71.7 | 64.3 | 74.5 | 80.9 |
| Others | 362 | 418 | 476 | 463 | 463 | 502 | 492 | 441 | 553 | 637 | 552 |
| Total | 1,810 | 2,127 | 2,355 | 2,413 | 2,434 | 2,573 | 2,330 | 2,030 | 2,488 | 3,034 | 2,569 |
Imports by Country
In 2023, China (677M units) constituted the largest supplier of electronic connector to the United States, accounting for a 26% share of total imports. Moreover, electronic connector imports from China exceeded the figures recorded by the second-largest supplier, Japan (311M units), twofold. Taiwan (Chinese) (299M units) ranked third in terms of total imports with an 11% share.
From 2013 to 2023, the average annual rate of growth in terms of volume from China totaled -4.8%. The remaining supplying countries recorded the following average annual rates of imports growth: Japan (-3.9% per year) and Taiwan (Chinese) (+2.4% per year).
In value terms, Mexico ($829M) constituted the largest supplier of electronic connectors to the United States, comprising 32% of total imports. The second position in the ranking was held by China ($375M), with a 15% share of total imports. It was followed by Japan, with a 7.8% share.
From 2013 to 2023, the average annual rate of growth in terms of value from Mexico totaled +5.8%. The remaining supplying countries recorded the following average annual rates of imports growth: China (-2.3% per year) and Japan (+3.7% per year).
Import Prices by Country
In 2023, the electronic connector price stood at $975 per thousand units (CIF, US), with an increase of 30% against the previous year. In general, import price indicated a resilient increase from 2013 to 2023: its price increased at an average annual rate of +5.8% over the last decade. The trend pattern, however, indicated some noticeable fluctuations being recorded throughout the analyzed period. Based on 2023 figures, electronic connector import price increased by +55.4% against 2021 indices. As a result, import price attained the peak level and is likely to continue growth in the immediate term.
Prices varied noticeably by country of origin: amid the top importers, the country with the highest price was Mexico ($3.1 per unit), while the price for South Korea ($330 per thousand units) was amongst the lowest.
From 2013 to 2023, the most notable rate of growth in terms of prices was attained by Mexico (+14.9%), while the prices for the other major suppliers experienced more modest paces of growth.
This report provides an in-depth analysis of the electronic connector market in the U.S.. Within it, you will discover the latest data on market trends and opportunities by country, consumption, production and price developments, as well as the global trade (imports and exports). The forecast exhibits the market prospects through 2030.
Product coverage:
- NAICS 334417 - Electronic connector manufacturing
Companies mentioned:
- Tyco Electronics Corporation
- Pei/Genesis
- Methode Electronics
- Airborn Interconnect
- Mac Lean-Fogg Company
- Amphenol Corporation
- L-Com
- Hypertronics Corporation
- Dcg Systems
- Teledyne Odi
- CTS Corporation
- Positronic Industries
- Winchester Electronics Corp
- Sabritec
- Mill-Max Mfg. Corp.
- Powell Electronics
- Amphenol Optimize Manufacturing Co.
- Joslyn Sunbank Company
- Cinch Connectivity Solutions
- Zeikos
- I O Interconnect
- Amphenol TCS
- Felchar Manufacturing Corporation
- Woodhead Industries
- Radiall America
- Molex U S Inc
- Charged Up
- Iriso, U.S.A.
- Fci Usa
- Brantner Holding Company
Country coverage:
- United States
Data coverage:
- Market volume and value
- Per Capita consumption
- Forecast of the market dynamics in the medium term
- Trade (exports and imports) in the U.S.
- Export and import prices
- Market trends, drivers and restraints
- Key market players and their profiles
Reasons to buy this report:
- Take advantage of the latest data
- Find deeper insights into current market developments
- Discover vital success factors affecting the market
This report is designed for manufacturers, distributors, importers, and wholesalers, as well as for investors, consultants and advisors.
In this report, you can find information that helps you to make informed decisions on the following issues:
- How to diversify your business and benefit from new market opportunities
- How to load your idle production capacity
- How to boost your sales on overseas markets
- How to increase your profit margins
- How to make your supply chain more sustainable
- How to reduce your production and supply chain costs
- How to outsource production to other countries
- How to prepare your business for global expansion
While doing this research, we combine the accumulated expertise of our analysts and the capabilities of artificial intelligence. The AI-based platform, developed by our data scientists, constitutes the key working tool for business analysts, empowering them to discover deep insights and ideas from the marketing data.
-
1. INTRODUCTION
Making Data-Driven Decisions to Grow Your Business
- REPORT DESCRIPTION
- RESEARCH METHODOLOGY AND AI PLATFORM
- DATA-DRIVEN DECISIONS FOR YOUR BUSINESS
- GLOSSARY AND SPECIFIC TERMS
-
2. EXECUTIVE SUMMARY
A Quick Overview of Market Performance
- KEY FINDINGS
- MARKET TRENDS This Chapter is Available Only for the Professional Edition PRO
-
3. MARKET OVERVIEW
Understanding the Current State of The Market and Its Prospects
- MARKET SIZE
- MARKET STRUCTURE
- TRADE BALANCE
- PER CAPITA CONSUMPTION
- MARKET FORECAST TO 2030
-
4. MOST PROMISING PRODUCT
Finding New Products to Diversify Your Business
This Chapter is Available Only for the Professional Edition PRO- TOP PRODUCTS TO DIVERSIFY YOUR BUSINESS
- BEST-SELLING PRODUCTS
- MOST CONSUMED PRODUCT
- MOST TRADED PRODUCT
- MOST PROFITABLE PRODUCT FOR EXPORT
-
5. MOST PROMISING SUPPLYING COUNTRIES
Choosing the Best Countries to Establish Your Sustainable Supply Chain
This Chapter is Available Only for the Professional Edition PRO- TOP COUNTRIES TO SOURCE YOUR PRODUCT
- TOP PRODUCING COUNTRIES
- TOP EXPORTING COUNTRIES
- LOW-COST EXPORTING COUNTRIES
-
6. MOST PROMISING OVERSEAS MARKETS
Choosing the Best Countries to Boost Your Exports
This Chapter is Available Only for the Professional Edition PRO- TOP OVERSEAS MARKETS FOR EXPORTING YOUR PRODUCT
- TOP CONSUMING MARKETS
- UNSATURATED MARKETS
- TOP IMPORTING MARKETS
- MOST PROFITABLE MARKETS
7. PRODUCTION
The Latest Trends and Insights into The Industry
- PRODUCTION VOLUME AND VALUE
8. IMPORTS
The Largest Import Supplying Countries
- IMPORTS FROM 2012–2023
- IMPORTS BY COUNTRY
- IMPORT PRICES BY COUNTRY
9. EXPORTS
The Largest Destinations for Exports
- EXPORTS FROM 2012–2023
- EXPORTS BY COUNTRY
- EXPORT PRICES BY COUNTRY
-
10. PROFILES OF MAJOR PRODUCERS
The Largest Producers on The Market and Their Profiles
This Chapter is Available Only for the Professional Edition PRO -
LIST OF TABLES
- Key Findings In 2023
- Market Volume, In Physical Terms, 2012–2023
- Market Value, 2012–2023
- Per Capita Consumption In 2012-2023
- Imports, In Physical Terms, By Country, 2012–2023
- Imports, In Value Terms, By Country, 2012–2023
- Import Prices, By Country Of Origin, 2012–2023
- Exports, In Physical Terms, By Country, 2012–2023
- Exports, In Value Terms, By Country, 2012–2023
- Export Prices, By Country Of Destination, 2012–2023
-
LIST OF FIGURES
- Market Volume, In Physical Terms, 2012–2023
- Market Value, 2012–2023
- Market Structure – Domestic Supply vs. Imports, In Physical Terms, 2012-2023
- Market Structure – Domestic Supply vs. Imports, In Value Terms, 2012-2023
- Trade Balance, In Physical Terms, 2012-2023
- Trade Balance, In Value Terms, 2012-2023
- Per Capita Consumption, 2012-2023
- Market Volume Forecast to 2030
- Market Value Forecast to 2030
- Products: Market Size And Growth, By Type
- Products: Average Per Capita Consumption, By Type
- Products: Exports And Growth, By Type
- Products: Export Prices And Growth, By Type
- Production Volume And Growth
- Exports And Growth
- Export Prices And Growth
- Market Size And Growth
- Per Capita Consumption
- Imports And Growth
- Import Prices
- Production, In Physical Terms, 2012–2023
- Production, In Value Terms, 2012–2023
- Imports, In Physical Terms, 2012–2023
- Imports, In Value Terms, 2012–2023
- Imports, In Physical Terms, By Country, 2023
- Imports, In Physical Terms, By Country, 2012–2023
- Imports, In Value Terms, By Country, 2012–2023
- Import Prices, By Country Of Origin, 2012–2023
- Exports, In Physical Terms, 2012–2023
- Exports, In Value Terms, 2012–2023
- Exports, In Physical Terms, By Country, 2023
- Exports, In Physical Terms, By Country, 2012–2023
- Exports, In Value Terms, By Country, 2012–2023
- Export Prices, By Country Of Destination, 2012–2023


