
U.S. - Furniture, Bases And Covers For Sewing Machines - Market Analysis, Forecast, Size, Trends And Insights
Get instant access to more than 2 million reports, dashboards, and datasets on the IndexBox Platform.
View PricingSewing Machine Furniture Import to U.S. Drops 15% to $68M in 2023
U.S. Sewing Machine Furniture Imports
In 2023, supplies from abroad of furniture, bases and covers for sewing machines decreased by -14.4% to 3.9K tons, falling for the second year in a row after nine years of growth. In general, imports showed a perceptible decrease. The growth pace was the most rapid in 2021 when imports increased by 29%. As a result, imports attained the peak of 5.5K tons. From 2022 to 2023, the growth of imports remained at a lower figure.
In value terms, sewing machine furniture imports contracted rapidly to $68M (IndexBox estimates) in 2023. Over the period under review, imports saw a slight decline. The growth pace was the most rapid in 2021 with an increase of 28% against the previous year. As a result, imports attained the peak of $83M. From 2022 to 2023, the growth of imports failed to regain momentum.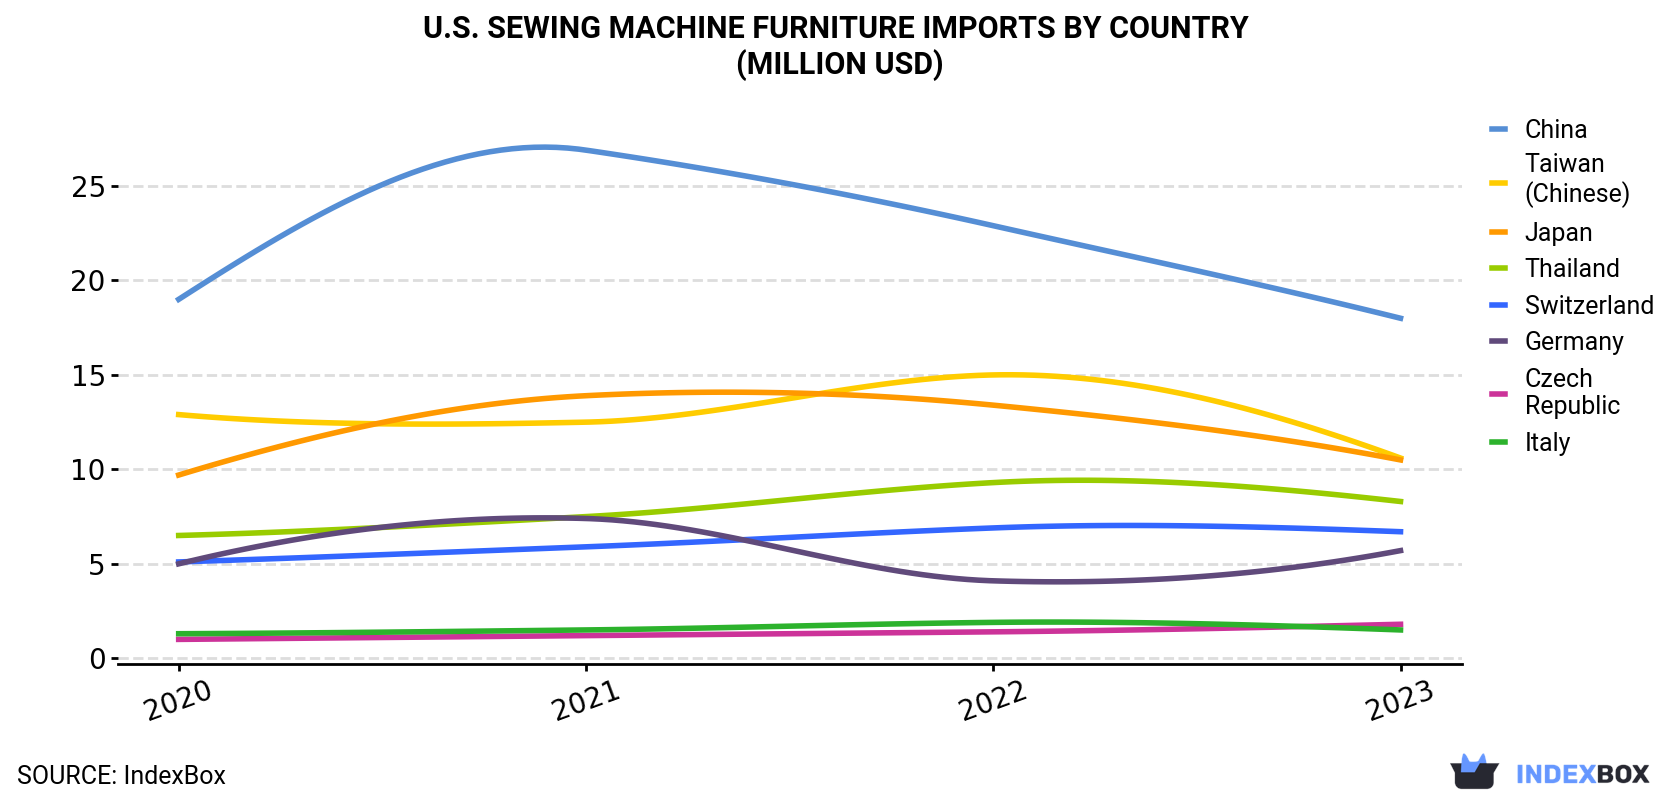
| COUNTRY | Import Value of Sewing Machine Furniture in U.S. (million USD) | |||
|---|---|---|---|---|
| 2020 | 2021 | 2022 | 2023 | |
| China | 19.0 | 26.9 | 22.9 | 18.0 |
| Taiwan (Chinese) | 12.9 | 12.5 | 15.0 | 10.6 |
| Japan | 9.7 | 13.9 | 13.4 | 10.5 |
| Thailand | 6.5 | 7.5 | 9.3 | 8.3 |
| Switzerland | 5.1 | 5.9 | 6.9 | 6.7 |
| Germany | 5.0 | 7.4 | 4.1 | 5.7 |
| Czech Republic | 1.0 | 1.2 | 1.4 | 1.8 |
| Italy | 1.3 | 1.5 | 1.9 | 1.5 |
| Others | 4.4 | 5.9 | 6.0 | 5.3 |
| Total | 64.7 | 82.8 | 80.8 | 68.4 |
Imports by Country
In 2023, China (2.2K tons) constituted the largest sewing machine furniture supplier to the United States, accounting for a 56% share of total imports. Moreover, sewing machine furniture imports from China exceeded the figures recorded by the second-largest supplier, Taiwan (Chinese) (856 tons), threefold. Japan (381 tons) ranked third in terms of total imports with a 9.8% share.
From 2020 to 2023, the average annual rate of growth in terms of volume from China was relatively modest. The remaining supplying countries recorded the following average annual rates of imports growth: Taiwan (Chinese) (-13.2% per year) and Japan (+6.8% per year).
In value terms, the largest sewing machine furniture suppliers to the United States were China ($18M), Taiwan (Chinese) ($11M) and Japan ($11M), with a combined 57% share of total imports. Thailand, Switzerland, Germany, the Czech Republic and Italy lagged somewhat behind, together comprising a further 35%.
In terms of the main suppliers, the Czech Republic, with a CAGR of +23.1%, recorded the highest rates of growth with regard to the value of imports, over the period under review, while purchases for the other leaders experienced more modest paces of growth.
Import Prices by Country
In 2023, the sewing machine furniture price stood at $17,547 per ton (CIF, US), stabilizing at the previous year. Over the last three years, it increased at an average annual rate of +4.8%. The most prominent rate of growth was recorded in 2022 when the average import price increased by 17%. As a result, import price attained the peak level of $17,751 per ton, and then reduced modestly in the following year.
Prices varied noticeably by country of origin: amid the top importers, the country with the highest price was Switzerland ($105,227 per ton), while the price for China ($8,208 per ton) was amongst the lowest.
From 2020 to 2023, the most notable rate of growth in terms of prices was attained by Vietnam (+25.8%), while the prices for the other major suppliers experienced mixed trend patterns.
This report provides an in-depth analysis of the sewing machine furniture market in the U.S.. Within it, you will discover the latest data on market trends and opportunities by country, consumption, production and price developments, as well as the global trade (imports and exports). The forecast exhibits the market prospects through 2030.
Product coverage:
- Prodcom 28945260 - Furniture, bases and covers for sewing machines and parts thereof, other parts of sewing machines
Country coverage:
- United States
Data coverage:
- Market volume and value
- Per Capita consumption
- Forecast of the market dynamics in the medium term
- Trade (exports and imports) in the U.S.
- Export and import prices
- Market trends, drivers and restraints
- Key market players and their profiles
Reasons to buy this report:
- Take advantage of the latest data
- Find deeper insights into current market developments
- Discover vital success factors affecting the market
This report is designed for manufacturers, distributors, importers, and wholesalers, as well as for investors, consultants and advisors.
In this report, you can find information that helps you to make informed decisions on the following issues:
- How to diversify your business and benefit from new market opportunities
- How to load your idle production capacity
- How to boost your sales on overseas markets
- How to increase your profit margins
- How to make your supply chain more sustainable
- How to reduce your production and supply chain costs
- How to outsource production to other countries
- How to prepare your business for global expansion
While doing this research, we combine the accumulated expertise of our analysts and the capabilities of artificial intelligence. The AI-based platform, developed by our data scientists, constitutes the key working tool for business analysts, empowering them to discover deep insights and ideas from the marketing data.
-
1. INTRODUCTION
Making Data-Driven Decisions to Grow Your Business
- REPORT DESCRIPTION
- RESEARCH METHODOLOGY AND AI PLATFORM
- DATA-DRIVEN DECISIONS FOR YOUR BUSINESS
- GLOSSARY AND SPECIFIC TERMS
-
2. EXECUTIVE SUMMARY
A Quick Overview of Market Performance
- KEY FINDINGS
- MARKET TRENDS This Chapter is Available Only for the Professional Edition PRO
-
3. MARKET OVERVIEW
Understanding the Current State of The Market and Its Prospects
- MARKET SIZE
- MARKET STRUCTURE
- TRADE BALANCE
- PER CAPITA CONSUMPTION
- MARKET FORECAST TO 2030
-
4. MOST PROMISING PRODUCT
Finding New Products to Diversify Your Business
This Chapter is Available Only for the Professional Edition PRO- TOP PRODUCTS TO DIVERSIFY YOUR BUSINESS
- BEST-SELLING PRODUCTS
- MOST CONSUMED PRODUCT
- MOST TRADED PRODUCT
- MOST PROFITABLE PRODUCT FOR EXPORT
-
5. MOST PROMISING SUPPLYING COUNTRIES
Choosing the Best Countries to Establish Your Sustainable Supply Chain
This Chapter is Available Only for the Professional Edition PRO- TOP COUNTRIES TO SOURCE YOUR PRODUCT
- TOP PRODUCING COUNTRIES
- TOP EXPORTING COUNTRIES
- LOW-COST EXPORTING COUNTRIES
-
6. MOST PROMISING OVERSEAS MARKETS
Choosing the Best Countries to Boost Your Exports
This Chapter is Available Only for the Professional Edition PRO- TOP OVERSEAS MARKETS FOR EXPORTING YOUR PRODUCT
- TOP CONSUMING MARKETS
- UNSATURATED MARKETS
- TOP IMPORTING MARKETS
- MOST PROFITABLE MARKETS
7. PRODUCTION
The Latest Trends and Insights into The Industry
- PRODUCTION VOLUME AND VALUE
8. IMPORTS
The Largest Import Supplying Countries
- IMPORTS FROM 2012–2023
- IMPORTS BY COUNTRY
- IMPORT PRICES BY COUNTRY
9. EXPORTS
The Largest Destinations for Exports
- EXPORTS FROM 2012–2023
- EXPORTS BY COUNTRY
- EXPORT PRICES BY COUNTRY
-
10. PROFILES OF MAJOR PRODUCERS
The Largest Producers on The Market and Their Profiles
This Chapter is Available Only for the Professional Edition PRO -
LIST OF TABLES
- Key Findings In 2023
- Market Volume, In Physical Terms, 2012–2023
- Market Value, 2012–2023
- Per Capita Consumption In 2012-2023
- Imports, In Physical Terms, By Country, 2012–2023
- Imports, In Value Terms, By Country, 2012–2023
- Import Prices, By Country Of Origin, 2012–2023
- Exports, In Physical Terms, By Country, 2012–2023
- Exports, In Value Terms, By Country, 2012–2023
- Export Prices, By Country Of Destination, 2012–2023
-
LIST OF FIGURES
- Market Volume, In Physical Terms, 2012–2023
- Market Value, 2012–2023
- Market Structure – Domestic Supply vs. Imports, In Physical Terms, 2012-2023
- Market Structure – Domestic Supply vs. Imports, In Value Terms, 2012-2023
- Trade Balance, In Physical Terms, 2012-2023
- Trade Balance, In Value Terms, 2012-2023
- Per Capita Consumption, 2012-2023
- Market Volume Forecast to 2030
- Market Value Forecast to 2030
- Products: Market Size And Growth, By Type
- Products: Average Per Capita Consumption, By Type
- Products: Exports And Growth, By Type
- Products: Export Prices And Growth, By Type
- Production Volume And Growth
- Exports And Growth
- Export Prices And Growth
- Market Size And Growth
- Per Capita Consumption
- Imports And Growth
- Import Prices
- Production, In Physical Terms, 2012–2023
- Production, In Value Terms, 2012–2023
- Imports, In Physical Terms, 2012–2023
- Imports, In Value Terms, 2012–2023
- Imports, In Physical Terms, By Country, 2023
- Imports, In Physical Terms, By Country, 2012–2023
- Imports, In Value Terms, By Country, 2012–2023
- Import Prices, By Country Of Origin, 2012–2023
- Exports, In Physical Terms, 2012–2023
- Exports, In Value Terms, 2012–2023
- Exports, In Physical Terms, By Country, 2023
- Exports, In Physical Terms, By Country, 2012–2023
- Exports, In Value Terms, By Country, 2012–2023
- Export Prices, By Country Of Destination, 2012–2023


