World - Vacuum Vessels - Market Analysis, Forecast, Size, Trends And Insights
Get instant access to more than 2 million reports, dashboards, and datasets on the IndexBox Platform.
View PricingGlobal Vacuum Flasks and Vessels Market: Projected to Reach 1.2B Units and $5.9B by 2030
IndexBox has just published a new report: World - Vacuum Vessels - Market Analysis, Forecast, Size, Trends And Insights.
Driven by increasing global demand, the vacuum flasks and vessels market is projected to experience a +1.2% CAGR in volume and +2.5% CAGR in value from 2023 to 2030. With a focus on market performance and anticipated growth, this article provides insights into the expanding market for vacuum flasks and vessels.
Market Forecast
Driven by increasing demand for vacuum flasks and vessels worldwide, the market is expected to continue an upward consumption trend over the next seven-year period. Market performance is forecast to decelerate, expanding with an anticipated CAGR of +1.2% for the period from 2023 to 2030, which is projected to bring the market volume to 1.2B units by the end of 2030.
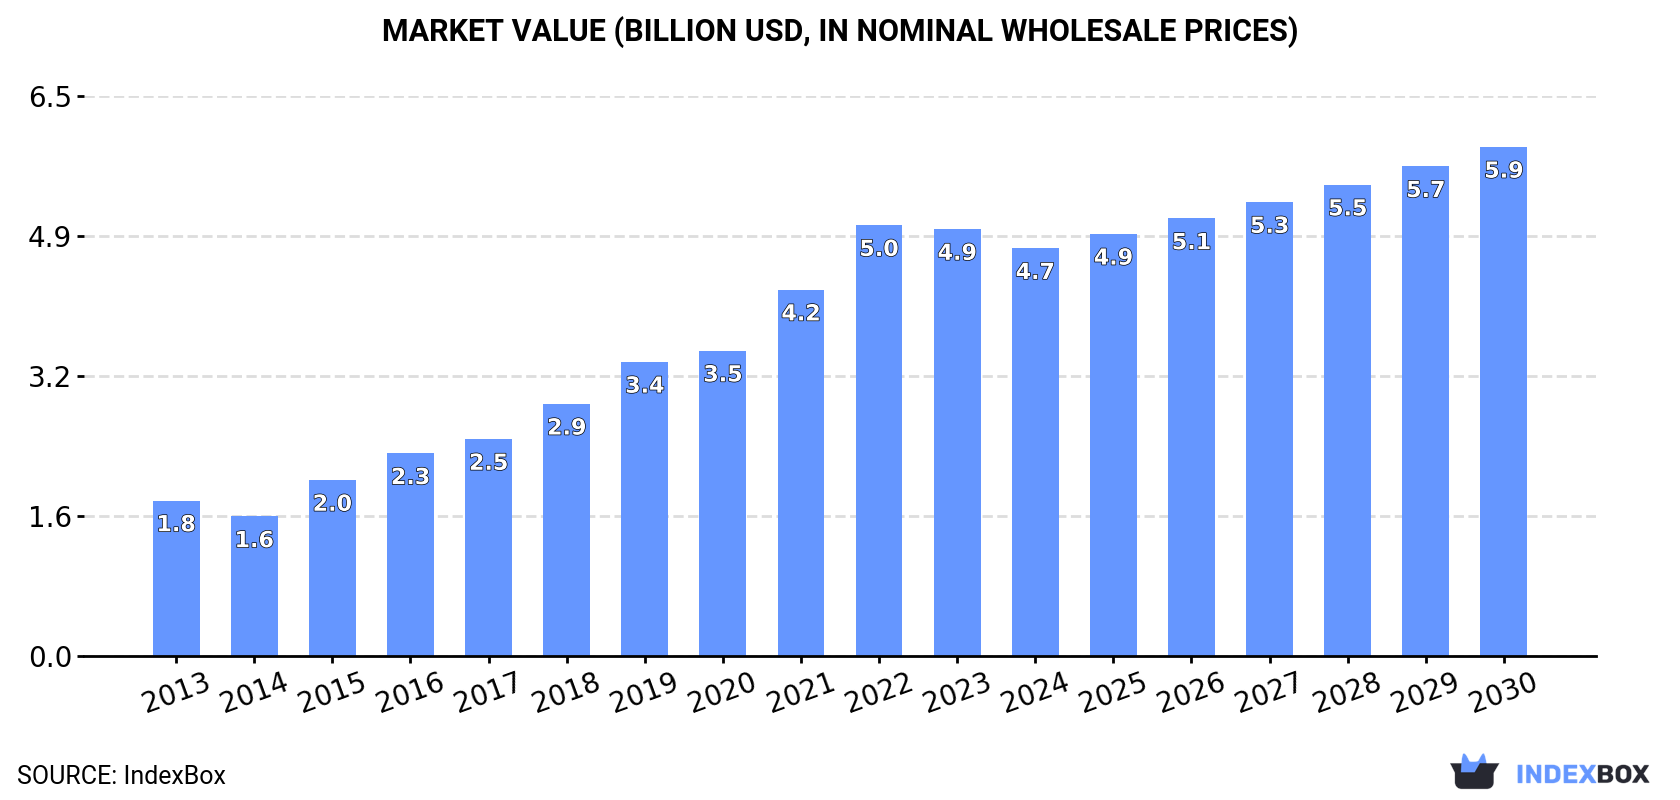
In value terms, the market is forecast to increase with an anticipated CAGR of +2.5% for the period from 2023 to 2030, which is projected to bring the market value to $5.9B (in nominal wholesale prices) by the end of 2030.
Consumption
World Consumption of Vacuum Flasks and Vessels
Global vacuum flask and vessel consumption rose notably to 1.1B units in 2023, picking up by 5.4% on 2022 figures. Overall, consumption saw a strong expansion. Global consumption peaked in 2023 and is likely to continue growth in years to come.
The global vacuum flask and vessel market size reduced slightly to $4.9B in 2023, stabilizing at the previous year. This figure reflects the total revenues of producers and importers (excluding logistics costs, retail marketing costs, and retailers' margins, which will be included in the final consumer price). Over the period under review, consumption posted strong growth. Global consumption peaked at $5B in 2022, and then reduced slightly in the following year.
Consumption By Country
The countries with the highest volumes of consumption in 2023 were the United States (211M units), China (163M units) and India (75M units), with a combined 40% share of global consumption.
From 2013 to 2023, the biggest increases were recorded for the United States (with a CAGR of +20.4%), while consumption for the other global leaders experienced more modest paces of growth.
In value terms, the United States ($1.2B) led the market, alone. The second position in the ranking was taken by China ($540M). It was followed by Vietnam.
From 2013 to 2023, the average annual rate of growth in terms of value in the United States stood at +24.0%. The remaining consuming countries recorded the following average annual rates of market growth: China (+5.9% per year) and Vietnam (+32.6% per year).
The countries with the highest levels of vacuum flask and vessel per capita consumption in 2023 were Canada (687 units per 1000 persons), the United States (626 units per 1000 persons) and Tanzania (346 units per 1000 persons).
From 2013 to 2023, the most notable rate of growth in terms of consumption, amongst the main consuming countries, was attained by the United States (with a CAGR of +19.5%), while consumption for the other global leaders experienced more modest paces of growth.
Production
World Production of Vacuum Flasks and Vessels
In 2023, global production of vacuum flasks and vessels expanded rapidly to 1.4B units, picking up by 10% on the previous year. Overall, production saw prominent growth. The pace of growth was the most pronounced in 2016 when the production volume increased by 31% against the previous year. Over the period under review, global production attained the peak volume in 2023 and is likely to see gradual growth in the immediate term.
In value terms, vacuum flask and vessel production expanded slightly to $4.9B in 2023 estimated in export price. Over the period under review, production saw resilient growth. The most prominent rate of growth was recorded in 2016 with an increase of 24% against the previous year. Over the period under review, global production attained the peak level at $5.2B in 2021; however, from 2022 to 2023, production failed to regain momentum.
Production By Country
China (1.2B units) constituted the country with the largest volume of vacuum flask and vessel production, accounting for 85% of total volume. It was followed by India (31M units), with a 2.2% share of total production.
In China, vacuum flask and vessel production increased at an average annual rate of +9.4% over the period from 2013-2023. In the other countries, the average annual rates were as follows: India (+1.0% per year) and Brazil (+2.1% per year).
Imports
World Imports of Vacuum Flasks and Vessels
For the third consecutive year, the global market recorded growth in purchases abroad of vacuum flasks and vessels, which increased by 6.4% to 895M units in 2023. Over the period under review, imports showed a prominent increase. The pace of growth appeared the most rapid in 2021 with an increase of 23% against the previous year. Over the period under review, global imports reached the maximum in 2023 and are expected to retain growth in years to come.
In value terms, vacuum flask and vessel imports fell to $4.2B in 2023. In general, imports posted a buoyant expansion. The pace of growth appeared the most rapid in 2021 with an increase of 33% against the previous year. Over the period under review, global imports hit record highs at $4.2B in 2022, and then reduced modestly in the following year.
Imports By Country
The United States represented the major importer of vacuum flasks and vessels in the world, with the volume of imports amounting to 229M units, which was near 26% of total imports in 2023. India (47M units) took the second position in the ranking, followed by Mexico (45M units). All these countries together held approx. 10% share of total imports. The following importers - the Netherlands (29M units), Canada (28M units), Nigeria (27M units), Japan (25M units), Tanzania (23M units), Germany (21M units), the United Arab Emirates (20M units), Brazil (18M units), South Korea (18M units) and Paraguay (16M units) - together made up 25% of total imports.
From 2013 to 2023, average annual rates of growth with regard to vacuum flask and vessel imports into the United States stood at +19.5%. At the same time, Brazil (+29.2%), Mexico (+27.6%), Paraguay (+21.9%), the Netherlands (+20.9%), India (+15.2%), Canada (+10.6%), South Korea (+8.1%) and Germany (+4.3%) displayed positive paces of growth. Moreover, Brazil emerged as the fastest-growing importer imported in the world, with a CAGR of +29.2% from 2013-2023. Tanzania, the United Arab Emirates and Nigeria experienced a relatively flat trend pattern. By contrast, Japan (-2.8%) illustrated a downward trend over the same period. The United States (+16 p.p.), Mexico (+4.1 p.p.), India (+2.5 p.p.), the Netherlands (+2.2 p.p.) and Brazil (+1.7 p.p.) significantly strengthened its position in terms of the global imports, while the United Arab Emirates, Tanzania, Nigeria and Japan saw its share reduced by -2.6%, -2.9%, -4% and -5% from 2013 to 2023, respectively. The shares of the other countries remained relatively stable throughout the analyzed period.
In value terms, the United States ($1.3B) constitutes the largest market for imported vacuum flasks and vessels worldwide, comprising 31% of global imports. The second position in the ranking was held by Japan ($251M), with a 5.9% share of global imports. It was followed by Canada, with a 4.8% share.
In the United States, vacuum flask and vessel imports expanded at an average annual rate of +24.0% over the period from 2013-2023. The remaining importing countries recorded the following average annual rates of imports growth: Japan (-0.4% per year) and Canada (+17.5% per year).
Import Prices By Country
In 2023, the average vacuum flask and vessel import price amounted to $4.7 per unit, with a decrease of -6.6% against the previous year. Over the last decade, it increased at an average annual rate of +3.7%. The most prominent rate of growth was recorded in 2015 an increase of 13% against the previous year. Global import price peaked at $5 per unit in 2022, and then shrank in the following year.
There were significant differences in the average prices amongst the major importing countries. In 2023, amid the top importers, the country with the highest price was Japan ($10 per unit), while Tanzania ($0.3 per unit) was amongst the lowest.
From 2013 to 2023, the most notable rate of growth in terms of prices was attained by Canada (+6.3%), while the other global leaders experienced more modest paces of growth.
Exports
World Exports of Vacuum Flasks and Vessels
In 2023, approx. 1.2B units of vacuum flasks and vessels were exported worldwide; rising by 12% against the previous year. In general, exports continue to indicate a buoyant increase. The pace of growth was the most pronounced in 2016 with an increase of 41% against the previous year. Over the period under review, the global exports hit record highs in 2023 and are expected to retain growth in the immediate term.
In value terms, vacuum flask and vessel exports rose rapidly to $5.5B in 2023. Overall, exports posted a buoyant increase. The growth pace was the most rapid in 2021 when exports increased by 31%. The global exports peaked in 2023 and are likely to see gradual growth in years to come.
Exports By Country
China prevails in exports structure, amounting to 1B units, which was approx. 89% of total exports in 2023. The following exporters - the Netherlands (18M units) and the United States (18M units) - each amounted to a 3.1% share of total exports.
Exports from China increased at an average annual rate of +9.9% from 2013 to 2023. At the same time, the Netherlands (+20.5%) and the United States (+12.9%) displayed positive paces of growth. Moreover, the Netherlands emerged as the fastest-growing exporter exported in the world, with a CAGR of +20.5% from 2013-2023. From 2013 to 2023, the share of China increased by +3.9 percentage points, while the shares of the other countries remained relatively stable throughout the analyzed period.
In value terms, China ($4.5B) remains the largest vacuum flask and vessel supplier worldwide, comprising 81% of global exports. The second position in the ranking was held by the United States ($167M), with a 3% share of global exports.
In China, vacuum flask and vessel exports increased at an average annual rate of +13.2% over the period from 2013-2023. In the other countries, the average annual rates were as follows: the United States (+21.3% per year) and the Netherlands (+17.3% per year).
Export Prices By Country
The average vacuum flask and vessel export price stood at $4.8 per unit in 2023, falling by -5.5% against the previous year. Over the period from 2013 to 2023, it increased at an average annual rate of +2.6%. The growth pace was the most rapid in 2014 an increase of 22% against the previous year. The global export price peaked at $5.1 per unit in 2022, and then reduced in the following year.
There were significant differences in the average prices amongst the major exporting countries. In 2023, amid the top suppliers, the country with the highest price was the United States ($9.4 per unit), while China ($4.4 per unit) was amongst the lowest.
From 2013 to 2023, the most notable rate of growth in terms of prices was attained by the United States (+7.5%), while the other global leaders experienced mixed trends in the export price figures.
This report provides an in-depth analysis of the global market for vacuum flask and vessel. Within it, you will discover the latest data on market trends and opportunities by country, consumption, production and price developments, as well as the global trade (imports and exports). The forecast exhibits the market prospects through 2030.
Product coverage:
- Prodcom 32995960 - Vacuum flasks and other vacuum vessels, complete with cases, and parts thereof (excluding separate glass inners)
Country coverage:
Worldwide - the report contains statistical data for 200 countries and includes detailed profiles of the 50 largest consuming countries:
- USA
- China
- Japan
- Germany
- United Kingdom
- France
- Brazil
- Italy
- Russian Federation
- India
- Canada
- Australia
- Republic of Korea
- Spain
- Mexico
- Indonesia
- Netherlands
- Turkey
- Saudi Arabia
- Switzerland
- Sweden
- Nigeria
- Poland
- Belgium
- Argentina
- Norway
- Austria
- Thailand
- United Arab Emirates
- Colombia
- Denmark
- South Africa
- Malaysia
- Israel
- Singapore
- Egypt
- Philippines
- Finland
- Chile
- Ireland
- Pakistan
- Greece
- Portugal
- Kazakhstan
- Algeria
- Czech Republic
- Qatar
- Peru
- Romania
- Vietnam
+ the largest producing countries
Data coverage:
- Global market volume and value
- Per Capita consumption
- Forecast of the market dynamics in the medium term
- Global production, split by region and country
- Global trade (exports and imports)
- Export and import prices
- Market trends, drivers and restraints
- Key market players and their profiles
Reasons to buy this report:
- Take advantage of the latest data
- Find deeper insights into current market developments
- Discover vital success factors affecting the market
This report is designed for manufacturers, distributors, importers, and wholesalers, as well as for investors, consultants and advisors.
In this report, you can find information that helps you to make informed decisions on the following issues:
- How to diversify your business and benefit from new market opportunities
- How to load your idle production capacity
- How to boost your sales on overseas markets
- How to increase your profit margins
- How to make your supply chain more sustainable
- How to reduce your production and supply chain costs
- How to outsource production to other countries
- How to prepare your business for global expansion
While doing this research, we combine the accumulated expertise of our analysts and the capabilities of artificial intelligence. The AI-based platform, developed by our data scientists, constitutes the key working tool for business analysts, empowering them to discover deep insights and ideas from the marketing data.
-
1. INTRODUCTION
Making Data-Driven Decisions to Grow Your Business
- REPORT DESCRIPTION
- RESEARCH METHODOLOGY AND AI PLATFORM
- DATA-DRIVEN DECISIONS FOR YOUR BUSINESS
- GLOSSARY AND SPECIFIC TERMS
-
2. EXECUTIVE SUMMARY
A Quick Overview of Market Performance
- KEY FINDINGS
- MARKET TRENDS This Chapter is Available Only for the Professional Edition PRO
-
3. MARKET OVERVIEW
Understanding the Current State of The Market and Its Prospects
- MARKET SIZE
- CONSUMPTION BY COUNTRY
- MARKET FORECAST TO 2030
-
4. MOST PROMISING PRODUCT
Finding New Products to Diversify Your Business
This Chapter is Available Only for the Professional Edition PRO- TOP PRODUCTS TO DIVERSIFY YOUR BUSINESS
- BEST-SELLING PRODUCTS
- MOST CONSUMED PRODUCT
- MOST TRADED PRODUCT
- MOST PROFITABLE PRODUCT FOR EXPORT
-
5. MOST PROMISING SUPPLYING COUNTRIES
Choosing the Best Countries to Establish Your Sustainable Supply Chain
This Chapter is Available Only for the Professional Edition PRO- TOP COUNTRIES TO SOURCE YOUR PRODUCT
- TOP PRODUCING COUNTRIES
- TOP EXPORTING COUNTRIES
- LOW-COST EXPORTING COUNTRIES
-
6. MOST PROMISING OVERSEAS MARKETS
Choosing the Best Countries to Boost Your Exports
This Chapter is Available Only for the Professional Edition PRO- TOP OVERSEAS MARKETS FOR EXPORTING YOUR PRODUCT
- TOP CONSUMING MARKETS
- UNSATURATED MARKETS
- TOP IMPORTING MARKETS
- MOST PROFITABLE MARKETS
7. GLOBAL PRODUCTION
The Latest Trends and Insights into The Industry
- PRODUCTION VOLUME AND VALUE
- PRODUCTION BY COUNTRY
8. GLOBAL IMPORTS
The Largest Importers on The Market and How They Succeed
- IMPORTS FROM 2012–2023
- IMPORTS BY COUNTRY
- IMPORT PRICES BY COUNTRY
9. GLOBAL EXPORTS
The Largest Exporters on The Market and How They Succeed
- EXPORTS FROM 2012–2023
- EXPORTS BY COUNTRY
- EXPORT PRICES BY COUNTRY
-
10. PROFILES OF MAJOR PRODUCERS
The Largest Producers on The Market and Their Profiles
This Chapter is Available Only for the Professional Edition PRO -
11. COUNTRY PROFILES
The Largest Markets And Their Profiles
This Chapter is Available Only for the Professional Edition PRO- United States
- China
- Japan
- Germany
- United Kingdom
- France
- Brazil
- Italy
- Russian Federation
- India
- Canada
- Australia
- Republic of Korea
- Spain
- Mexico
- Indonesia
- Netherlands
- Turkey
- Saudi Arabia
- Switzerland
- Sweden
- Nigeria
- Poland
- Belgium
- Argentina
- Norway
- Austria
- Thailand
- United Arab Emirates
- Colombia
- Denmark
- South Africa
- Malaysia
- Israel
- Singapore
- Egypt
- Philippines
- Finland
- Chile
- Ireland
- Pakistan
- Greece
- Portugal
- Kazakhstan
- Algeria
- Czech Republic
- Qatar
- Peru
- Romania
- Vietnam
-
LIST OF TABLES
- Key Findings In 2023
- Market Volume, In Physical Terms, 2012–2023
- Market Value, 2012–2023
- Per Capita Consumption, By Country, 2018–2023
- Production, In Physical Terms, By Country, 2012–2023
- Imports, In Physical Terms, By Country, 2012–2023
- Imports, In Value Terms, By Country, 2012–2023
- Import Prices, By Country Of Destination, 2012–2023
- Exports, In Physical Terms, By Country, 2012–2023
- Exports, In Value Terms, By Country, 2012–2023
- Export Prices, By Country Of Origin, 2012–2023
-
LIST OF FIGURES
- Market Volume, In Physical Terms, 2012–2023
- Market Value, 2012–2023
- Consumption, By Country, 2023
- Market Volume Forecast to 2030
- Market Value Forecast to 2030
- Products: Market Size And Growth, By Type
- Products: Average Per Capita Consumption, By Type
- Products: Exports And Growth, By Type
- Products: Export Prices And Growth, By Type
- Production Volume And Growth
- Exports And Growth
- Export Prices And Growth
- Market Size And Growth
- Per Capita Consumption
- Imports And Growth
- Import Prices
- Production, In Physical Terms, 2012–2023
- Production, In Value Terms, 2012–2023
- Production, By Country, 2023
- Production, In Physical Terms, By Country, 2012–2023
- Imports, In Physical Terms, 2012–2023
- Imports, In Value Terms, 2012–2023
- Imports, In Physical Terms, By Country, 2023
- Imports, In Physical Terms, By Country, 2012–2023
- Imports, In Value Terms, By Country, 2012–2023
- Import Prices, By Country, 2012–2023
- Exports, In Physical Terms, 2012–2023
- Exports, In Value Terms, 2012–2023
- Exports, In Physical Terms, By Country, 2023
- Exports, In Physical Terms, By Country, 2012–2023
- Exports, In Value Terms, By Country, 2012–2023
- Export Prices, 2012–2023


