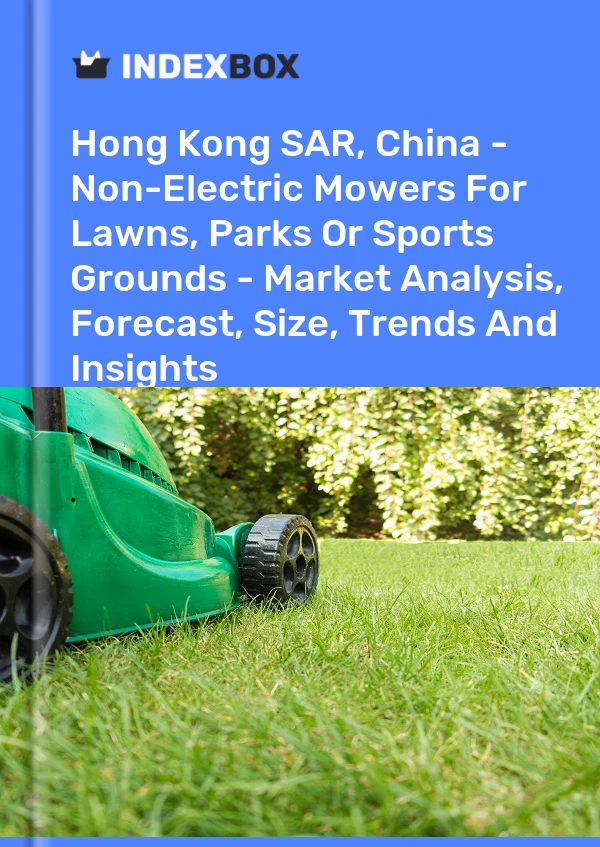
Hong Kong SAR, China - Non-Electric Mowers For Lawns, Parks Or Sports Grounds - Market Analysis, Forecast, Size, Trends And Insights
Get instant access to more than 2 million reports, dashboards, and datasets on the IndexBox Platform.
View PricingPrice for Mower for Lawns, Parks or Sports Grounds in Hong Kong SAR - 2023
Contents:
- Price for Mower for Lawns, Parks or Sports Grounds in Hong Kong SAR (CIF) - 2022
- Price for Mower for Lawns, Parks or Sports Grounds in Hong Kong SAR (FOB) - 2022
- Imports of Mower for Lawns, Parks or Sports Grounds in Hong Kong SAR
- Exports of Mower for Lawns, Parks or Sports Grounds in Hong Kong SAR
Price for Mower for Lawns, Parks or Sports Grounds in Hong Kong SAR (CIF) - 2022
The average import price for mowers for lawns, parks or sports grounds stood at $508 per unit in 2022, picking up by 11% against the previous year. Over the last decade, it increased at an average annual rate of +2.5%. The growth pace was the most rapid in 2018 an increase of 11% against the previous year. The import price peaked in 2022 and is likely to continue growth in the immediate term.
Average prices varied noticeably amongst the major supplying countries. In 2022, amid the top importers, the countries with the highest prices were Sweden ($516 per unit) and the UK ($511 per unit), while the price for Singapore ($500 per unit) and Austria ($501 per unit) were amongst the lowest.
From 2012 to 2022, the most notable rate of growth in terms of prices was attained by Sweden (+2.8%), while the prices for the other major suppliers experienced more modest paces of growth.
Price for Mower for Lawns, Parks or Sports Grounds in Hong Kong SAR (FOB) - 2022
In 2022, the average export price for mowers for lawns, parks or sports grounds amounted to $473 per unit, declining by -15% against the previous year. Over the period under review, the export price, however, showed a modest expansion. The pace of growth was the most pronounced in 2021 when the average export price increased by 19% against the previous year. As a result, the export price reached the peak level of $557 per unit, and then contracted rapidly in the following year.
Average prices varied noticeably for the major export markets. In 2022, amid the top suppliers, the highest price was recorded for prices to France ($476 per unit) and New Zealand ($475 per unit), while the average price for exports to Australia ($468 per unit) and China ($471 per unit) were amongst the lowest.
From 2012 to 2022, the most notable rate of growth in terms of prices was recorded for supplies to Taiwan (Chinese) (+4.1%), while the prices for the other major destinations experienced more modest paces of growth.
Imports of Mower for Lawns, Parks or Sports Grounds in Hong Kong SAR
In 2022, purchases abroad of mowers for lawns, parks or sports grounds decreased by -50.1% to 895 units, falling for the second year in a row after two years of growth. Overall, imports continue to indicate a sharp reduction. The pace of growth appeared the most rapid in 2020 when imports increased by 39%. As a result, imports attained the peak of 3.5K units. From 2021 to 2022, the growth of imports of remained at a somewhat lower figure.
In value terms, imports of mowers for lawns, parks or sports grounds reduced remarkably to $454K in 2022. Over the period under review, imports saw a sharp reduction. The growth pace was the most rapid in 2020 when imports increased by 33%. As a result, imports attained the peak of $1.4M. From 2021 to 2022, the growth of imports of failed to regain momentum.
| Import of Mower for Lawns, Parks or Sports Grounds in Hong Kong SAR (Thousand USD) | |||||
|---|---|---|---|---|---|
| COUNTRY | 2019 | 2020 | 2021 | 2022 | CAGR, 2019-2022 |
| United States | 790 | 1,127 | 481 | 320 | -26.0% |
| China | 137 | 175 | 195 | 62.8 | -22.9% |
| Austria | 36.1 | 10.2 | N/A | 19.0 | -19.3% |
| United Kingdom | 23.0 | 30.9 | 9.2 | 13.3 | -16.7% |
| Singapore | N/A | 9.5 | 15.5 | 13.0 | 17.0% |
| Sweden | N/A | N/A | N/A | 9.8 | 0% |
| Japan | 61.3 | 50.0 | 27.2 | 6.6 | -52.4% |
| Germany | 10.3 | 21.0 | 41.6 | 5.7 | -17.9% |
| Others | 29.5 | 17.4 | 51.7 | 3.1 | -52.8% |
| Total | 1,087 | 1,441 | 822 | 454 | -25.3% |
Top Suppliers of Mower for Lawns, Parks or Sports Grounds to Hong Kong SAR in 2022:
- United States (631.0 units)
- China (124.0 units)
- Austria (38.0 units)
- Singapore (26.0 units)
- United Kingdom (26.0 units)
- Sweden (19.0 units)
- Japan (13.0 units)
- Germany (11.0 units)
Exports of Mower for Lawns, Parks or Sports Grounds in Hong Kong SAR
Exports of mowers for lawns, parks or sports grounds from Hong Kong SAR reached 627 units in 2022, picking up by 13% on 2021. In general, exports, however, continue to indicate a abrupt curtailment. The growth pace was the most rapid in 2020 with an increase of 35%. As a result, the exports attained the peak of 1.6K units. From 2021 to 2022, the growth of the exports of failed to regain momentum.
In value terms, exports of mowers for lawns, parks or sports grounds shrank slightly to $297K in 2022. Over the period under review, exports, however, continue to indicate a precipitous decrease. The growth pace was the most rapid in 2020 when exports increased by 27% against the previous year. As a result, the exports reached the peak of $736K. From 2021 to 2022, the growth of the exports of remained at a somewhat lower figure.
| Export of Mower for Lawns, Parks or Sports Grounds in Hong Kong SAR (Thousand USD) | |||||
|---|---|---|---|---|---|
| COUNTRY | 2019 | 2020 | 2021 | 2022 | CAGR, 2019-2022 |
| United States | 375 | 250 | 148 | 77.9 | -40.8% |
| New Zealand | N/A | N/A | 1.5 | 62.2 | 4046.7% |
| France | 17.4 | 47.1 | 27.2 | 37.1 | 28.7% |
| Czech Republic | N/A | N/A | N/A | 27.4 | 0% |
| Germany | 16.6 | 281 | 9.8 | 24.1 | 13.2% |
| China | 19.2 | 69.7 | 107 | 22.1 | 4.8% |
| Australia | 32.6 | 0.2 | N/A | 20.6 | -14.2% |
| Macao SAR | N/A | 57.4 | N/A | 7.4 | -64.1% |
| Colombia | 44.3 | N/A | N/A | N/A | 0% |
| Panama | 40.0 | N/A | N/A | N/A | 0% |
| Others | 35.8 | 30.3 | 15.3 | 17.8 | -20.8% |
| Total | 581 | 736 | 309 | 297 | -20.0% |
Top Export Markets for Mower for Lawns, Parks or Sports Grounds from Hong Kong SAR in 2022:
- United States (165.0 units)
- New Zealand (131.0 units)
- France (78.0 units)
- Czech Republic (58.0 units)
- Germany (51.0 units)
- China (47.0 units)
- Australia (44.0 units)
- Macao SAR (16.0 units)
This report provides an in-depth analysis of the non-electric mower market in Hong Kong SAR, China. Within it, you will discover the latest data on market trends and opportunities by country, consumption, production and price developments, as well as the global trade (imports and exports). The forecast exhibits the market prospects through 2025.
Product coverage:
- Prodcom 28304030 - Mowers for lawns, parks or sports grounds, powered nonelectrically, w ith the cutting device rotating in a horizontal plane
Country coverage:
- Hong Kong SAR
Data coverage:
- Market volume and value
- Per Capita consumption
- Forecast of the market dynamics in the medium term
- Trade (exports and imports) in Hong Kong SAR, China
- Export and import prices
- Market trends, drivers and restraints
- Key market players and their profiles
Reasons to buy this report:
- Take advantage of the latest data
- Find deeper insights into current market developments
- Discover vital success factors affecting the market
This report is designed for manufacturers, distributors, importers, and wholesalers, as well as for investors, consultants and advisors.
In this report, you can find information that helps you to make informed decisions on the following issues:
- How to diversify your business and benefit from new market opportunities
- How to load your idle production capacity
- How to boost your sales on overseas markets
- How to increase your profit margins
- How to make your supply chain more sustainable
- How to reduce your production and supply chain costs
- How to outsource production to other countries
- How to prepare your business for global expansion
While doing this research, we combine the accumulated expertise of our analysts and the capabilities of artificial intelligence. The AI-based platform, developed by our data scientists, constitutes the key working tool for business analysts, empowering them to discover deep insights and ideas from the marketing data.
-
1. INTRODUCTION
Making Data-Driven Decisions to Grow Your Business
- REPORT DESCRIPTION
- RESEARCH METHODOLOGY AND AI PLATFORM
- DATA-DRIVEN DECISIONS FOR YOUR BUSINESS
- GLOSSARY AND SPECIFIC TERMS
-
2. EXECUTIVE SUMMARY
A Quick Overview of Market Performance
- KEY FINDINGS
- MARKET TRENDS This Chapter is Available Only for the Professional Edition PRO
-
3. MARKET OVERVIEW
Understanding the Current State of The Market and Its Prospects
- MARKET SIZE
- MARKET STRUCTURE
- TRADE BALANCE
- PER CAPITA CONSUMPTION
- MARKET FORECAST TO 2030
-
4. MOST PROMISING PRODUCT
Finding New Products to Diversify Your Business
This Chapter is Available Only for the Professional Edition PRO- TOP PRODUCTS TO DIVERSIFY YOUR BUSINESS
- BEST-SELLING PRODUCTS
- MOST CONSUMED PRODUCT
- MOST TRADED PRODUCT
- MOST PROFITABLE PRODUCT FOR EXPORT
-
5. MOST PROMISING SUPPLYING COUNTRIES
Choosing the Best Countries to Establish Your Sustainable Supply Chain
This Chapter is Available Only for the Professional Edition PRO- TOP COUNTRIES TO SOURCE YOUR PRODUCT
- TOP PRODUCING COUNTRIES
- TOP EXPORTING COUNTRIES
- LOW-COST EXPORTING COUNTRIES
-
6. MOST PROMISING OVERSEAS MARKETS
Choosing the Best Countries to Boost Your Exports
This Chapter is Available Only for the Professional Edition PRO- TOP OVERSEAS MARKETS FOR EXPORTING YOUR PRODUCT
- TOP CONSUMING MARKETS
- UNSATURATED MARKETS
- TOP IMPORTING MARKETS
- MOST PROFITABLE MARKETS
7. PRODUCTION
The Latest Trends and Insights into The Industry
- PRODUCTION VOLUME AND VALUE
8. IMPORTS
The Largest Import Supplying Countries
- IMPORTS FROM 2012–2023
- IMPORTS BY COUNTRY
- IMPORT PRICES BY COUNTRY
9. EXPORTS
The Largest Destinations for Exports
- EXPORTS FROM 2012–2023
- EXPORTS BY COUNTRY
- EXPORT PRICES BY COUNTRY
-
10. PROFILES OF MAJOR PRODUCERS
The Largest Producers on The Market and Their Profiles
This Chapter is Available Only for the Professional Edition PRO -
LIST OF TABLES
- Key Findings In 2023
- Market Volume, In Physical Terms, 2012–2023
- Market Value, 2012–2023
- Per Capita Consumption In 2012-2023
- Imports, In Physical Terms, By Country, 2012–2023
- Imports, In Value Terms, By Country, 2012–2023
- Import Prices, By Country Of Origin, 2012–2023
- Exports, In Physical Terms, By Country, 2012–2023
- Exports, In Value Terms, By Country, 2012–2023
- Export Prices, By Country Of Destination, 2012–2023
-
LIST OF FIGURES
- Market Volume, In Physical Terms, 2012–2023
- Market Value, 2012–2023
- Market Structure – Domestic Supply vs. Imports, In Physical Terms, 2012-2023
- Market Structure – Domestic Supply vs. Imports, In Value Terms, 2012-2023
- Trade Balance, In Physical Terms, 2012-2023
- Trade Balance, In Value Terms, 2012-2023
- Per Capita Consumption, 2012-2023
- Market Volume Forecast to 2030
- Market Value Forecast to 2030
- Products: Market Size And Growth, By Type
- Products: Average Per Capita Consumption, By Type
- Products: Exports And Growth, By Type
- Products: Export Prices And Growth, By Type
- Production Volume And Growth
- Exports And Growth
- Export Prices And Growth
- Market Size And Growth
- Per Capita Consumption
- Imports And Growth
- Import Prices
- Production, In Physical Terms, 2012–2023
- Production, In Value Terms, 2012–2023
- Imports, In Physical Terms, 2012–2023
- Imports, In Value Terms, 2012–2023
- Imports, In Physical Terms, By Country, 2023
- Imports, In Physical Terms, By Country, 2012–2023
- Imports, In Value Terms, By Country, 2012–2023
- Import Prices, By Country Of Origin, 2012–2023
- Exports, In Physical Terms, 2012–2023
- Exports, In Value Terms, 2012–2023
- Exports, In Physical Terms, By Country, 2023
- Exports, In Physical Terms, By Country, 2012–2023
- Exports, In Value Terms, By Country, 2012–2023
- Export Prices, By Country Of Destination, 2012–2023
This report provides an in-depth analysis of the non-electric mower market in Hong Kong SAR, China.
This report provides an in-depth analysis of the mower market in Hong Kong SAR, China.
This report provides an in-depth analysis of the lawn mower market in Hong Kong SAR, China.
This report provides an in-depth analysis of the market for root or tuber harvesting machine in Hong Kong SAR, China.
This report provides an in-depth analysis of the potato harvester market in Hong Kong SAR, China.
This report provides an in-depth analysis of the market for parts of harvester and threshers in Hong Kong SAR, China.
This report provides an in-depth analysis of the non-lawn mower market in Hong Kong SAR, China.
This report provides an in-depth analysis of the combine harvester market in Hong Kong SAR, China.
This report provides an in-depth analysis of the food sorting machine market in Hong Kong SAR, China.
This report provides an in-depth analysis of the hay-making machinery market in Hong Kong SAR, China.
Explore the top countries leading the import market for mowers for lawns, parks, or sports grounds. Learn about the key players driving demand for landscaping tools globally.
Explore the top import markets for mowers and discover key statistics on the industry's landscape. Learn about the leading countries, their import values, and the potential for growth. Stay informed with IndexBox market intelligence.
In 2015, the global mower market decreased to X million units, which was X million units (or X%) less than the year before and X million units (or X%) below the highest level of consumption recorded in 2008.
The global mower market decreased to X million units in 2015, which was X million units (or X%) less than the year before and X million units (or X%) below the highest level of consumption record
Recently, one of the U.S. top mowing equipment manufacturers Excel Industries, announced the launching of a new facility in Logistics Park Kansas City (LPKC), making Kansas the main distribution center for the company's products.
The global market for lawn mowers has been witnessing significant growth, with rising demand for well-maintained lawns and gardens. This article explores the top import markets for lawn mowers, including the United States, Germany, France, Australia, Netherlands, Canada, Belgium, United Kingdom, Poland, and Sweden. Manufacturers and exporters can leverage this information to identify lucrative markets and tailor their strategies accordingly.
Discover the latest trends in the combine harvester-thresher market and projections for the next seven years. With a projected increase in market volume to 244K units and market value to $22.6B by 2030, this sector is set for continued growth.
Explore the top import markets for combine harvesters in 2023. Learn about the key countries driving demand for agricultural machinery.
In 2016, approx. X tons of combine harvester were imported worldwide- jumping by X% against the previous year level. The total import volume increased at an average annual rate of +X% from 2007...
In 2016, approx. X tons of combine harvester were imported worldwide- jumping by X% against the previous year level. The total import volume increased at an average annual rate of +X% from 2007...


