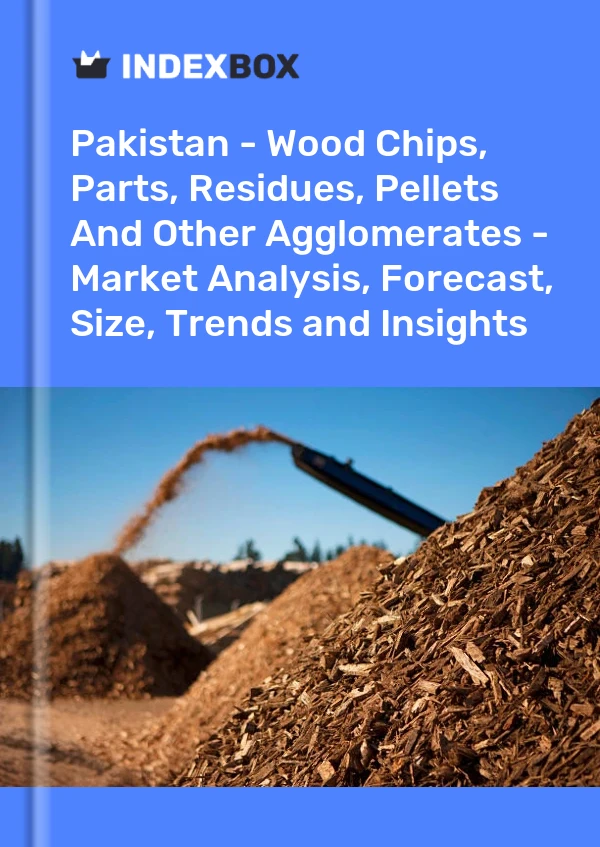
Pakistan - Wood Chips, Parts, Residues, Pellets And Other Agglomerates - Market Analysis, Forecast, Size, Trends and Insights
Get instant access to more than 2 million reports, dashboards, and datasets on the IndexBox Platform.
View PricingPrice for Wood Chips, Parts, Residues, Pellets and Other Agglomerates in Pakistan - 2023
Contents:
- Price for Wood Chips, Parts, Residues, Pellets and Other Agglomerates in Pakistan (CIF) - 2022
- Price for Wood Chips, Parts, Residues, Pellets and Other Agglomerates in Pakistan (FOB) - 2022
- Imports of Wood Chips, Parts, Residues, Pellets and Other Agglomerates in Pakistan
- Exports of Wood Chips, Parts, Residues, Pellets and Other Agglomerates in Pakistan
Price for Wood Chips, Parts, Residues, Pellets and Other Agglomerates in Pakistan (CIF) - 2022
In 2022, the average import price for wood chips, parts, residues, pellets and other agglomerates amounted to $3,245 per cubic meter, rising by 433% against the previous year. Over the period under review, the import price showed a significant expansion. As a result, import price attained the peak level and is likely to continue growth in the immediate term.
There were significant differences in the average prices amongst the major supplying countries. In 2022, amid the top importers, the country with the highest price was Italy ($76,449 per cubic meter), while the price for China ($5 per cubic meter) was amongst the lowest.
From 2012 to 2022, the most notable rate of growth in terms of prices was attained by Indonesia (+1,056.9%), while the prices for the other major suppliers experienced more modest paces of growth.
Price for Wood Chips, Parts, Residues, Pellets and Other Agglomerates in Pakistan (FOB) - 2022
The average export price for wood chips, parts, residues, pellets and other agglomerates stood at $754 per cubic meter in 2022, dropping by -34.1% against the previous year. In general, the export price saw a perceptible contraction. The pace of growth was the most pronounced in 2015 when the average export price increased by 1,018%. Over the period under review, the average export prices attained the maximum at $1,144 per cubic meter in 2021, and then fell notably in the following year.
As there is only one major export destination, the average price level is determined by prices for the United Arab Emirates.
From 2012 to 2022, the rate of growth in terms of prices for South Korea amounted to +153.1% per year.
Imports of Wood Chips, Parts, Residues, Pellets and Other Agglomerates in Pakistan
After three years of growth, overseas purchases of wood chips, parts, residues, pellets and other agglomerates decreased by -92.3% to 84 cubic meters in 2022. In general, imports faced a dramatic contraction. The growth pace was the most rapid in 2021 when imports increased by 25%. As a result, imports reached the peak of 1.1K cubic meters, and then dropped notably in the following year.
In value terms, imports of wood chips, parts, residues, pellets and other agglomerates dropped dramatically to $273K in 2022. Over the period under review, imports faced a abrupt downturn. The pace of growth was the most pronounced in 2021 with an increase of 38%. As a result, imports reached the peak of $666K, and then dropped notably in the following year.
| Import of Wood Chips, Parts, Residues, Pellets and Other Agglomerates in Pakistan (Thousand USD) | |||||
|---|---|---|---|---|---|
| COUNTRY | 2019 | 2020 | 2021 | 2022 | CAGR, 2019-2022 |
| Vietnam | 74.7 | 179 | 374 | 159 | 28.6% |
| Italy | 152 | 134 | 223 | 76.4 | -20.5% |
| Indonesia | N/A | 12.7 | 14.9 | 20.8 | 28.0% |
| United States | 124 | 143 | 16.5 | 16.7 | -48.7% |
| China | 77.0 | 12.1 | 1.3 | N/A | -87.0% |
| Malaysia | 80.6 | N/A | 26.3 | N/A | -42.9% |
| Others | 4.9 | 2.7 | 10.7 | 0.1 | -72.7% |
| Total | 513 | 484 | 666 | 273 | -19.0% |
Top Suppliers of Wood Chips, Parts, Residues, Pellets and Other Agglomerates to Pakistan in 2022:
- Vietnam (78.0 cubic meters)
- Italy (1.0 cubic meters)
- Indonesia (1.0 cubic meters)
- United States (1.0 cubic meters)
- China (1.0 cubic meters)
Exports of Wood Chips, Parts, Residues, Pellets and Other Agglomerates in Pakistan
Exports of wood chips, parts, residues, pellets and other agglomerates from Pakistan skyrocketed to 346 cubic meters in 2022, jumping by 201% compared with the previous year's figure. Overall, exports showed a significant increase. The most prominent rate of growth was recorded in 2020 with an increase of 243% against the previous year. Over the period under review, the exports of attained the maximum in 2022 and are likely to see steady growth in years to come.
In value terms, exports of wood chips, parts, residues, pellets and other agglomerates soared to $261K in 2022. Over the period under review, exports enjoyed significant growth. The most prominent rate of growth was recorded in 2020 with an increase of 209% against the previous year. Over the period under review, the exports of reached the peak figure in 2022 and are likely to see gradual growth in the immediate term.
| Export of Wood Chips, Parts, Residues, Pellets and Other Agglomerates in Pakistan (Thousand USD) | |||||
|---|---|---|---|---|---|
| COUNTRY | 2019 | 2020 | 2021 | 2022 | CAGR, 2019-2022 |
| United Arab Emirates | 30.8 | 93.2 | 129 | 261 | 103.9% |
| Oman | N/A | 1.4 | N/A | N/A | 0% |
| Saudi Arabia | 0.7 | N/A | N/A | N/A | 0% |
| Others | N/A | 2.5 | 2.7 | N/A | 8.0% |
| Total | 31.4 | 97.1 | 132 | 261 | 102.6% |
Top Export Markets for Wood Chips, Parts, Residues, Pellets and Other Agglomerates from Pakistan in 2022:
- United Arab Emirates (346.0 cubic meters)
This report provides an in-depth analysis of the market for wood chips, parts, residues, pellets and other agglomerates in Pakistan. Within it, you will discover the latest data on market trends and opportunities by country, consumption, production and price developments, as well as the global trade (imports and exports). The forecast exhibits the market prospects through 2030.
Product coverage:
- FCL 1619 - Wood chips and particles
- FCL 1693 - Wood pellets
- FCL 1694 - Other agglomerates
- FCL 1620 - Wood residues
Country coverage:
- Pakistan
Data coverage:
- Market volume and value
- Per Capita consumption
- Forecast of the market dynamics in the medium term
- Trade (exports and imports) in Pakistan
- Export and import prices
- Market trends, drivers and restraints
- Key market players and their profiles
Reasons to buy this report:
- Take advantage of the latest data
- Find deeper insights into current market developments
- Discover vital success factors affecting the market
This report is designed for manufacturers, distributors, importers, and wholesalers, as well as for investors, consultants and advisors.
In this report, you can find information that helps you to make informed decisions on the following issues:
- How to diversify your business and benefit from new market opportunities
- How to load your idle production capacity
- How to boost your sales on overseas markets
- How to increase your profit margins
- How to make your supply chain more sustainable
- How to reduce your production and supply chain costs
- How to outsource production to other countries
- How to prepare your business for global expansion
While doing this research, we combine the accumulated expertise of our analysts and the capabilities of artificial intelligence. The AI-based platform, developed by our data scientists, constitutes the key working tool for business analysts, empowering them to discover deep insights and ideas from the marketing data.
-
1. INTRODUCTION
Making Data-Driven Decisions to Grow Your Business
- REPORT DESCRIPTION
- RESEARCH METHODOLOGY AND AI PLATFORM
- DATA-DRIVEN DECISIONS FOR YOUR BUSINESS
- GLOSSARY AND SPECIFIC TERMS
-
2. EXECUTIVE SUMMARY
A Quick Overview of Market Performance
- KEY FINDINGS
- MARKET TRENDS This Chapter is Available Only for the Professional Edition PRO
-
3. MARKET OVERVIEW
Understanding the Current State of The Market and Its Prospects
- MARKET SIZE
- MARKET STRUCTURE
- TRADE BALANCE
- PER CAPITA CONSUMPTION
- MARKET FORECAST TO 2030
-
4. MOST PROMISING PRODUCT
Finding New Products to Diversify Your Business
This Chapter is Available Only for the Professional Edition PRO- TOP PRODUCTS TO DIVERSIFY YOUR BUSINESS
- BEST-SELLING PRODUCTS
- MOST CONSUMED PRODUCT
- MOST TRADED PRODUCT
- MOST PROFITABLE PRODUCT FOR EXPORT
-
5. MOST PROMISING SUPPLYING COUNTRIES
Choosing the Best Countries to Establish Your Sustainable Supply Chain
This Chapter is Available Only for the Professional Edition PRO- TOP COUNTRIES TO SOURCE YOUR PRODUCT
- TOP PRODUCING COUNTRIES
- TOP EXPORTING COUNTRIES
- LOW-COST EXPORTING COUNTRIES
-
6. MOST PROMISING OVERSEAS MARKETS
Choosing the Best Countries to Boost Your Exports
This Chapter is Available Only for the Professional Edition PRO- TOP OVERSEAS MARKETS FOR EXPORTING YOUR PRODUCT
- TOP CONSUMING MARKETS
- UNSATURATED MARKETS
- TOP IMPORTING MARKETS
- MOST PROFITABLE MARKETS
7. PRODUCTION
The Latest Trends and Insights into The Industry
- PRODUCTION VOLUME AND VALUE
8. IMPORTS
The Largest Import Supplying Countries
- IMPORTS FROM 2012–2023
- IMPORTS BY COUNTRY
- IMPORT PRICES BY COUNTRY
9. EXPORTS
The Largest Destinations for Exports
- EXPORTS FROM 2012–2023
- EXPORTS BY COUNTRY
- EXPORT PRICES BY COUNTRY
-
10. PROFILES OF MAJOR PRODUCERS
The Largest Producers on The Market and Their Profiles
This Chapter is Available Only for the Professional Edition PRO -
LIST OF TABLES
- Key Findings In 2023
- Market Volume, In Physical Terms, 2012–2023
- Market Value, 2012–2023
- Per Capita Consumption In 2012-2023
- Imports, In Physical Terms, By Country, 2012–2023
- Imports, In Value Terms, By Country, 2012–2023
- Import Prices, By Country Of Origin, 2012–2023
- Exports, In Physical Terms, By Country, 2012–2023
- Exports, In Value Terms, By Country, 2012–2023
- Export Prices, By Country Of Destination, 2012–2023
-
LIST OF FIGURES
- Market Volume, In Physical Terms, 2012–2023
- Market Value, 2012–2023
- Market Structure – Domestic Supply vs. Imports, In Physical Terms, 2012-2023
- Market Structure – Domestic Supply vs. Imports, In Value Terms, 2012-2023
- Trade Balance, In Physical Terms, 2012-2023
- Trade Balance, In Value Terms, 2012-2023
- Per Capita Consumption, 2012-2023
- Market Volume Forecast to 2030
- Market Value Forecast to 2030
- Products: Market Size And Growth, By Type
- Products: Average Per Capita Consumption, By Type
- Products: Exports And Growth, By Type
- Products: Export Prices And Growth, By Type
- Production Volume And Growth
- Exports And Growth
- Export Prices And Growth
- Market Size And Growth
- Per Capita Consumption
- Imports And Growth
- Import Prices
- Production, In Physical Terms, 2012–2023
- Production, In Value Terms, 2012–2023
- Imports, In Physical Terms, 2012–2023
- Imports, In Value Terms, 2012–2023
- Imports, In Physical Terms, By Country, 2023
- Imports, In Physical Terms, By Country, 2012–2023
- Imports, In Value Terms, By Country, 2012–2023
- Import Prices, By Country Of Origin, 2012–2023
- Exports, In Physical Terms, 2012–2023
- Exports, In Value Terms, 2012–2023
- Exports, In Physical Terms, By Country, 2023
- Exports, In Physical Terms, By Country, 2012–2023
- Exports, In Value Terms, By Country, 2012–2023
- Export Prices, By Country Of Destination, 2012–2023
This report provides an in-depth analysis of the market for wood chips, parts, residues, pellets and other agglomerates in Pakistan.
This report provides an in-depth analysis of the market for wood chips and particles in Pakistan.
This report provides an in-depth analysis of the chipped coniferous wood market in Pakistan.
This report provides an in-depth analysis of the chipped non-coniferous wood market in Pakistan.
This report provides an in-depth analysis of the roundwood market in Pakistan.
This report provides an in-depth analysis of the wood fuel market in Pakistan.
This report provides an in-depth analysis of the market for wood residues, pellets and other agglomerates in Pakistan.
This report provides an in-depth analysis of the solid biofuel market in Pakistan.
This report provides an in-depth analysis of the unsewn book binder market in Pakistan.
This report provides an in-depth analysis of the book sewing machine market in Pakistan.
Explore the world's best import markets for wood chips, parts, residues, pellets, and other agglomerates. Discover key statistics and data from the IndexBox market intelligence platform.
Read on to learn about the most popular wood chip products in the industry, backed by data from the IndexBox market report. Explore key statistics and numbers that provide insight into this growing market.
The U.S. dominates in the global trade of chips and particles. In 2014, the U.S. exported X million tons of chips and particles totaling X million USD, X% over the previous year. Its primary trading partner was the United Kingdom, where it suppl
Explore the top import markets for roundwood based on data from the IndexBox market intelligence platform. Discover the key countries and statistics driving the demand for roundwood globally.
The global roundwood market revenue amounted to $752M in 2018, standing approx. at the previous year. This figure...
In value terms, coal, briquettes, ovoids and similar solid fuels imports totaled $X in 2016. Overall, it indicated a mild expansion from 2007 to 2016: the total imports value increased at an average...
In value terms, fuel wood in logs, billets, twigs, faggots and similar forms imports totaled $X in 2016. Overall, it indicated a remarkable growth from 2007 to 2016: the total imports value increased...
In value terms, nuclear reactors imports stood at $X in 2016. In general, nuclear reactors imports continue to indicate a relatively flat trend pattern. Over the period under review, global nuclear...
In value terms, coal, briquettes, ovoids and similar solid fuels exports amounted to $X in 2016. Overall, coal, briquettes, ovoids and similar solid fuels exports continue to indicate a noticeable g...
In value terms, fuel wood in logs, billets, twigs, faggots and similar forms exports amounted to $X in 2016. Overall, it indicated a strong increase from 2007 to 2016: the total exports value incre...


