World - Colouring Matter Of Vegetable Or Animal Origin - Market Analysis, Forecast, Size, Trends And Insights
Get instant access to more than 2 million reports, dashboards, and datasets on the IndexBox Platform.
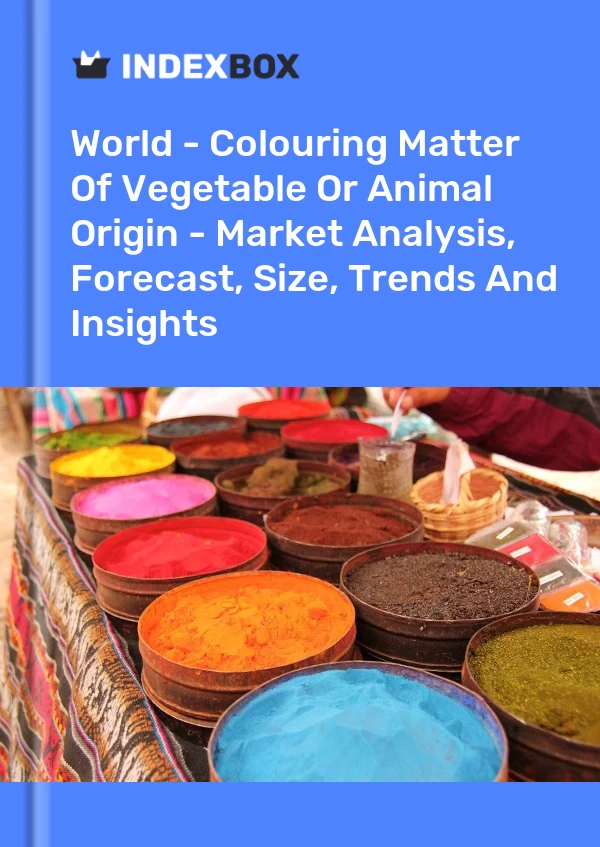
View PricingVegetable or Animal Colouring Matter Market
The global market for colouring matter of vegetable or animal origin is expected to see continued growth in consumption volume and value over the next eight years. Market performance is forecasted to accelerate, with a projected increase in volume to 588K tons and value to $13B by 2030. China leads in both consumption and production, followed by India and the United States. Import and export trends, as well as average prices, are also analyzed in detail.
Market Forecast
Driven by increasing demand for colouring matter of vegetable or animal origin worldwide, the market is expected to continue an upward consumption trend over the next eight years. Market performance is forecast to accelerate, expanding with an anticipated CAGR of +4.2% for the period from 2022 to 2030, which is projected to bring the market volume to 588K tons by the end of 2030.
In value terms, the market is forecast to increase with an anticipated CAGR of +6.6% for the period from 2022 to 2030, which is projected to bring the market value to $13B (in nominal prices) by the end of 2030.
Consumption
World Consumption of Colouring Matter Of Vegetable Or Animal Origin
Global vegetable or animal colouring matter consumption dropped to 422K tons in 2022, declining by -3.8% on the year before. The total consumption volume increased at an average annual rate of +2.3% from 2012 to 2022; however, the trend pattern indicated some noticeable fluctuations being recorded in certain years. The most prominent rate of growth was recorded in 2016 with an increase of 9.2% against the previous year. Over the period under review, global consumption attained the maximum volume at 460K tons in 2019; however, from 2020 to 2022, consumption remained at a lower figure.
The size of the market for colouring matter of vegetable or animal origin worldwide fell to $7.8B in 2022, with a decrease of -2.5% against the previous year. This figure reflects the total revenues of producers and importers (excluding logistics costs, retail marketing costs, and retailers' margins, which will be included in the final consumer price). The market value increased at an average annual rate of +1.5% from 2012 to 2022; however, the trend pattern indicated some noticeable fluctuations being recorded throughout the analyzed period. Over the period under review, the global market attained the peak level at $8.3B in 2018; however, from 2019 to 2022, consumption remained at a lower figure.
Consumption By Country
China (93K tons) constituted the country with the largest volume of vegetable or animal colouring matter consumption, accounting for 22% of total volume. Moreover, vegetable or animal colouring matter consumption in China exceeded the figures recorded by the second-largest consumer, India (40K tons), twofold. The third position in this ranking was taken by the United States (35K tons), with an 8.3% share.
From 2012 to 2022, the average annual rate of growth in terms of volume in China totaled +5.9%. In the other countries, the average annual rates were as follows: India (+6.0% per year) and the United States (+1.5% per year).
In value terms, China ($2.4B) led the market, alone. The second position in the ranking was taken by the United States ($1.1B). It was followed by Japan.
From 2012 to 2022, the average annual rate of growth in terms of value in China stood at +3.2%. In the other countries, the average annual rates were as follows: the United States (+3.1% per year) and Japan (-4.1% per year).
The countries with the highest levels of vegetable or animal colouring matter per capita consumption in 2022 were France (166 kg per 1000 persons), Japan (130 kg per 1000 persons) and Turkey (126 kg per 1000 persons).
From 2012 to 2022, the most notable rate of growth in terms of consumption, amongst the main consuming countries, was attained by Nigeria (with a CAGR of +8.6%), while consumption for the other global leaders experienced more modest paces of growth.
Production
World Production of Colouring Matter Of Vegetable Or Animal Origin
In 2022, the amount of colouring matter of vegetable or animal origin produced worldwide declined to 396K tons, dropping by -4% against the previous year's figure. The total output volume increased at an average annual rate of +2.9% over the period from 2012 to 2022; however, the trend pattern indicated some noticeable fluctuations being recorded throughout the analyzed period. The pace of growth appeared the most rapid in 2014 with an increase of 12% against the previous year. Global production peaked at 433K tons in 2019; however, from 2020 to 2022, production remained at a lower figure.
In value terms, vegetable or animal colouring matter production fell modestly to $7.4B in 2022 estimated in export price. The total output value increased at an average annual rate of +2.5% over the period from 2012 to 2022; however, the trend pattern indicated some noticeable fluctuations being recorded in certain years. The pace of growth was the most pronounced in 2016 when the production volume increased by 15%. Global production peaked at $7.6B in 2019; however, from 2020 to 2022, production failed to regain momentum.
Production By Country
The country with the largest volume of vegetable or animal colouring matter production was China (102K tons), accounting for 26% of total volume. Moreover, vegetable or animal colouring matter production in China exceeded the figures recorded by the second-largest producer, India (44K tons), twofold. The third position in this ranking was held by the United States (27K tons), with a 6.9% share.
In China, vegetable or animal colouring matter production increased at an average annual rate of +7.2% over the period from 2012-2022. In the other countries, the average annual rates were as follows: India (+5.2% per year) and the United States (+0.1% per year).
Imports
World Imports of Colouring Matter Of Vegetable Or Animal Origin
In 2022, purchases abroad of colouring matter of vegetable or animal origin decreased by -3.8% to 110K tons, falling for the second consecutive year after three years of growth. In general, imports continue to indicate a relatively flat trend pattern. The most prominent rate of growth was recorded in 2018 with an increase of 7.9%. Global imports peaked at 117K tons in 2012; however, from 2013 to 2022, imports failed to regain momentum.
In value terms, vegetable or animal colouring matter imports amounted to $2B in 2022. The total import value increased at an average annual rate of +3.3% over the period from 2012 to 2022; the trend pattern indicated some noticeable fluctuations being recorded in certain years. The most prominent rate of growth was recorded in 2020 when imports increased by 14%. Global imports peaked in 2022 and are likely to continue growth in the immediate term.
Imports By Country
The purchases of the twelve major importers of colouring matter of vegetable or animal origin, namely the United States, Italy, the Netherlands, Germany, Spain, France, Mexico, the UK, Russia, Japan, Canada and Denmark, represented more than half of total import. Belgium (2.6K tons) followed a long way behind the leaders.
From 2012 to 2022, the biggest increases were recorded for Russia (with a CAGR of +6.7%), while purchases for the other global leaders experienced more modest paces of growth.
In value terms, the largest vegetable or animal colouring matter importing markets worldwide were the United States ($222M), the Netherlands ($167M) and Japan ($138M), together comprising 26% of global imports.
The Netherlands, with a CAGR of +6.9%, recorded the highest rates of growth with regard to the value of imports, among the main importing countries over the period under review, while purchases for the other global leaders experienced more modest paces of growth.
Import Prices By Country
In 2022, the average import price for colouring matter of vegetable or animal origin amounted to $18,305 per ton, increasing by 7.9% against the previous year. Over the period from 2012 to 2022, it increased at an average annual rate of +4.0%. The most prominent rate of growth was recorded in 2014 an increase of 10% against the previous year. Over the period under review, average import prices reached the maximum in 2022 and is expected to retain growth in the near future.
There were significant differences in the average prices amongst the major importing countries. In 2022, amid the top importers, the country with the highest price was Japan ($47,435 per ton), while Italy ($8,929 per ton) was amongst the lowest.
From 2012 to 2022, the most notable rate of growth in terms of prices was attained by the Netherlands (+26.5%), while the other global leaders experienced more modest paces of growth.
Exports
World Exports of Colouring Matter Of Vegetable Or Animal Origin
In 2022, shipments abroad of colouring matter of vegetable or animal origin decreased by -4.4% to 84K tons for the first time since 2015, thus ending a six-year rising trend. In general, exports, however, recorded a relatively flat trend pattern. The most prominent rate of growth was recorded in 2016 when exports increased by 6.3%. The global exports peaked at 88K tons in 2021, and then shrank in the following year.
In value terms, vegetable or animal colouring matter exports rose to $1.7B in 2022. Overall, total exports indicated a pronounced increase from 2012 to 2022: its value increased at an average annual rate of +4.9% over the last decade. The trend pattern, however, indicated some noticeable fluctuations being recorded throughout the analyzed period. Based on 2022 figures, exports increased by +66.7% against 2013 indices. The most prominent rate of growth was recorded in 2020 when exports increased by 21% against the previous year. The global exports peaked in 2022 and are expected to retain growth in the near future.
Exports By Country
In 2022, the Netherlands (11K tons), China (9.8K tons), Spain (9.1K tons), Italy (7.8K tons), Germany (6.8K tons), France (5K tons), the United States (4.8K tons), India (4.5K tons) and Denmark (3.8K tons) represented the major exporter of colouring matter of vegetable or animal origin in the world, mixing up 74% of total export. Peru (2.5K tons), the UK (2.3K tons), Mexico (2.2K tons) and Israel (2K tons) followed a long way behind the leaders.
From 2012 to 2022, the biggest increases were recorded for China (with a CAGR of +39.3%), while shipments for the other global leaders experienced more modest paces of growth.
In value terms, China ($281M), the Netherlands ($232M) and the United States ($167M) appeared to be the countries with the highest levels of exports in 2022, together accounting for 40% of global exports.
Among the main exporting countries, China, with a CAGR of +33.2%, saw the highest growth rate of the value of exports, over the period under review, while shipments for the other global leaders experienced more modest paces of growth.
Export Prices By Country
The average export price for colouring matter of vegetable or animal origin stood at $20,055 per ton in 2022, surging by 7.4% against the previous year. Over the last decade, it increased at an average annual rate of +4.2%. The most prominent rate of growth was recorded in 2020 an increase of 15%. The global export price peaked in 2022 and is likely to continue growth in the immediate term.
There were significant differences in the average prices amongst the major exporting countries. In 2022, amid the top suppliers, the country with the highest price was the United States ($34,969 per ton), while India ($4,881 per ton) was amongst the lowest.
From 2012 to 2022, the most notable rate of growth in terms of prices was attained by the Netherlands (+9.6%), while the other global leaders experienced more modest paces of growth.
This report provides an in-depth analysis of the global market for vegetable or animal colouring matter. Within it, you will discover the latest data on market trends and opportunities by country, consumption, production and price developments, as well as the global trade (imports and exports). The forecast exhibits the market prospects through 2030.
Product coverage:
- Prodcom 20122270 - Colouring matter of vegetable or animal origin and preparations based thereon (including dyeing extracts) (excluding animal black)
Country coverage:
Worldwide - the report contains statistical data for 200 countries and includes detailed profiles of the 50 largest consuming countries:
- USA
- China
- Japan
- Germany
- United Kingdom
- France
- Brazil
- Italy
- Russian Federation
- India
- Canada
- Australia
- Republic of Korea
- Spain
- Mexico
- Indonesia
- Netherlands
- Turkey
- Saudi Arabia
- Switzerland
- Sweden
- Nigeria
- Poland
- Belgium
- Argentina
- Norway
- Austria
- Thailand
- United Arab Emirates
- Colombia
- Denmark
- South Africa
- Malaysia
- Israel
- Singapore
- Egypt
- Philippines
- Finland
- Chile
- Ireland
- Pakistan
- Greece
- Portugal
- Kazakhstan
- Algeria
- Czech Republic
- Qatar
- Peru
- Romania
- Vietnam
+ the largest producing countries
Data coverage:
- Global market volume and value
- Per Capita consumption
- Forecast of the market dynamics in the medium term
- Global production, split by region and country
- Global trade (exports and imports)
- Export and import prices
- Market trends, drivers and restraints
- Key market players and their profiles
Reasons to buy this report:
- Take advantage of the latest data
- Find deeper insights into current market developments
- Discover vital success factors affecting the market
This report is designed for manufacturers, distributors, importers, and wholesalers, as well as for investors, consultants and advisors.
In this report, you can find information that helps you to make informed decisions on the following issues:
- How to diversify your business and benefit from new market opportunities
- How to load your idle production capacity
- How to boost your sales on overseas markets
- How to increase your profit margins
- How to make your supply chain more sustainable
- How to reduce your production and supply chain costs
- How to outsource production to other countries
- How to prepare your business for global expansion
While doing this research, we combine the accumulated expertise of our analysts and the capabilities of artificial intelligence. The AI-based platform, developed by our data scientists, constitutes the key working tool for business analysts, empowering them to discover deep insights and ideas from the marketing data.
-
1. INTRODUCTION
Making Data-Driven Decisions to Grow Your Business
- REPORT DESCRIPTION
- RESEARCH METHODOLOGY AND AI PLATFORM
- DATA-DRIVEN DECISIONS FOR YOUR BUSINESS
- GLOSSARY AND SPECIFIC TERMS
-
2. EXECUTIVE SUMMARY
A Quick Overview of Market Performance
- KEY FINDINGS
- MARKET TRENDS This Chapter is Available Only for the Professional Edition PRO
-
3. MARKET OVERVIEW
Understanding the Current State of The Market and Its Prospects
- MARKET SIZE
- CONSUMPTION BY COUNTRY
- MARKET FORECAST TO 2030
-
4. MOST PROMISING PRODUCT
Finding New Products to Diversify Your Business
This Chapter is Available Only for the Professional Edition PRO- TOP PRODUCTS TO DIVERSIFY YOUR BUSINESS
- BEST-SELLING PRODUCTS
- MOST CONSUMED PRODUCT
- MOST TRADED PRODUCT
- MOST PROFITABLE PRODUCT FOR EXPORT
-
5. MOST PROMISING SUPPLYING COUNTRIES
Choosing the Best Countries to Establish Your Sustainable Supply Chain
This Chapter is Available Only for the Professional Edition PRO- TOP COUNTRIES TO SOURCE YOUR PRODUCT
- TOP PRODUCING COUNTRIES
- TOP EXPORTING COUNTRIES
- LOW-COST EXPORTING COUNTRIES
-
6. MOST PROMISING OVERSEAS MARKETS
Choosing the Best Countries to Boost Your Exports
This Chapter is Available Only for the Professional Edition PRO- TOP OVERSEAS MARKETS FOR EXPORTING YOUR PRODUCT
- TOP CONSUMING MARKETS
- UNSATURATED MARKETS
- TOP IMPORTING MARKETS
- MOST PROFITABLE MARKETS
7. GLOBAL PRODUCTION
The Latest Trends and Insights into The Industry
- PRODUCTION VOLUME AND VALUE
- PRODUCTION BY COUNTRY
8. GLOBAL IMPORTS
The Largest Importers on The Market and How They Succeed
- IMPORTS FROM 2012–2023
- IMPORTS BY COUNTRY
- IMPORT PRICES BY COUNTRY
9. GLOBAL EXPORTS
The Largest Exporters on The Market and How They Succeed
- EXPORTS FROM 2012–2023
- EXPORTS BY COUNTRY
- EXPORT PRICES BY COUNTRY
-
10. PROFILES OF MAJOR PRODUCERS
The Largest Producers on The Market and Their Profiles
This Chapter is Available Only for the Professional Edition PRO -
11. COUNTRY PROFILES
The Largest Markets And Their Profiles
This Chapter is Available Only for the Professional Edition PRO- United States
- China
- Japan
- Germany
- United Kingdom
- France
- Brazil
- Italy
- Russian Federation
- India
- Canada
- Australia
- Republic of Korea
- Spain
- Mexico
- Indonesia
- Netherlands
- Turkey
- Saudi Arabia
- Switzerland
- Sweden
- Nigeria
- Poland
- Belgium
- Argentina
- Norway
- Austria
- Thailand
- United Arab Emirates
- Colombia
- Denmark
- South Africa
- Malaysia
- Israel
- Singapore
- Egypt
- Philippines
- Finland
- Chile
- Ireland
- Pakistan
- Greece
- Portugal
- Kazakhstan
- Algeria
- Czech Republic
- Qatar
- Peru
- Romania
- Vietnam
-
LIST OF TABLES
- Key Findings In 2023
- Market Volume, In Physical Terms, 2012–2023
- Market Value, 2012–2023
- Per Capita Consumption, By Country, 2018–2023
- Production, In Physical Terms, By Country, 2012–2023
- Imports, In Physical Terms, By Country, 2012–2023
- Imports, In Value Terms, By Country, 2012–2023
- Import Prices, By Country Of Destination, 2012–2023
- Exports, In Physical Terms, By Country, 2012–2023
- Exports, In Value Terms, By Country, 2012–2023
- Export Prices, By Country Of Origin, 2012–2023
-
LIST OF FIGURES
- Market Volume, In Physical Terms, 2012–2023
- Market Value, 2012–2023
- Consumption, By Country, 2023
- Market Volume Forecast to 2030
- Market Value Forecast to 2030
- Products: Market Size And Growth, By Type
- Products: Average Per Capita Consumption, By Type
- Products: Exports And Growth, By Type
- Products: Export Prices And Growth, By Type
- Production Volume And Growth
- Exports And Growth
- Export Prices And Growth
- Market Size And Growth
- Per Capita Consumption
- Imports And Growth
- Import Prices
- Production, In Physical Terms, 2012–2023
- Production, In Value Terms, 2012–2023
- Production, By Country, 2023
- Production, In Physical Terms, By Country, 2012–2023
- Imports, In Physical Terms, 2012–2023
- Imports, In Value Terms, 2012–2023
- Imports, In Physical Terms, By Country, 2023
- Imports, In Physical Terms, By Country, 2012–2023
- Imports, In Value Terms, By Country, 2012–2023
- Import Prices, By Country, 2012–2023
- Exports, In Physical Terms, 2012–2023
- Exports, In Value Terms, 2012–2023
- Exports, In Physical Terms, By Country, 2023
- Exports, In Physical Terms, By Country, 2012–2023
- Exports, In Value Terms, By Country, 2012–2023
- Export Prices, 2012–2023
In value terms, colouring matter of vegetable and animal origin imports totaled $X in 2016. Overall, it indicated a remarkable increase from 2007 to 2016: the total imports value increased at an av...
In value terms, colouring matter of vegetable and animal origin exports amounted to $X in 2016. Overall, it indicated a remarkable growth from 2007 to 2016: the total exports value increased at an ...


