Mexico - Domestic, Non-Electric, Cooking Or Heating Appliances - Market Analysis, Forecast, Size, Trends and Insights
Get instant access to more than 2 million reports, dashboards, and datasets on the IndexBox Platform.
View PricingMexico Experiences 19% Surge in October 2023 With $59M in Exports of Its Non-electric Cooking or Heating Appliances.
Mexico Domestic, Non-Electric, Cooking Or Heating Appliance Exports
In October 2023, after two months of decline, there was significant growth in shipments abroad of domestic, non-electric, cooking or heating appliances, when their volume increased by 16% to 161K units. Over the period under review, total exports indicated notable growth from October 2022 to October 2023: its volume increased at an average monthly rate of +3.4% over the last twelve months. The trend pattern, however, indicated some noticeable fluctuations being recorded throughout the analyzed period. Based on October 2023 figures, exports decreased by -20.2% against July 2023 indices. The most prominent rate of growth was recorded in March 2023 when exports increased by 63% against the previous month. The exports peaked at 201K units in July 2023; afterwards, it flattened through to October 2023.
In value terms, exports of domestic, non-electric, cooking or heating appliances surged to $59M (IndexBox estimates) in October 2023. Overall, total exports indicated a measured increase from October 2022 to October 2023: its value increased at an average monthly rate of +3.7% over the last twelve months. The trend pattern, however, indicated some noticeable fluctuations being recorded throughout the analyzed period. Based on October 2023 figures, exports decreased by -7.1% against August 2023 indices. The most prominent rate of growth was recorded in February 2023 with an increase of 53% month-to-month. Over the period under review, the exports of reached the maximum at 69M units in March 2023; however, from April 2023 to October 2023, the exports remained at a lower figure.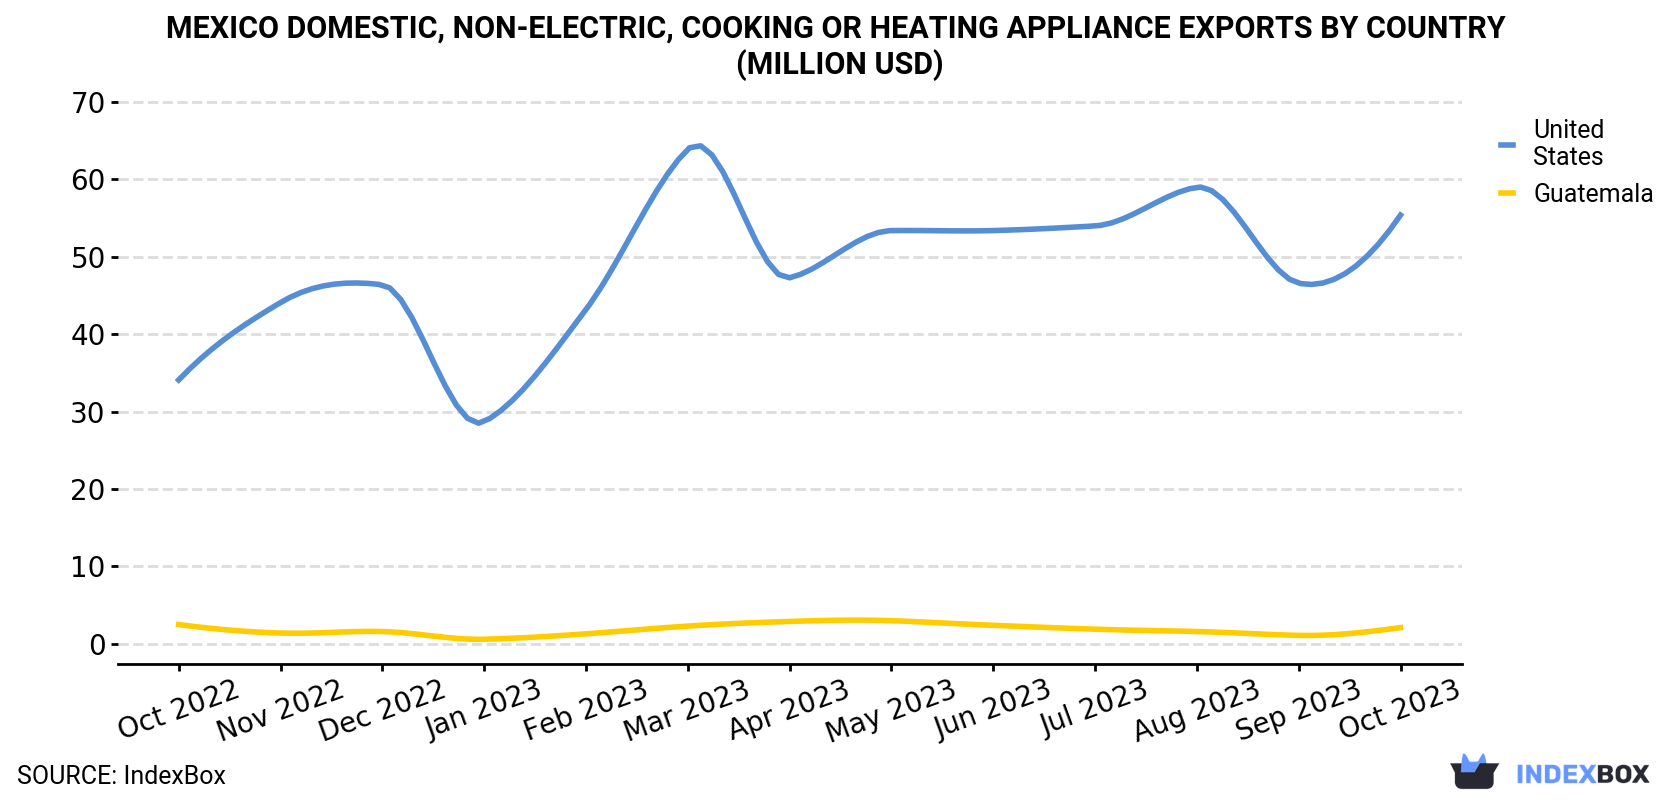
| COUNTRY | Export Value of Domestic, Non-Electric, Cooking Or Heating Appliance in Mexico (million USD) | ||||||||||||
|---|---|---|---|---|---|---|---|---|---|---|---|---|---|
| Oct 2022 | Nov 2022 | Dec 2022 | Jan 2023 | Feb 2023 | Mar 2023 | Apr 2023 | May 2023 | Jun 2023 | Jul 2023 | Aug 2023 | Sep 2023 | Oct 2023 | |
| United States | 34.1 | 44.1 | 46.4 | 28.7 | 43.2 | 63.9 | 47.3 | 53.4 | 53.4 | 54.0 | 59.0 | 46.6 | 55.4 |
| Guatemala | 2.5 | 1.4 | 1.6 | 0.6 | 1.3 | 2.3 | 2.9 | 3.0 | 2.4 | 1.9 | 1.6 | 1.1 | 2.1 |
| Others | 1.4 | 1.9 | 2.9 | 0.3 | 0.9 | 3.2 | 3.4 | 2.1 | 3.3 | 3.2 | 2.6 | 1.4 | 1.2 |
| Total | 37.9 | 47.4 | 50.9 | 29.6 | 45.4 | 69.4 | 53.5 | 58.6 | 59.1 | 59.2 | 63.1 | 49.1 | 58.7 |
Exports by Country
The United States (146K units) was the main destination for exports of domestic, non-electric, cooking or heating appliances from Mexico, with a 91% share of total exports. Moreover, exports of domestic, non-electric, cooking or heating appliances to the United States exceeded the volume sent to the second major destination, Guatemala (10K units), more than tenfold.
From October 2022 to October 2023, the average monthly rate of growth in terms of volume to the United States totaled +3.9%.
In value terms, the United States ($55M) remains the key foreign market for domestic, non-electric, cooking or heating appliance exports from Mexico, comprising 94% of total exports. The second position in the ranking was held by Guatemala ($2.1M), with a 3.5% share of total exports.
From October 2022 to October 2023, the average monthly rate of growth in terms of value to the United States amounted to +4.1%.
Exports by Type
Iron or steel gas domestic cooking appliances and plate warmers (160K units) was the largest type of domestic, non-electric, cooking or heating appliance exported from Mexico, accounting for a 100% share of total exports. It was followed by cooking appliances and plate warmers; for solid fuel and fuels other than gas or liquid, of iron or steel (707 units), with a 0.4% share of total exports.
From October 2022 to October 2023, the average monthly rate of growth in terms of the volume of export of iron or steel gas domestic cooking appliances and plate warmers stood at +3.5%.
In value terms, iron or steel gas domestic cooking appliances and plate warmers ($59M) remains the largest type of domestic, non-electric, cooking or heating appliance exported from Mexico, comprising 100% of total exports. The second position in the ranking was taken by cooking appliances and plate warmers; for solid fuel and fuels other than gas or liquid, of iron or steel ($114K), with a 0.2% share of total exports.
From October 2022 to October 2023, the average monthly rate of growth in terms of the export volume of iron or steel gas domestic cooking appliances and plate warmers stood at +3.7%.
Export Prices by Country
In October 2023, the domestic, non-electric, cooking or heating appliance price amounted to $365 per unit (FOB, Mexico), surging by 2.8% against the previous month. In general, the export price recorded a relatively flat trend pattern. The pace of growth appeared the most rapid in August 2023 an increase of 21% m-o-m. The export price peaked at $380 per unit in February 2023; however, from March 2023 to October 2023, the export prices remained at a lower figure.
There were significant differences in the average prices for the major foreign markets. In October 2023, the country with the highest price was the United States ($380 per unit), while the average price for exports to Guatemala ($208 per unit) was amongst the lowest.
From October 2022 to October 2023, the most notable rate of growth in terms of prices was recorded for supplies to the United States (+0.3%), while the prices for the other major destinations experienced mixed trend patterns.
This report provides an in-depth analysis of the market for domestic, non-electric, cooking or heating appliance in Mexico. Within it, you will discover the latest data on market trends and opportunities by country, consumption, production and price developments, as well as the global trade (imports and exports). The forecast exhibits the market prospects through 2030.
Product coverage:
- Prodcom 27521113 - Iron or steel gas domestic cooking appliances and plate warmers, with an oven (including those with subsidiary boilers for central heating, separate ovens for both gas and other fuels)
- Prodcom 27521115 - Iron or steel gas domestic cooking appliances and plate warmers (including those with subsidiary boilers for central heating, for both gas and other fuels, excluding those with ovens)
- Prodcom 27521190 - Other domestic cooking appliances and plate warmers, of iron or steel or of copper, non-electric
Country coverage:
- Mexico
Data coverage:
- Market volume and value
- Per Capita consumption
- Forecast of the market dynamics in the medium term
- Trade (exports and imports) in Mexico
- Export and import prices
- Market trends, drivers and restraints
- Key market players and their profiles
Reasons to buy this report:
- Take advantage of the latest data
- Find deeper insights into current market developments
- Discover vital success factors affecting the market
This report is designed for manufacturers, distributors, importers, and wholesalers, as well as for investors, consultants and advisors.
In this report, you can find information that helps you to make informed decisions on the following issues:
- How to diversify your business and benefit from new market opportunities
- How to load your idle production capacity
- How to boost your sales on overseas markets
- How to increase your profit margins
- How to make your supply chain more sustainable
- How to reduce your production and supply chain costs
- How to outsource production to other countries
- How to prepare your business for global expansion
While doing this research, we combine the accumulated expertise of our analysts and the capabilities of artificial intelligence. The AI-based platform, developed by our data scientists, constitutes the key working tool for business analysts, empowering them to discover deep insights and ideas from the marketing data.
-
1. INTRODUCTION
Making Data-Driven Decisions to Grow Your Business
- REPORT DESCRIPTION
- RESEARCH METHODOLOGY AND AI PLATFORM
- DATA-DRIVEN DECISIONS FOR YOUR BUSINESS
- GLOSSARY AND SPECIFIC TERMS
-
2. EXECUTIVE SUMMARY
A Quick Overview of Market Performance
- KEY FINDINGS
- MARKET TRENDS This Chapter is Available Only for the Professional Edition PRO
-
3. MARKET OVERVIEW
Understanding the Current State of The Market and Its Prospects
- MARKET SIZE
- MARKET STRUCTURE
- TRADE BALANCE
- PER CAPITA CONSUMPTION
- MARKET FORECAST TO 2030
-
4. MOST PROMISING PRODUCT
Finding New Products to Diversify Your Business
This Chapter is Available Only for the Professional Edition PRO- TOP PRODUCTS TO DIVERSIFY YOUR BUSINESS
- BEST-SELLING PRODUCTS
- MOST CONSUMED PRODUCT
- MOST TRADED PRODUCT
- MOST PROFITABLE PRODUCT FOR EXPORT
-
5. MOST PROMISING SUPPLYING COUNTRIES
Choosing the Best Countries to Establish Your Sustainable Supply Chain
This Chapter is Available Only for the Professional Edition PRO- TOP COUNTRIES TO SOURCE YOUR PRODUCT
- TOP PRODUCING COUNTRIES
- TOP EXPORTING COUNTRIES
- LOW-COST EXPORTING COUNTRIES
-
6. MOST PROMISING OVERSEAS MARKETS
Choosing the Best Countries to Boost Your Exports
This Chapter is Available Only for the Professional Edition PRO- TOP OVERSEAS MARKETS FOR EXPORTING YOUR PRODUCT
- TOP CONSUMING MARKETS
- UNSATURATED MARKETS
- TOP IMPORTING MARKETS
- MOST PROFITABLE MARKETS
7. PRODUCTION
The Latest Trends and Insights into The Industry
- PRODUCTION VOLUME AND VALUE
8. IMPORTS
The Largest Import Supplying Countries
- IMPORTS FROM 2012–2023
- IMPORTS BY COUNTRY
- IMPORT PRICES BY COUNTRY
9. EXPORTS
The Largest Destinations for Exports
- EXPORTS FROM 2012–2023
- EXPORTS BY COUNTRY
- EXPORT PRICES BY COUNTRY
-
10. PROFILES OF MAJOR PRODUCERS
The Largest Producers on The Market and Their Profiles
This Chapter is Available Only for the Professional Edition PRO -
LIST OF TABLES
- Key Findings In 2023
- Market Volume, In Physical Terms, 2012–2023
- Market Value, 2012–2023
- Per Capita Consumption In 2012-2023
- Imports, In Physical Terms, By Country, 2012–2023
- Imports, In Value Terms, By Country, 2012–2023
- Import Prices, By Country Of Origin, 2012–2023
- Exports, In Physical Terms, By Country, 2012–2023
- Exports, In Value Terms, By Country, 2012–2023
- Export Prices, By Country Of Destination, 2012–2023
-
LIST OF FIGURES
- Market Volume, In Physical Terms, 2012–2023
- Market Value, 2012–2023
- Market Structure – Domestic Supply vs. Imports, In Physical Terms, 2012-2023
- Market Structure – Domestic Supply vs. Imports, In Value Terms, 2012-2023
- Trade Balance, In Physical Terms, 2012-2023
- Trade Balance, In Value Terms, 2012-2023
- Per Capita Consumption, 2012-2023
- Market Volume Forecast to 2030
- Market Value Forecast to 2030
- Products: Market Size And Growth, By Type
- Products: Average Per Capita Consumption, By Type
- Products: Exports And Growth, By Type
- Products: Export Prices And Growth, By Type
- Production Volume And Growth
- Exports And Growth
- Export Prices And Growth
- Market Size And Growth
- Per Capita Consumption
- Imports And Growth
- Import Prices
- Production, In Physical Terms, 2012–2023
- Production, In Value Terms, 2012–2023
- Imports, In Physical Terms, 2012–2023
- Imports, In Value Terms, 2012–2023
- Imports, In Physical Terms, By Country, 2023
- Imports, In Physical Terms, By Country, 2012–2023
- Imports, In Value Terms, By Country, 2012–2023
- Import Prices, By Country Of Origin, 2012–2023
- Exports, In Physical Terms, 2012–2023
- Exports, In Value Terms, 2012–2023
- Exports, In Physical Terms, By Country, 2023
- Exports, In Physical Terms, By Country, 2012–2023
- Exports, In Value Terms, By Country, 2012–2023
- Export Prices, By Country Of Destination, 2012–2023


