World - Ceramic Statuettes And Other Ornamental Articles - Market Analysis, Forecast, Size, Trends And Insights
Get instant access to more than 2 million reports, dashboards, and datasets on the IndexBox Platform.
View PricingGlobal Ceramic Statuettes Market to Experience Slow Growth from 2023 to 2030
IndexBox has just published a new report: World - Ceramic Statuettes And Other Ornamental Articles - Market Analysis, Forecast, Size, Trends And Insights.
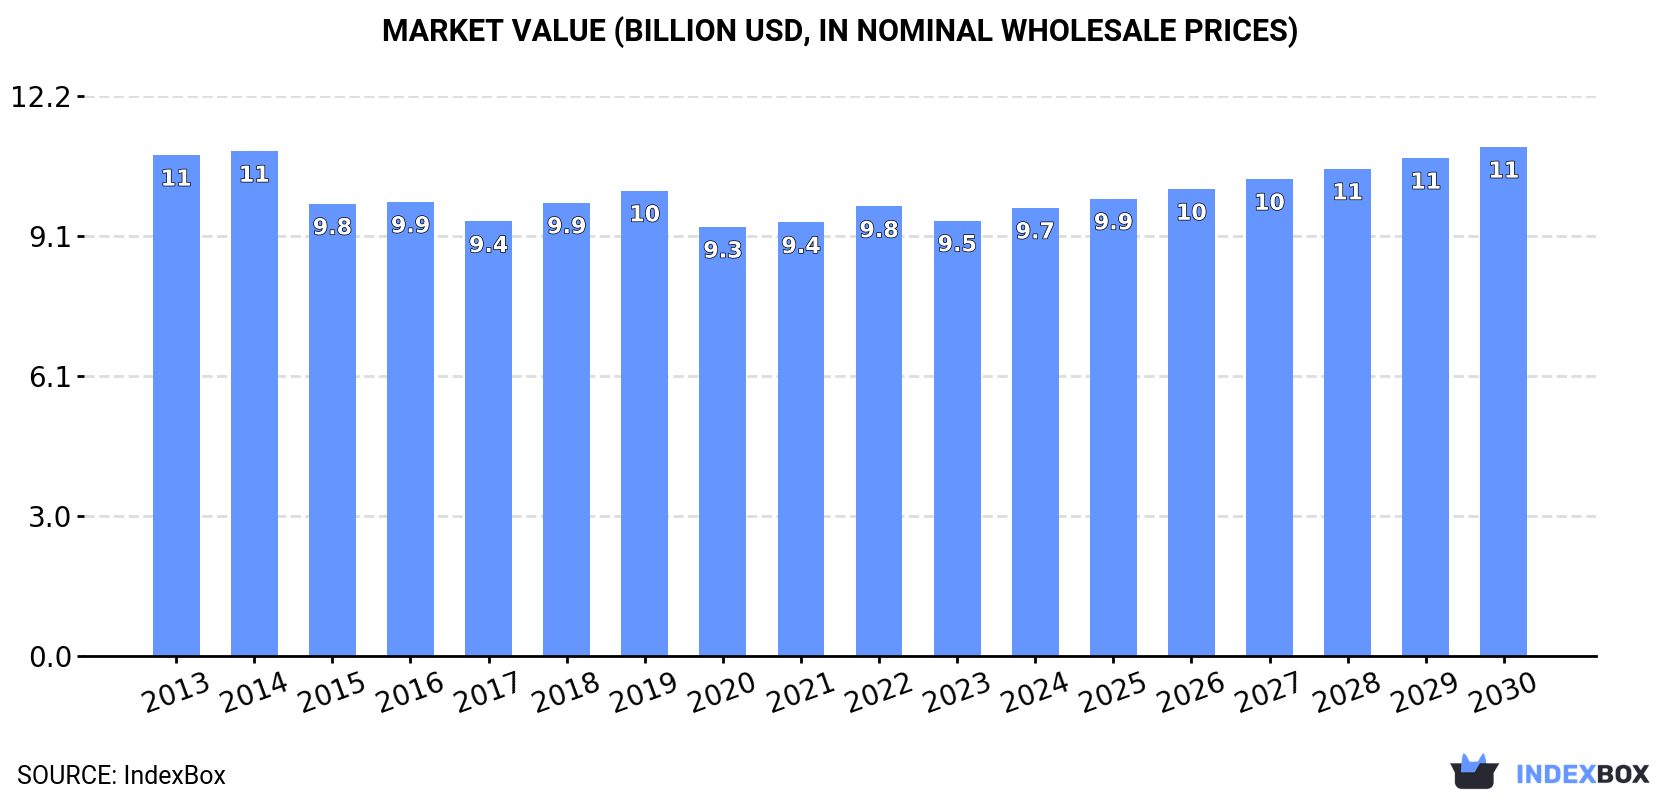
The global market for ceramic statuettes and ornamental articles is on the rise, driven by increasing demand worldwide. By 2030, market volume is expected to reach 2.1M tons and market value is projected to hit $11.1B, indicating a steady growth trend over the next seven years.
Market Forecast
Driven by increasing demand for ceramic statuettes and other ornamental articles worldwide, the market is expected to continue an upward consumption trend over the next seven-year period. In value terms, the market is forecast to increase with an anticipated CAGR of +2.3% for the period from 2023 to 2030, which is projected to bring the market value to $11.1B (in nominal wholesale prices) by the end of 2030.
Consumption
World Consumption of Ceramic Statuettes And Other Ornamental Articles
Global ceramic statuette consumption fell slightly to 2.1M tons in 2023, waning by -4.5% compared with 2022 figures. The total consumption volume increased at an average annual rate of +1.1% over the period from 2013 to 2023; the trend pattern remained relatively stable, with only minor fluctuations throughout the analyzed period. The growth pace was the most rapid in 2018 with an increase of 8.7%. Over the period under review, global consumption hit record highs at 2.2M tons in 2021; however, from 2022 to 2023, consumption failed to regain momentum.
The global ceramic statuette market value fell to $9.5B in 2023, which is down by -3.1% against the previous year. This figure reflects the total revenues of producers and importers (excluding logistics costs, retail marketing costs, and retailers' margins, which will be included in the final consumer price). Over the period under review, consumption continues to indicate a slight descent. The pace of growth appeared the most rapid in 2018 when the market value increased by 4.3% against the previous year. Global consumption peaked at $11B in 2014; however, from 2015 to 2023, consumption stood at a somewhat lower figure.
Consumption By Country
The United States (927K tons) constituted the country with the largest volume of ceramic statuette consumption, comprising approx. 45% of total volume. Moreover, ceramic statuette consumption in the United States exceeded the figures recorded by the second-largest consumer, China (343K tons), threefold. India (114K tons) ranked third in terms of total consumption with a 5.5% share.
In the United States, ceramic statuette consumption increased at an average annual rate of +2.4% over the period from 2013-2023. The remaining consuming countries recorded the following average annual rates of consumption growth: China (+3.0% per year) and India (+0.4% per year).
In value terms, the largest ceramic statuette markets worldwide were Japan ($2.9B), the United States ($2.8B) and China ($1.3B), together comprising 74% of the global market. India, Germany, Indonesia, Mexico and Pakistan lagged somewhat behind, together comprising a further 9.1%.
In terms of the main consuming countries, Indonesia, with a CAGR of +7.7%, recorded the highest rates of growth with regard to market size over the period under review, while market for the other global leaders experienced more modest paces of growth.
In 2023, the highest levels of ceramic statuette per capita consumption was registered in the United States (2,749 kg per 1000 persons), followed by Germany (772 kg per 1000 persons), Japan (460 kg per 1000 persons) and Mexico (350 kg per 1000 persons), while the world average per capita consumption of ceramic statuette was estimated at 262 kg per 1000 persons.
In the United States, ceramic statuette per capita consumption increased at an average annual rate of +1.8% over the period from 2013-2023. In the other countries, the average annual rates were as follows: Germany (+3.1% per year) and Japan (-2.4% per year).
Production
World Production of Ceramic Statuettes And Other Ornamental Articles
In 2023, production of ceramic statuettes and other ornamental articles decreased by -2.5% to 2M tons for the first time since 2020, thus ending a two-year rising trend. In general, production, however, saw a slight increase. The pace of growth appeared the most rapid in 2018 when the production volume increased by 9% against the previous year. Over the period under review, global production attained the maximum volume at 2.1M tons in 2022, and then declined slightly in the following year.
In value terms, ceramic statuette production reached $9B in 2023 estimated in export price. Overall, production saw a mild contraction. The growth pace was the most rapid in 2014 when the production volume increased by 4.9%. As a result, production reached the peak level of $10.8B. From 2015 to 2023, global production growth remained at a lower figure.
Production By Country
The countries with the highest volumes of production in 2023 were the United States (744K tons), China (475K tons) and India (112K tons), together accounting for 66% of global production. Germany, Vietnam, Japan, Indonesia, Mexico, Pakistan and Portugal lagged somewhat behind, together accounting for a further 20%.
From 2013 to 2023, the most notable rate of growth in terms of production, amongst the leading producing countries, was attained by Germany (with a CAGR of +8.3%), while production for the other global leaders experienced more modest paces of growth.
Imports
World Imports of Ceramic Statuettes And Other Ornamental Articles
In 2023, approx. 428K tons of ceramic statuettes and other ornamental articles were imported worldwide; reducing by -26.2% compared with 2022. In general, imports, however, showed a relatively flat trend pattern. The most prominent rate of growth was recorded in 2021 when imports increased by 49%. As a result, imports reached the peak of 638K tons. From 2022 to 2023, the growth of global imports remained at a lower figure.
In value terms, ceramic statuette imports dropped notably to $1.3B in 2023. Overall, total imports indicated a mild expansion from 2013 to 2023: its value increased at an average annual rate of +1.3% over the last decade. The trend pattern, however, indicated some noticeable fluctuations being recorded throughout the analyzed period. The most prominent rate of growth was recorded in 2021 with an increase of 40% against the previous year. Over the period under review, global imports attained the maximum at $1.7B in 2022, and then reduced sharply in the following year.
Imports By Country
The United States was the largest importer of ceramic statuettes and other ornamental articles in the world, with the volume of imports amounting to 183K tons, which was approx. 43% of total imports in 2023. The Netherlands (32K tons) held a 7.5% share (based on physical terms) of total imports, which put it in second place, followed by Germany (5.6%). The UK (19K tons), France (18K tons), Poland (12K tons), Italy (11K tons), Belgium (9.4K tons), Sweden (8K tons) and Canada (8K tons) followed a long way behind the leaders.
Imports into the United States increased at an average annual rate of +4.8% from 2013 to 2023. At the same time, Poland (+6.9%), Canada (+4.5%) and Belgium (+2.4%) displayed positive paces of growth. Moreover, Poland emerged as the fastest-growing importer imported in the world, with a CAGR of +6.9% from 2013-2023. The UK, Italy, France and Sweden experienced a relatively flat trend pattern. By contrast, the Netherlands (-1.5%) and Germany (-4.1%) illustrated a downward trend over the same period. From 2013 to 2023, the share of the United States increased by +14 percentage points. The shares of the other countries remained relatively stable throughout the analyzed period.
In value terms, the United States ($429M) constitutes the largest market for imported ceramic statuettes and other ornamental articles worldwide, comprising 34% of global imports. The second position in the ranking was taken by Germany ($94M), with a 7.5% share of global imports. It was followed by the Netherlands, with a 6.3% share.
From 2013 to 2023, the average annual growth rate of value in the United States amounted to +2.2%. The remaining importing countries recorded the following average annual rates of imports growth: Germany (-0.2% per year) and the Netherlands (+1.8% per year).
Import Prices By Country
In 2023, the average ceramic statuette import price amounted to $2,944 per ton, falling by -1.8% against the previous year. In general, the import price, however, saw a relatively flat trend pattern. The most prominent rate of growth was recorded in 2022 an increase of 20% against the previous year. As a result, import price reached the peak level of $2,998 per ton, and then shrank slightly in the following year.
Prices varied noticeably by country of destination: amid the top importers, the country with the highest price was Germany ($3,895 per ton), while the United States ($2,348 per ton) was amongst the lowest.
From 2013 to 2023, the most notable rate of growth in terms of prices was attained by Poland (+6.1%), while the other global leaders experienced more modest paces of growth.
Exports
World Exports of Ceramic Statuettes And Other Ornamental Articles
In 2023, overseas shipments of ceramic statuettes and other ornamental articles decreased by -22.7% to 363K tons, falling for the second consecutive year after five years of growth. Overall, exports saw a relatively flat trend pattern. The pace of growth appeared the most rapid in 2021 when exports increased by 27%. As a result, the exports reached the peak of 483K tons. From 2022 to 2023, the growth of the global exports remained at a lower figure.
In value terms, ceramic statuette exports fell remarkably to $1.3B in 2023. In general, total exports indicated a slight increase from 2013 to 2023: its value increased at an average annual rate of +1.2% over the last decade. The trend pattern, however, indicated some noticeable fluctuations being recorded throughout the analyzed period. The pace of growth appeared the most rapid in 2021 with an increase of 31% against the previous year. Over the period under review, the global exports attained the maximum at $1.6B in 2022, and then fell significantly in the following year.
Exports By Country
In 2023, China (133K tons) was the main exporter of ceramic statuettes and other ornamental articles, constituting 37% of total exports. It was distantly followed by Vietnam (58K tons), Germany (46K tons), Portugal (33K tons) and the Netherlands (28K tons), together mixing up a 45% share of total exports. Mexico (8K tons) followed a long way behind the leaders.
Exports from China decreased at an average annual rate of -2.3% from 2013 to 2023. At the same time, the Netherlands (+7.9%), Germany (+4.6%), Portugal (+4.6%) and Vietnam (+1.7%) displayed positive paces of growth. Moreover, the Netherlands emerged as the fastest-growing exporter exported in the world, with a CAGR of +7.9% from 2013-2023. By contrast, Mexico (-13.7%) illustrated a downward trend over the same period. Germany (+4.7 p.p.), the Netherlands (+4.1 p.p.), Portugal (+3.4 p.p.) and Vietnam (+2.6 p.p.) significantly strengthened its position in terms of the global exports, while Mexico and China saw its share reduced by -7.3% and -8.9% from 2013 to 2023, respectively.
In value terms, China ($486M) remains the largest ceramic statuette supplier worldwide, comprising 37% of global exports. The second position in the ranking was taken by Vietnam ($178M), with a 14% share of global exports. It was followed by Germany, with an 8.6% share.
In China, ceramic statuette exports shrank by an average annual rate of -2.7% over the period from 2013-2023. In the other countries, the average annual rates were as follows: Vietnam (+6.6% per year) and Germany (+3.1% per year).
Export Prices By Country
In 2023, the average ceramic statuette export price amounted to $3,589 per ton, surging by 4.5% against the previous year. Over the period from 2013 to 2023, it increased at an average annual rate of +1.3%. The pace of growth appeared the most rapid in 2015 an increase of 8.4% against the previous year. The global export price peaked in 2023 and is expected to retain growth in the immediate term.
Prices varied noticeably by country of origin: amid the top suppliers, the country with the highest price was China ($3,649 per ton), while Mexico ($1,367 per ton) was amongst the lowest.
From 2013 to 2023, the most notable rate of growth in terms of prices was attained by Mexico (+5.5%), while the other global leaders experienced more modest paces of growth.
This report provides an in-depth analysis of the global ceramic statuette market. Within it, you will discover the latest data on market trends and opportunities by country, consumption, production and price developments, as well as the global trade (imports and exports). The forecast exhibits the market prospects through 2030.
Product coverage:
- Prodcom 23411350 - Ceramic statuettes and other ornamental articles
Country coverage:
Worldwide - the report contains statistical data for 200 countries and includes detailed profiles of the 50 largest consuming countries:
- USA
- China
- Japan
- Germany
- United Kingdom
- France
- Brazil
- Italy
- Russian Federation
- India
- Canada
- Australia
- Republic of Korea
- Spain
- Mexico
- Indonesia
- Netherlands
- Turkey
- Saudi Arabia
- Switzerland
- Sweden
- Nigeria
- Poland
- Belgium
- Argentina
- Norway
- Austria
- Thailand
- United Arab Emirates
- Colombia
- Denmark
- South Africa
- Malaysia
- Israel
- Singapore
- Egypt
- Philippines
- Finland
- Chile
- Ireland
- Pakistan
- Greece
- Portugal
- Kazakhstan
- Algeria
- Czech Republic
- Qatar
- Peru
- Romania
- Vietnam
+ the largest producing countries
Data coverage:
- Global market volume and value
- Per Capita consumption
- Forecast of the market dynamics in the medium term
- Global production, split by region and country
- Global trade (exports and imports)
- Export and import prices
- Market trends, drivers and restraints
- Key market players and their profiles
Reasons to buy this report:
- Take advantage of the latest data
- Find deeper insights into current market developments
- Discover vital success factors affecting the market
This report is designed for manufacturers, distributors, importers, and wholesalers, as well as for investors, consultants and advisors.
In this report, you can find information that helps you to make informed decisions on the following issues:
- How to diversify your business and benefit from new market opportunities
- How to load your idle production capacity
- How to boost your sales on overseas markets
- How to increase your profit margins
- How to make your supply chain more sustainable
- How to reduce your production and supply chain costs
- How to outsource production to other countries
- How to prepare your business for global expansion
While doing this research, we combine the accumulated expertise of our analysts and the capabilities of artificial intelligence. The AI-based platform, developed by our data scientists, constitutes the key working tool for business analysts, empowering them to discover deep insights and ideas from the marketing data.
-
1. INTRODUCTION
Making Data-Driven Decisions to Grow Your Business
- REPORT DESCRIPTION
- RESEARCH METHODOLOGY AND AI PLATFORM
- DATA-DRIVEN DECISIONS FOR YOUR BUSINESS
- GLOSSARY AND SPECIFIC TERMS
-
2. EXECUTIVE SUMMARY
A Quick Overview of Market Performance
- KEY FINDINGS
- MARKET TRENDS This Chapter is Available Only for the Professional Edition PRO
-
3. MARKET OVERVIEW
Understanding the Current State of The Market and Its Prospects
- MARKET SIZE
- CONSUMPTION BY COUNTRY
- MARKET FORECAST TO 2030
-
4. MOST PROMISING PRODUCT
Finding New Products to Diversify Your Business
This Chapter is Available Only for the Professional Edition PRO- TOP PRODUCTS TO DIVERSIFY YOUR BUSINESS
- BEST-SELLING PRODUCTS
- MOST CONSUMED PRODUCT
- MOST TRADED PRODUCT
- MOST PROFITABLE PRODUCT FOR EXPORT
-
5. MOST PROMISING SUPPLYING COUNTRIES
Choosing the Best Countries to Establish Your Sustainable Supply Chain
This Chapter is Available Only for the Professional Edition PRO- TOP COUNTRIES TO SOURCE YOUR PRODUCT
- TOP PRODUCING COUNTRIES
- TOP EXPORTING COUNTRIES
- LOW-COST EXPORTING COUNTRIES
-
6. MOST PROMISING OVERSEAS MARKETS
Choosing the Best Countries to Boost Your Exports
This Chapter is Available Only for the Professional Edition PRO- TOP OVERSEAS MARKETS FOR EXPORTING YOUR PRODUCT
- TOP CONSUMING MARKETS
- UNSATURATED MARKETS
- TOP IMPORTING MARKETS
- MOST PROFITABLE MARKETS
7. GLOBAL PRODUCTION
The Latest Trends and Insights into The Industry
- PRODUCTION VOLUME AND VALUE
- PRODUCTION BY COUNTRY
8. GLOBAL IMPORTS
The Largest Importers on The Market and How They Succeed
- IMPORTS FROM 2012–2023
- IMPORTS BY COUNTRY
- IMPORT PRICES BY COUNTRY
9. GLOBAL EXPORTS
The Largest Exporters on The Market and How They Succeed
- EXPORTS FROM 2012–2023
- EXPORTS BY COUNTRY
- EXPORT PRICES BY COUNTRY
-
10. PROFILES OF MAJOR PRODUCERS
The Largest Producers on The Market and Their Profiles
This Chapter is Available Only for the Professional Edition PRO -
11. COUNTRY PROFILES
The Largest Markets And Their Profiles
This Chapter is Available Only for the Professional Edition PRO- United States
- China
- Japan
- Germany
- United Kingdom
- France
- Brazil
- Italy
- Russian Federation
- India
- Canada
- Australia
- Republic of Korea
- Spain
- Mexico
- Indonesia
- Netherlands
- Turkey
- Saudi Arabia
- Switzerland
- Sweden
- Nigeria
- Poland
- Belgium
- Argentina
- Norway
- Austria
- Thailand
- United Arab Emirates
- Colombia
- Denmark
- South Africa
- Malaysia
- Israel
- Singapore
- Egypt
- Philippines
- Finland
- Chile
- Ireland
- Pakistan
- Greece
- Portugal
- Kazakhstan
- Algeria
- Czech Republic
- Qatar
- Peru
- Romania
- Vietnam
-
LIST OF TABLES
- Key Findings In 2023
- Market Volume, In Physical Terms, 2012–2023
- Market Value, 2012–2023
- Per Capita Consumption, By Country, 2018–2023
- Production, In Physical Terms, By Country, 2012–2023
- Imports, In Physical Terms, By Country, 2012–2023
- Imports, In Value Terms, By Country, 2012–2023
- Import Prices, By Country Of Destination, 2012–2023
- Exports, In Physical Terms, By Country, 2012–2023
- Exports, In Value Terms, By Country, 2012–2023
- Export Prices, By Country Of Origin, 2012–2023
-
LIST OF FIGURES
- Market Volume, In Physical Terms, 2012–2023
- Market Value, 2012–2023
- Consumption, By Country, 2023
- Market Volume Forecast to 2030
- Market Value Forecast to 2030
- Products: Market Size And Growth, By Type
- Products: Average Per Capita Consumption, By Type
- Products: Exports And Growth, By Type
- Products: Export Prices And Growth, By Type
- Production Volume And Growth
- Exports And Growth
- Export Prices And Growth
- Market Size And Growth
- Per Capita Consumption
- Imports And Growth
- Import Prices
- Production, In Physical Terms, 2012–2023
- Production, In Value Terms, 2012–2023
- Production, By Country, 2023
- Production, In Physical Terms, By Country, 2012–2023
- Imports, In Physical Terms, 2012–2023
- Imports, In Value Terms, 2012–2023
- Imports, In Physical Terms, By Country, 2023
- Imports, In Physical Terms, By Country, 2012–2023
- Imports, In Value Terms, By Country, 2012–2023
- Import Prices, By Country, 2012–2023
- Exports, In Physical Terms, 2012–2023
- Exports, In Value Terms, 2012–2023
- Exports, In Physical Terms, By Country, 2023
- Exports, In Physical Terms, By Country, 2012–2023
- Exports, In Value Terms, By Country, 2012–2023
- Export Prices, 2012–2023


