
China - Textile Products And Articles For Technical Uses - Market Analysis, Forecast, Size, Trends and Insights
Get instant access to more than 2 million reports, dashboards, and datasets on the IndexBox Platform.
View PricingChina's Export of Technical Textiles Falls by 4% to $1.1B in 2023
China Technical Textiles Exports
For the third consecutive year, China recorded growth in shipments abroad of textile products and articles for technical uses, which increased by 4.6% to 165K tons in 2023. Overall, exports continue to indicate a strong expansion. The growth pace was the most rapid in 2017 with an increase of 132% against the previous year. Over the period under review, the exports hit record highs in 2023 and are expected to retain growth in the near future.
In value terms, technical textiles exports contracted to $1.1B (IndexBox estimates) in 2023. Over the period under review, total exports indicated a strong expansion from 2013 to 2023: its value increased at an average annual rate of +5.0% over the last decade. The trend pattern, however, indicated some noticeable fluctuations being recorded throughout the analyzed period. Based on 2023 figures, exports increased by +43.6% against 2014 indices. The most prominent rate of growth was recorded in 2021 with an increase of 24% against the previous year. Over the period under review, the exports hit record highs at $1.1B in 2022, and then reduced in the following year.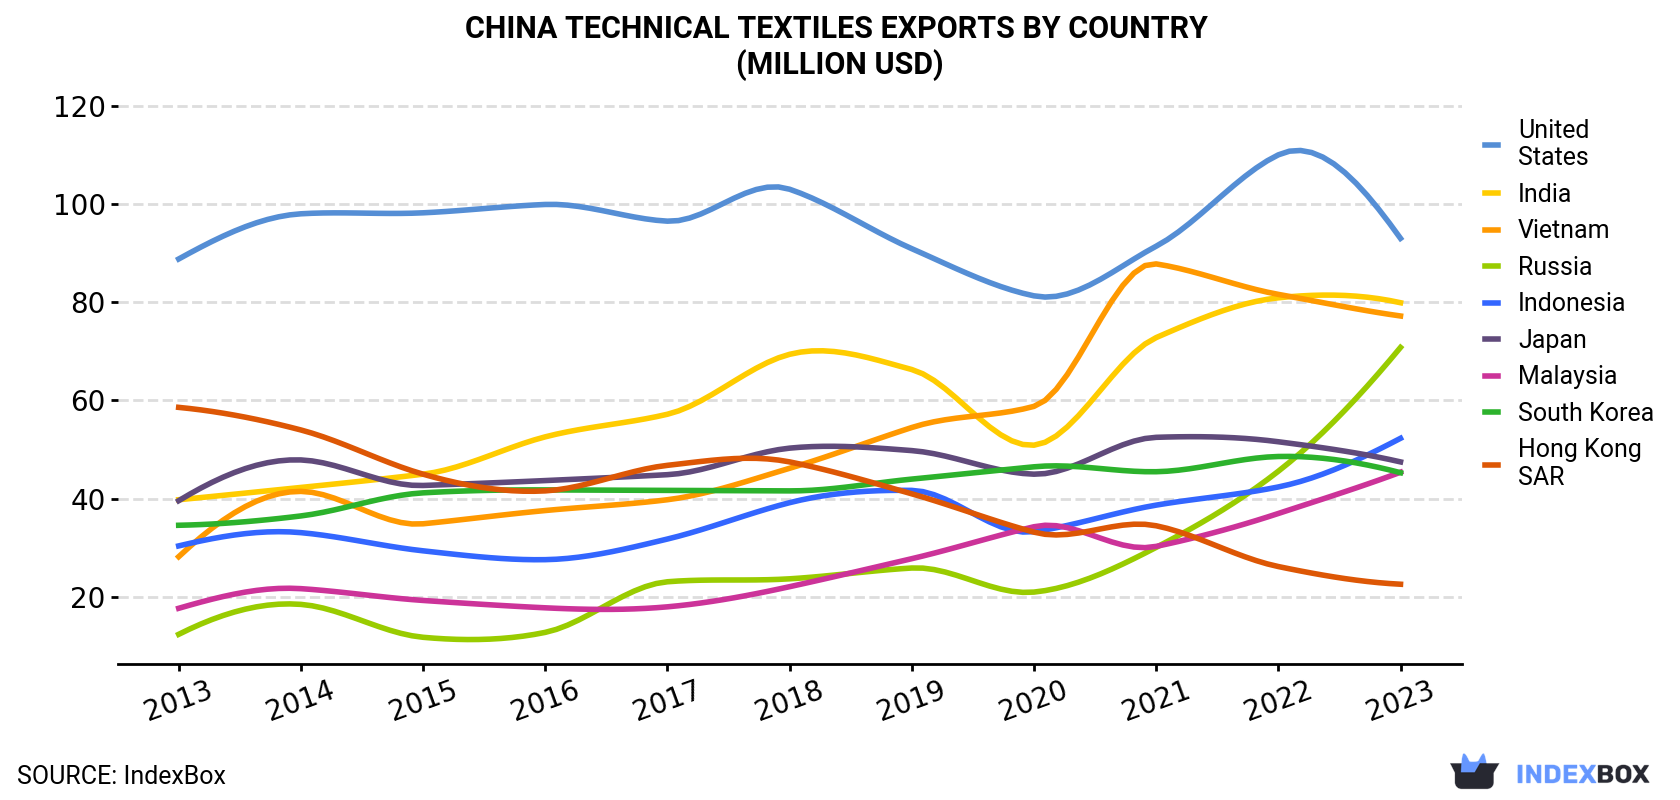
| COUNTRY | Export Value of Technical Textiles in China (million USD) | ||||||||||
|---|---|---|---|---|---|---|---|---|---|---|---|
| 2013 | 2014 | 2015 | 2016 | 2017 | 2018 | 2019 | 2020 | 2021 | 2022 | 2023 | |
| United States | 88.8 | 98.0 | 98.2 | 99.9 | 96.5 | 103 | 90.9 | 81.3 | 91.4 | 110 | 93.0 |
| India | 39.8 | 42.3 | 45.0 | 52.6 | 57.2 | 69.4 | 66.3 | 50.9 | 72.8 | 80.9 | 79.9 |
| Vietnam | 28.2 | 41.5 | 34.9 | 37.6 | 39.8 | 46.2 | 54.5 | 58.8 | 87.8 | 81.6 | 77.2 |
| Russia | 12.4 | 18.5 | 11.8 | 12.8 | 23.1 | 23.7 | 25.9 | 21.0 | 30.1 | 45.6 | 70.8 |
| Indonesia | 30.4 | 33.1 | 29.4 | 27.6 | 31.8 | 39.2 | 41.7 | 33.3 | 38.7 | 42.4 | 52.3 |
| Japan | 39.6 | 47.9 | 42.7 | 43.7 | 44.9 | 50.3 | 49.8 | 45.0 | 52.5 | 51.6 | 47.5 |
| Malaysia | 17.7 | 21.7 | 19.3 | 17.8 | 18.0 | 22.1 | 27.8 | 34.3 | 30.3 | 37.0 | 45.4 |
| South Korea | 34.6 | 36.5 | 41.2 | 41.8 | 41.7 | 41.6 | 44.0 | 46.5 | 45.5 | 48.6 | 45.3 |
| Hong Kong | 58.6 | 54.0 | 45.0 | 41.6 | 46.8 | 47.5 | 41.0 | 33.2 | 34.5 | 26.2 | 22.6 |
| Others | 328 | 374 | 347 | 349 | 366 | 408 | 454 | 447 | 572 | 621 | 568 |
| Total | 678 | 768 | 715 | 725 | 766 | 851 | 896 | 852 | 1,056 | 1,145 | 1,102 |
Exports by Country
India (15K tons), the United States (14K tons) and Vietnam (9.1K tons) were the main destinations of technical textiles exports from China, together comprising 23% of total exports. Russia, Malaysia, Indonesia, South Korea, Japan and Hong Kong lagged somewhat behind, together comprising a further 19%.
From 2013 to 2023, the most notable rate of growth in terms of shipments, amongst the main countries of destination, was attained by Russia (with a CAGR of +12.1%), while the other leaders experienced more modest paces of growth.
In value terms, the United States ($93M), India ($80M) and Vietnam ($77M) constituted the largest markets for technical textiles exported from China worldwide, together accounting for 23% of total exports. Russia, Indonesia, Japan, Malaysia, South Korea and Hong Kong lagged somewhat behind, together comprising a further 26%.
Russia, with a CAGR of +19.0%, saw the highest growth rate of the value of exports, among the main countries of destination over the period under review, while shipments for the other leaders experienced more modest paces of growth.
Exports by Type
Textile products and articles for technical uses; specified in note 7 to this chapter (90K tons) was the largest type of textile products and articles for technical uses exported from China, accounting for a 54% share of total exports. Moreover, textile products and articles for technical uses; specified in note 7 to this chapter exceeded the volume of the second product type, textile hosepiping and similar textile tubing (40K tons), twofold. The third position in this ranking was held by textiles; transmission or conveyor belts or belting, of textile material, whether or not reinforced with metal or other material (35K tons), with a 21% share.
From 2013 to 2023, the average annual rate of growth in terms of the volume of textile products and articles for technical uses; specified in note 7 to this chapter exports totaled +6.8%. With regard to the other exported products, the following average annual rates of growth were recorded: textile hosepiping and similar textile tubing (+1.9% per year) and textiles; transmission or conveyor belts or belting, of textile material, whether or not reinforced with metal or other material (+8.8% per year).
In value terms, textile products and articles for technical uses; specified in note 7 to this chapter ($832M) remains the largest type of textile products and articles for technical uses exported from China, comprising 75% of total exports. The second position in the ranking was taken by textile hosepiping and similar textile tubing ($142M), with a 13% share of total exports. It was followed by textiles; transmission or conveyor belts or belting, of textile material, whether or not reinforced with metal or other material, with an 11% share.
From 2013 to 2023, the average annual growth rate of the value of textile products and articles for technical uses; specified in note 7 to this chapter exports stood at +5.4%. With regard to the other exported products, the following average annual rates of growth were recorded: textile hosepiping and similar textile tubing (+1.6% per year) and textiles; transmission or conveyor belts or belting, of textile material, whether or not reinforced with metal or other material (+7.3% per year).
Export Prices by Country
In 2023, the technical textiles price stood at $6,676 per ton (FOB, China), dropping by -8% against the previous year. Over the period under review, the export price saw a relatively flat trend pattern. The growth pace was the most rapid in 2016 an increase of 102% against the previous year. As a result, the export price attained the peak level of $14,789 per ton. From 2017 to 2023, the average export prices failed to regain momentum.
There were significant differences in the average prices for the major foreign markets. In 2023, amid the top suppliers, the country with the highest price was Japan ($12,360 per ton), while the average price for exports to South Africa ($3,063 per ton) was amongst the lowest.
From 2013 to 2023, the most notable rate of growth in terms of prices was recorded for supplies to Russia (+6.2%), while the prices for the other major destinations experienced more modest paces of growth.
This report provides an in-depth analysis of the technical textiles market in China. Within it, you will discover the latest data on market trends and opportunities by country, consumption, production and price developments, as well as the global trade (imports and exports). The forecast exhibits the market prospects through 2030.
Product coverage:
- Prodcom 13961620 - Textile hosepiping and similar textile tubing, whether or not impregnated or coated, with or without lining, armour or accessories of other materials
- Prodcom 13961650 - Textile wicks, conveyor belts or belting (including reinforced with metal or other material)
- Prodcom 13961680 - Textile fabrics and felts, for paper-making machines or similar machines (including for pulp or asbestos-cement)
Country coverage:
Data coverage:
- Market volume and value
- Per Capita consumption
- Forecast of the market dynamics in the medium term
- Trade (exports and imports) in China
- Export and import prices
- Market trends, drivers and restraints
- Key market players and their profiles
Reasons to buy this report:
- Take advantage of the latest data
- Find deeper insights into current market developments
- Discover vital success factors affecting the market
This report is designed for manufacturers, distributors, importers, and wholesalers, as well as for investors, consultants and advisors.
In this report, you can find information that helps you to make informed decisions on the following issues:
- How to diversify your business and benefit from new market opportunities
- How to load your idle production capacity
- How to boost your sales on overseas markets
- How to increase your profit margins
- How to make your supply chain more sustainable
- How to reduce your production and supply chain costs
- How to outsource production to other countries
- How to prepare your business for global expansion
While doing this research, we combine the accumulated expertise of our analysts and the capabilities of artificial intelligence. The AI-based platform, developed by our data scientists, constitutes the key working tool for business analysts, empowering them to discover deep insights and ideas from the marketing data.
-
1. INTRODUCTION
Making Data-Driven Decisions to Grow Your Business
- REPORT DESCRIPTION
- RESEARCH METHODOLOGY AND AI PLATFORM
- DATA-DRIVEN DECISIONS FOR YOUR BUSINESS
- GLOSSARY AND SPECIFIC TERMS
-
2. EXECUTIVE SUMMARY
A Quick Overview of Market Performance
- KEY FINDINGS
- MARKET TRENDS This Chapter is Available Only for the Professional Edition PRO
-
3. MARKET OVERVIEW
Understanding the Current State of The Market and Its Prospects
- MARKET SIZE
- MARKET STRUCTURE
- TRADE BALANCE
- PER CAPITA CONSUMPTION
- MARKET FORECAST TO 2030
-
4. MOST PROMISING PRODUCT
Finding New Products to Diversify Your Business
This Chapter is Available Only for the Professional Edition PRO- TOP PRODUCTS TO DIVERSIFY YOUR BUSINESS
- BEST-SELLING PRODUCTS
- MOST CONSUMED PRODUCT
- MOST TRADED PRODUCT
- MOST PROFITABLE PRODUCT FOR EXPORT
-
5. MOST PROMISING SUPPLYING COUNTRIES
Choosing the Best Countries to Establish Your Sustainable Supply Chain
This Chapter is Available Only for the Professional Edition PRO- TOP COUNTRIES TO SOURCE YOUR PRODUCT
- TOP PRODUCING COUNTRIES
- TOP EXPORTING COUNTRIES
- LOW-COST EXPORTING COUNTRIES
-
6. MOST PROMISING OVERSEAS MARKETS
Choosing the Best Countries to Boost Your Exports
This Chapter is Available Only for the Professional Edition PRO- TOP OVERSEAS MARKETS FOR EXPORTING YOUR PRODUCT
- TOP CONSUMING MARKETS
- UNSATURATED MARKETS
- TOP IMPORTING MARKETS
- MOST PROFITABLE MARKETS
7. PRODUCTION
The Latest Trends and Insights into The Industry
- PRODUCTION VOLUME AND VALUE
8. IMPORTS
The Largest Import Supplying Countries
- IMPORTS FROM 2012–2023
- IMPORTS BY COUNTRY
- IMPORT PRICES BY COUNTRY
9. EXPORTS
The Largest Destinations for Exports
- EXPORTS FROM 2012–2023
- EXPORTS BY COUNTRY
- EXPORT PRICES BY COUNTRY
-
10. PROFILES OF MAJOR PRODUCERS
The Largest Producers on The Market and Their Profiles
This Chapter is Available Only for the Professional Edition PRO -
LIST OF TABLES
- Key Findings In 2023
- Market Volume, In Physical Terms, 2012–2023
- Market Value, 2012–2023
- Per Capita Consumption In 2012-2023
- Imports, In Physical Terms, By Country, 2012–2023
- Imports, In Value Terms, By Country, 2012–2023
- Import Prices, By Country Of Origin, 2012–2023
- Exports, In Physical Terms, By Country, 2012–2023
- Exports, In Value Terms, By Country, 2012–2023
- Export Prices, By Country Of Destination, 2012–2023
-
LIST OF FIGURES
- Market Volume, In Physical Terms, 2012–2023
- Market Value, 2012–2023
- Market Structure – Domestic Supply vs. Imports, In Physical Terms, 2012-2023
- Market Structure – Domestic Supply vs. Imports, In Value Terms, 2012-2023
- Trade Balance, In Physical Terms, 2012-2023
- Trade Balance, In Value Terms, 2012-2023
- Per Capita Consumption, 2012-2023
- Market Volume Forecast to 2030
- Market Value Forecast to 2030
- Products: Market Size And Growth, By Type
- Products: Average Per Capita Consumption, By Type
- Products: Exports And Growth, By Type
- Products: Export Prices And Growth, By Type
- Production Volume And Growth
- Exports And Growth
- Export Prices And Growth
- Market Size And Growth
- Per Capita Consumption
- Imports And Growth
- Import Prices
- Production, In Physical Terms, 2012–2023
- Production, In Value Terms, 2012–2023
- Imports, In Physical Terms, 2012–2023
- Imports, In Value Terms, 2012–2023
- Imports, In Physical Terms, By Country, 2023
- Imports, In Physical Terms, By Country, 2012–2023
- Imports, In Value Terms, By Country, 2012–2023
- Import Prices, By Country Of Origin, 2012–2023
- Exports, In Physical Terms, 2012–2023
- Exports, In Value Terms, 2012–2023
- Exports, In Physical Terms, By Country, 2023
- Exports, In Physical Terms, By Country, 2012–2023
- Exports, In Value Terms, By Country, 2012–2023
- Export Prices, By Country Of Destination, 2012–2023


