
China - Wadding Of Textile Materials And Articles Thereof - Market Analysis, Forecast, Size, Trends and Insights
Get instant access to more than 2 million reports, dashboards, and datasets on the IndexBox Platform.
View PricingChina's Export of Textile Wadding Decreases by 3%, Reaching $483 Million in 2023
China Textile Wadding Exports
In 2023, overseas shipments of wadding of textile materials and articles thereof increased by 11% to 92K tons, rising for the third consecutive year after three years of decline. The total export volume increased at an average annual rate of +5.8% from 2013 to 2023; however, the trend pattern indicated some noticeable fluctuations being recorded in certain years. The most prominent rate of growth was recorded in 2014 with an increase of 29% against the previous year. Over the period under review, the exports hit record highs in 2023 and are likely to continue growth in the immediate term.
In value terms, textile wadding exports contracted modestly to $483M (IndexBox estimates) in 2023. Overall, total exports indicated a prominent increase from 2013 to 2023: its value increased at an average annual rate of +6.8% over the last decade. The trend pattern, however, indicated some noticeable fluctuations being recorded throughout the analyzed period. Based on 2023 figures, exports increased by +57.2% against 2019 indices. The pace of growth was the most pronounced in 2022 when exports increased by 25%. As a result, the exports reached the peak of $498M, and then dropped slightly in the following year.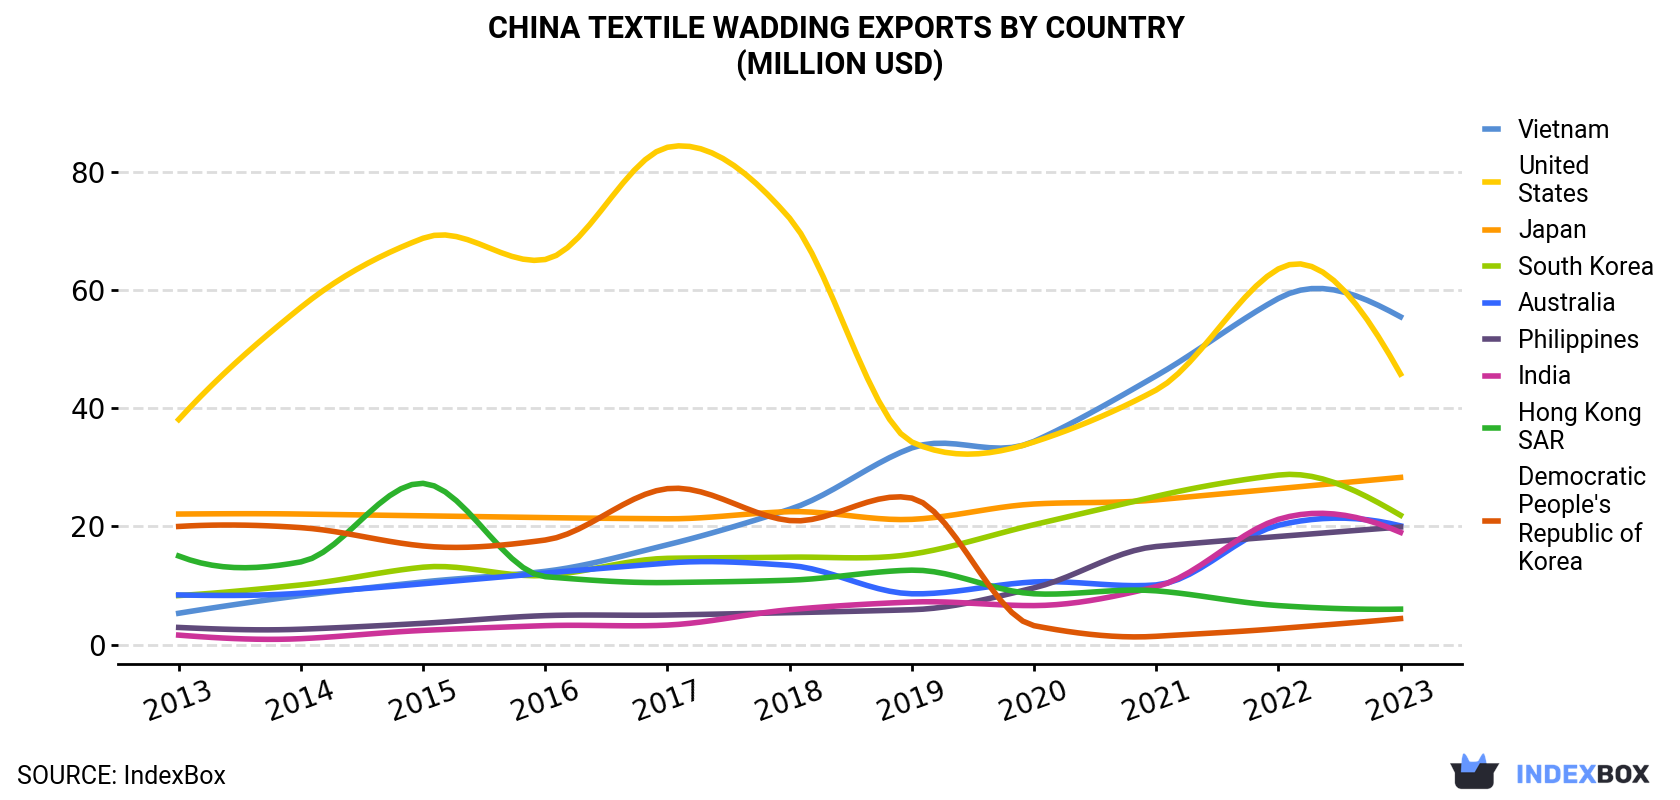
| COUNTRY | Export Value of Textile Wadding in China (million USD) | ||||||||||
|---|---|---|---|---|---|---|---|---|---|---|---|
| 2013 | 2014 | 2015 | 2016 | 2017 | 2018 | 2019 | 2020 | 2021 | 2022 | 2023 | |
| Vietnam | 5.3 | 8.3 | 10.6 | 12.4 | 16.9 | 22.9 | 33.3 | 34.4 | 45.5 | 58.6 | 55.5 |
| United States | 38.1 | 57.1 | 68.8 | 65.2 | 84.2 | 72.2 | 34.3 | 34.3 | 43.1 | 63.6 | 45.8 |
| Japan | 22.1 | 22.1 | 21.8 | 21.5 | 21.3 | 22.5 | 21.2 | 23.8 | 24.5 | 26.4 | 28.3 |
| South Korea | 8.3 | 10.1 | 13.1 | 11.7 | 14.6 | 14.8 | 15.3 | 20.3 | 25.1 | 28.7 | 21.9 |
| Australia | 8.4 | 8.7 | 10.3 | 12.1 | 13.8 | 13.4 | 8.6 | 10.6 | 10.1 | 20.2 | 20.1 |
| Philippines | 2.9 | 2.6 | 3.6 | 4.9 | 5.0 | 5.4 | 5.9 | 9.6 | 16.6 | 18.3 | 19.9 |
| India | 1.6 | 1.0 | 2.4 | 3.2 | 3.3 | 5.9 | 7.2 | 6.6 | 9.8 | 21.2 | 19.0 |
| Hong Kong | 15.0 | 14.0 | 27.3 | 11.5 | 10.5 | 10.9 | 12.6 | 8.6 | 9.1 | 6.6 | 6.0 |
| Democratic People's Republic of Korea | 20.0 | 19.8 | 16.7 | 17.7 | 26.4 | 21.0 | 24.8 | 3.2 | 1.4 | 2.7 | 4.4 |
| Others | 129 | 155 | 156 | 156 | 143 | 143 | 144 | 179 | 212 | 252 | 262 |
| Total | 251 | 298 | 330 | 316 | 339 | 333 | 307 | 330 | 397 | 498 | 483 |
Exports by Country
Vietnam (12K tons), the United States (9.4K tons) and Japan (6.3K tons) were the main destinations of textile wadding exports from China, with a combined 30% share of total exports. South Korea, the Philippines, India, Australia, Hong Kong and Democratic People's Republic of Korea lagged somewhat behind, together accounting for a further 16%.
From 2013 to 2023, the most notable rate of growth in terms of shipments, amongst the main countries of destination, was attained by India (with a CAGR of +27.0%), while the other leaders experienced more modest paces of growth.
In value terms, the largest markets for textile wadding exported from China were Vietnam ($55M), the United States ($46M) and Japan ($28M), with a combined 27% share of total exports. South Korea, Australia, the Philippines, India, Hong Kong and Democratic People's Republic of Korea lagged somewhat behind, together accounting for a further 19%.
India, with a CAGR of +28.0%, recorded the highest growth rate of the value of exports, among the main countries of destination over the period under review, while shipments for the other leaders experienced more modest paces of growth.
Export Prices by Country
In 2023, the textile wadding price stood at $5,240 per ton (FOB, China), which is down by -12.4% against the previous year. In general, the export price, however, recorded a relatively flat trend pattern. The most prominent rate of growth was recorded in 2020 when the average export price increased by 21% against the previous year. The export price peaked at $5,981 per ton in 2022, and then dropped in the following year.
There were significant differences in the average prices for the major external markets. In 2023, amid the top suppliers, the country with the highest price was Australia ($9,420 per ton), while the average price for exports to Myanmar ($3,202 per ton) was amongst the lowest.
From 2013 to 2023, the most notable rate of growth in terms of prices was recorded for supplies to Australia (+6.1%), while the prices for the other major destinations experienced more modest paces of growth.
This report provides an in-depth analysis of the textile wadding market in China. Within it, you will discover the latest data on market trends and opportunities by country, consumption, production and price developments, as well as the global trade (imports and exports). The forecast exhibits the market prospects through 2030.
Product coverage:
- Prodcom 13991400 - Textile flock and dust and mill neps
- Prodcom 17221240 - Wadding, other articles of wadding
Country coverage:
Data coverage:
- Market volume and value
- Per Capita consumption
- Forecast of the market dynamics in the medium term
- Trade (exports and imports) in China
- Export and import prices
- Market trends, drivers and restraints
- Key market players and their profiles
Reasons to buy this report:
- Take advantage of the latest data
- Find deeper insights into current market developments
- Discover vital success factors affecting the market
This report is designed for manufacturers, distributors, importers, and wholesalers, as well as for investors, consultants and advisors.
In this report, you can find information that helps you to make informed decisions on the following issues:
- How to diversify your business and benefit from new market opportunities
- How to load your idle production capacity
- How to boost your sales on overseas markets
- How to increase your profit margins
- How to make your supply chain more sustainable
- How to reduce your production and supply chain costs
- How to outsource production to other countries
- How to prepare your business for global expansion
While doing this research, we combine the accumulated expertise of our analysts and the capabilities of artificial intelligence. The AI-based platform, developed by our data scientists, constitutes the key working tool for business analysts, empowering them to discover deep insights and ideas from the marketing data.
-
1. INTRODUCTION
Making Data-Driven Decisions to Grow Your Business
- REPORT DESCRIPTION
- RESEARCH METHODOLOGY AND AI PLATFORM
- DATA-DRIVEN DECISIONS FOR YOUR BUSINESS
- GLOSSARY AND SPECIFIC TERMS
-
2. EXECUTIVE SUMMARY
A Quick Overview of Market Performance
- KEY FINDINGS
- MARKET TRENDS This Chapter is Available Only for the Professional Edition PRO
-
3. MARKET OVERVIEW
Understanding the Current State of The Market and Its Prospects
- MARKET SIZE
- MARKET STRUCTURE
- TRADE BALANCE
- PER CAPITA CONSUMPTION
- MARKET FORECAST TO 2030
-
4. MOST PROMISING PRODUCT
Finding New Products to Diversify Your Business
This Chapter is Available Only for the Professional Edition PRO- TOP PRODUCTS TO DIVERSIFY YOUR BUSINESS
- BEST-SELLING PRODUCTS
- MOST CONSUMED PRODUCT
- MOST TRADED PRODUCT
- MOST PROFITABLE PRODUCT FOR EXPORT
-
5. MOST PROMISING SUPPLYING COUNTRIES
Choosing the Best Countries to Establish Your Sustainable Supply Chain
This Chapter is Available Only for the Professional Edition PRO- TOP COUNTRIES TO SOURCE YOUR PRODUCT
- TOP PRODUCING COUNTRIES
- TOP EXPORTING COUNTRIES
- LOW-COST EXPORTING COUNTRIES
-
6. MOST PROMISING OVERSEAS MARKETS
Choosing the Best Countries to Boost Your Exports
This Chapter is Available Only for the Professional Edition PRO- TOP OVERSEAS MARKETS FOR EXPORTING YOUR PRODUCT
- TOP CONSUMING MARKETS
- UNSATURATED MARKETS
- TOP IMPORTING MARKETS
- MOST PROFITABLE MARKETS
7. PRODUCTION
The Latest Trends and Insights into The Industry
- PRODUCTION VOLUME AND VALUE
8. IMPORTS
The Largest Import Supplying Countries
- IMPORTS FROM 2012–2023
- IMPORTS BY COUNTRY
- IMPORT PRICES BY COUNTRY
9. EXPORTS
The Largest Destinations for Exports
- EXPORTS FROM 2012–2023
- EXPORTS BY COUNTRY
- EXPORT PRICES BY COUNTRY
-
10. PROFILES OF MAJOR PRODUCERS
The Largest Producers on The Market and Their Profiles
This Chapter is Available Only for the Professional Edition PRO -
LIST OF TABLES
- Key Findings In 2023
- Market Volume, In Physical Terms, 2012–2023
- Market Value, 2012–2023
- Per Capita Consumption In 2012-2023
- Imports, In Physical Terms, By Country, 2012–2023
- Imports, In Value Terms, By Country, 2012–2023
- Import Prices, By Country Of Origin, 2012–2023
- Exports, In Physical Terms, By Country, 2012–2023
- Exports, In Value Terms, By Country, 2012–2023
- Export Prices, By Country Of Destination, 2012–2023
-
LIST OF FIGURES
- Market Volume, In Physical Terms, 2012–2023
- Market Value, 2012–2023
- Market Structure – Domestic Supply vs. Imports, In Physical Terms, 2012-2023
- Market Structure – Domestic Supply vs. Imports, In Value Terms, 2012-2023
- Trade Balance, In Physical Terms, 2012-2023
- Trade Balance, In Value Terms, 2012-2023
- Per Capita Consumption, 2012-2023
- Market Volume Forecast to 2030
- Market Value Forecast to 2030
- Products: Market Size And Growth, By Type
- Products: Average Per Capita Consumption, By Type
- Products: Exports And Growth, By Type
- Products: Export Prices And Growth, By Type
- Production Volume And Growth
- Exports And Growth
- Export Prices And Growth
- Market Size And Growth
- Per Capita Consumption
- Imports And Growth
- Import Prices
- Production, In Physical Terms, 2012–2023
- Production, In Value Terms, 2012–2023
- Imports, In Physical Terms, 2012–2023
- Imports, In Value Terms, 2012–2023
- Imports, In Physical Terms, By Country, 2023
- Imports, In Physical Terms, By Country, 2012–2023
- Imports, In Value Terms, By Country, 2012–2023
- Import Prices, By Country Of Origin, 2012–2023
- Exports, In Physical Terms, 2012–2023
- Exports, In Value Terms, 2012–2023
- Exports, In Physical Terms, By Country, 2023
- Exports, In Physical Terms, By Country, 2012–2023
- Exports, In Value Terms, By Country, 2012–2023
- Export Prices, By Country Of Destination, 2012–2023


