
France - Breathing Appliances And Gas Masks - Market Analysis, Forecast, Size, Trends And Insights
Get instant access to more than 2 million reports, dashboards, and datasets on the IndexBox Platform.
View PricingFrance Sees 6% Increase in Breathing Appliances Exports, Reaching $114M in 2023
France Breathing Appliances Exports
Breathing appliances exports from France dropped significantly to 977K units in 2023, shrinking by -20.4% against the year before. Overall, exports recorded a abrupt descent. The pace of growth appeared the most rapid in 2018 when exports increased by 26%. Over the period under review, the exports attained the maximum at 1.7M units in 2020; however, from 2021 to 2023, the exports stood at a somewhat lower figure.
In value terms, breathing appliances exports expanded significantly to $114M (IndexBox estimates) in 2023. In general, total exports indicated perceptible growth from 2013 to 2023: its value increased at an average annual rate of +3.7% over the last decade. The trend pattern, however, indicated some noticeable fluctuations being recorded throughout the analyzed period. Based on 2023 figures, exports increased by +4.7% against 2020 indices. The growth pace was the most rapid in 2017 with an increase of 17%. Over the period under review, the exports hit record highs in 2023 and are likely to see gradual growth in the near future.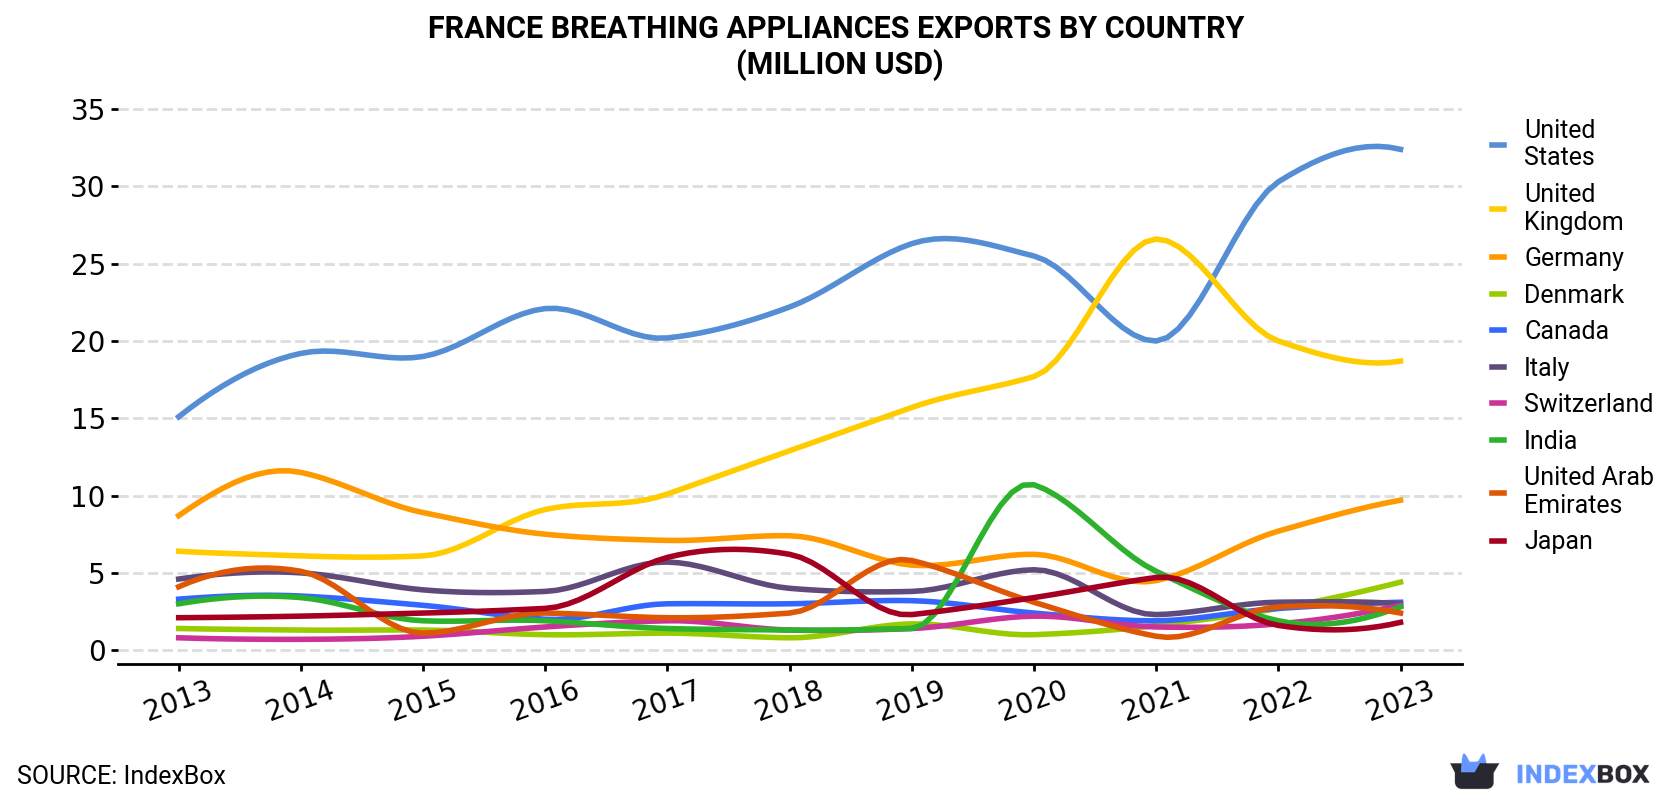
| COUNTRY | Export Value of Breathing Appliances in France (million USD) | ||||||||||
|---|---|---|---|---|---|---|---|---|---|---|---|
| 2013 | 2014 | 2015 | 2016 | 2017 | 2018 | 2019 | 2020 | 2021 | 2022 | 2023 | |
| United States | 15.1 | 19.2 | 19.0 | 22.1 | 20.2 | 22.2 | 26.3 | 25.5 | 20.0 | 30.3 | 32.4 |
| United Kingdom | 6.4 | 6.1 | 6.1 | 9.1 | 10.1 | 12.9 | 15.7 | 17.7 | 26.6 | 20.0 | 18.7 |
| Germany | 8.7 | 11.5 | 8.9 | 7.5 | 7.1 | 7.4 | 5.5 | 6.2 | 4.5 | 7.7 | 9.7 |
| Denmark | 1.4 | 1.3 | 1.3 | 1.0 | 1.1 | 0.8 | 1.7 | 1.0 | 1.6 | 2.7 | 4.4 |
| Canada | 3.3 | 3.5 | 2.9 | 2.0 | 3.0 | 3.0 | 3.2 | 2.4 | 1.9 | 2.7 | 3.1 |
| Italy | 4.6 | 5.0 | 3.9 | 3.8 | 5.7 | 4.0 | 3.8 | 5.2 | 2.3 | 3.1 | 3.0 |
| Switzerland | 0.8 | 0.7 | 0.9 | 1.5 | 1.9 | 1.3 | 1.4 | 2.2 | 1.5 | 1.7 | 2.9 |
| India | 3.0 | 3.4 | 1.9 | 1.9 | 1.4 | 1.3 | 1.4 | 10.7 | 5.1 | 1.9 | 2.8 |
| United Arab Emirates | 4.1 | 5.1 | 1.1 | 2.4 | 2.1 | 2.4 | 5.8 | 3.1 | 0.9 | 2.8 | 2.4 |
| Japan | 2.1 | 2.2 | 2.4 | 2.7 | 6.0 | 6.2 | 2.3 | 3.4 | 4.7 | 1.6 | 1.8 |
| Others | 29.9 | 26.4 | 21.3 | 21.1 | 29.2 | 31.1 | 29.7 | 31.5 | 30.6 | 32.7 | 33.0 |
| Total | 79.3 | 84.5 | 69.7 | 75.2 | 87.8 | 92.6 | 96.7 | 109 | 99.6 | 107 | 114 |
Exports by Country
the UK (134K units), the United States (89K units) and Germany (84K units) were the main destinations of breathing appliances exports from France, together comprising 31% of total exports. the United Arab Emirates, Italy, Denmark, Switzerland, Canada, India and Japan lagged somewhat behind, together accounting for a further 18%.
From 2013 to 2023, the biggest increases were recorded for Canada (with a CAGR of +11.2%), while shipments for the other leaders experienced more modest paces of growth.
In value terms, the United States ($32M), the UK ($19M) and Germany ($9.7M) appeared to be the largest markets for breathing appliances exported from France worldwide, together comprising 53% of total exports. Denmark, Canada, Italy, Switzerland, India, the United Arab Emirates and Japan lagged somewhat behind, together comprising a further 18%.
Among the main countries of destination, Switzerland, with a CAGR of +13.3%, saw the highest growth rate of the value of exports, over the period under review, while shipments for the other leaders experienced more modest paces of growth.
Export Prices by Country
In 2023, the breathing appliances price amounted to $117 per unit (FOB, France), surging by 34% against the previous year. Over the period under review, the export price showed a resilient expansion. As a result, the export price reached the peak level and is likely to continue growth in the immediate term.
There were significant differences in the average prices for the major foreign markets. In 2023, amid the top suppliers, the country with the highest price was the United States ($366 per unit), while the average price for exports to Angola ($23 per unit) was amongst the lowest.
From 2013 to 2023, the most notable rate of growth in terms of prices was recorded for supplies to Denmark (+18.5%), while the prices for the other major destinations experienced more modest paces of growth.
This report provides an in-depth analysis of the breathing appliances market in France. Within it, you will discover the latest data on market trends and opportunities by country, consumption, production and price developments, as well as the global trade (imports and exports). The forecast exhibits the market prospects through 2030.
Product coverage:
- Prodcom 32995910 - Breathing appliances and gas masks (excluding therapeutic respiration apparatus and protective masks having neither mechanical parts nor replaceable filters)
Country coverage:
- France
Data coverage:
- Market volume and value
- Per Capita consumption
- Forecast of the market dynamics in the medium term
- Trade (exports and imports) in France
- Export and import prices
- Market trends, drivers and restraints
- Key market players and their profiles
Reasons to buy this report:
- Take advantage of the latest data
- Find deeper insights into current market developments
- Discover vital success factors affecting the market
This report is designed for manufacturers, distributors, importers, and wholesalers, as well as for investors, consultants and advisors.
In this report, you can find information that helps you to make informed decisions on the following issues:
- How to diversify your business and benefit from new market opportunities
- How to load your idle production capacity
- How to boost your sales on overseas markets
- How to increase your profit margins
- How to make your supply chain more sustainable
- How to reduce your production and supply chain costs
- How to outsource production to other countries
- How to prepare your business for global expansion
While doing this research, we combine the accumulated expertise of our analysts and the capabilities of artificial intelligence. The AI-based platform, developed by our data scientists, constitutes the key working tool for business analysts, empowering them to discover deep insights and ideas from the marketing data.
-
1. INTRODUCTION
Making Data-Driven Decisions to Grow Your Business
- REPORT DESCRIPTION
- RESEARCH METHODOLOGY AND AI PLATFORM
- DATA-DRIVEN DECISIONS FOR YOUR BUSINESS
- GLOSSARY AND SPECIFIC TERMS
-
2. EXECUTIVE SUMMARY
A Quick Overview of Market Performance
- KEY FINDINGS
- MARKET TRENDS This Chapter is Available Only for the Professional Edition PRO
-
3. MARKET OVERVIEW
Understanding the Current State of The Market and Its Prospects
- MARKET SIZE
- MARKET STRUCTURE
- TRADE BALANCE
- PER CAPITA CONSUMPTION
- MARKET FORECAST TO 2030
-
4. MOST PROMISING PRODUCT
Finding New Products to Diversify Your Business
This Chapter is Available Only for the Professional Edition PRO- TOP PRODUCTS TO DIVERSIFY YOUR BUSINESS
- BEST-SELLING PRODUCTS
- MOST CONSUMED PRODUCT
- MOST TRADED PRODUCT
- MOST PROFITABLE PRODUCT FOR EXPORT
-
5. MOST PROMISING SUPPLYING COUNTRIES
Choosing the Best Countries to Establish Your Sustainable Supply Chain
This Chapter is Available Only for the Professional Edition PRO- TOP COUNTRIES TO SOURCE YOUR PRODUCT
- TOP PRODUCING COUNTRIES
- TOP EXPORTING COUNTRIES
- LOW-COST EXPORTING COUNTRIES
-
6. MOST PROMISING OVERSEAS MARKETS
Choosing the Best Countries to Boost Your Exports
This Chapter is Available Only for the Professional Edition PRO- TOP OVERSEAS MARKETS FOR EXPORTING YOUR PRODUCT
- TOP CONSUMING MARKETS
- UNSATURATED MARKETS
- TOP IMPORTING MARKETS
- MOST PROFITABLE MARKETS
7. PRODUCTION
The Latest Trends and Insights into The Industry
- PRODUCTION VOLUME AND VALUE
8. IMPORTS
The Largest Import Supplying Countries
- IMPORTS FROM 2012–2023
- IMPORTS BY COUNTRY
- IMPORT PRICES BY COUNTRY
9. EXPORTS
The Largest Destinations for Exports
- EXPORTS FROM 2012–2023
- EXPORTS BY COUNTRY
- EXPORT PRICES BY COUNTRY
-
10. PROFILES OF MAJOR PRODUCERS
The Largest Producers on The Market and Their Profiles
This Chapter is Available Only for the Professional Edition PRO -
LIST OF TABLES
- Key Findings In 2023
- Market Volume, In Physical Terms, 2012–2023
- Market Value, 2012–2023
- Per Capita Consumption In 2012-2023
- Imports, In Physical Terms, By Country, 2012–2023
- Imports, In Value Terms, By Country, 2012–2023
- Import Prices, By Country Of Origin, 2012–2023
- Exports, In Physical Terms, By Country, 2012–2023
- Exports, In Value Terms, By Country, 2012–2023
- Export Prices, By Country Of Destination, 2012–2023
-
LIST OF FIGURES
- Market Volume, In Physical Terms, 2012–2023
- Market Value, 2012–2023
- Market Structure – Domestic Supply vs. Imports, In Physical Terms, 2012-2023
- Market Structure – Domestic Supply vs. Imports, In Value Terms, 2012-2023
- Trade Balance, In Physical Terms, 2012-2023
- Trade Balance, In Value Terms, 2012-2023
- Per Capita Consumption, 2012-2023
- Market Volume Forecast to 2030
- Market Value Forecast to 2030
- Products: Market Size And Growth, By Type
- Products: Average Per Capita Consumption, By Type
- Products: Exports And Growth, By Type
- Products: Export Prices And Growth, By Type
- Production Volume And Growth
- Exports And Growth
- Export Prices And Growth
- Market Size And Growth
- Per Capita Consumption
- Imports And Growth
- Import Prices
- Production, In Physical Terms, 2012–2023
- Production, In Value Terms, 2012–2023
- Imports, In Physical Terms, 2012–2023
- Imports, In Value Terms, 2012–2023
- Imports, In Physical Terms, By Country, 2023
- Imports, In Physical Terms, By Country, 2012–2023
- Imports, In Value Terms, By Country, 2012–2023
- Import Prices, By Country Of Origin, 2012–2023
- Exports, In Physical Terms, 2012–2023
- Exports, In Value Terms, 2012–2023
- Exports, In Physical Terms, By Country, 2023
- Exports, In Physical Terms, By Country, 2012–2023
- Exports, In Value Terms, By Country, 2012–2023
- Export Prices, By Country Of Destination, 2012–2023


