World - Iodine - Market Analysis, Forecast, Size, Trends And Insights
Get instant access to more than 2 million reports, dashboards, and datasets on the IndexBox Platform.
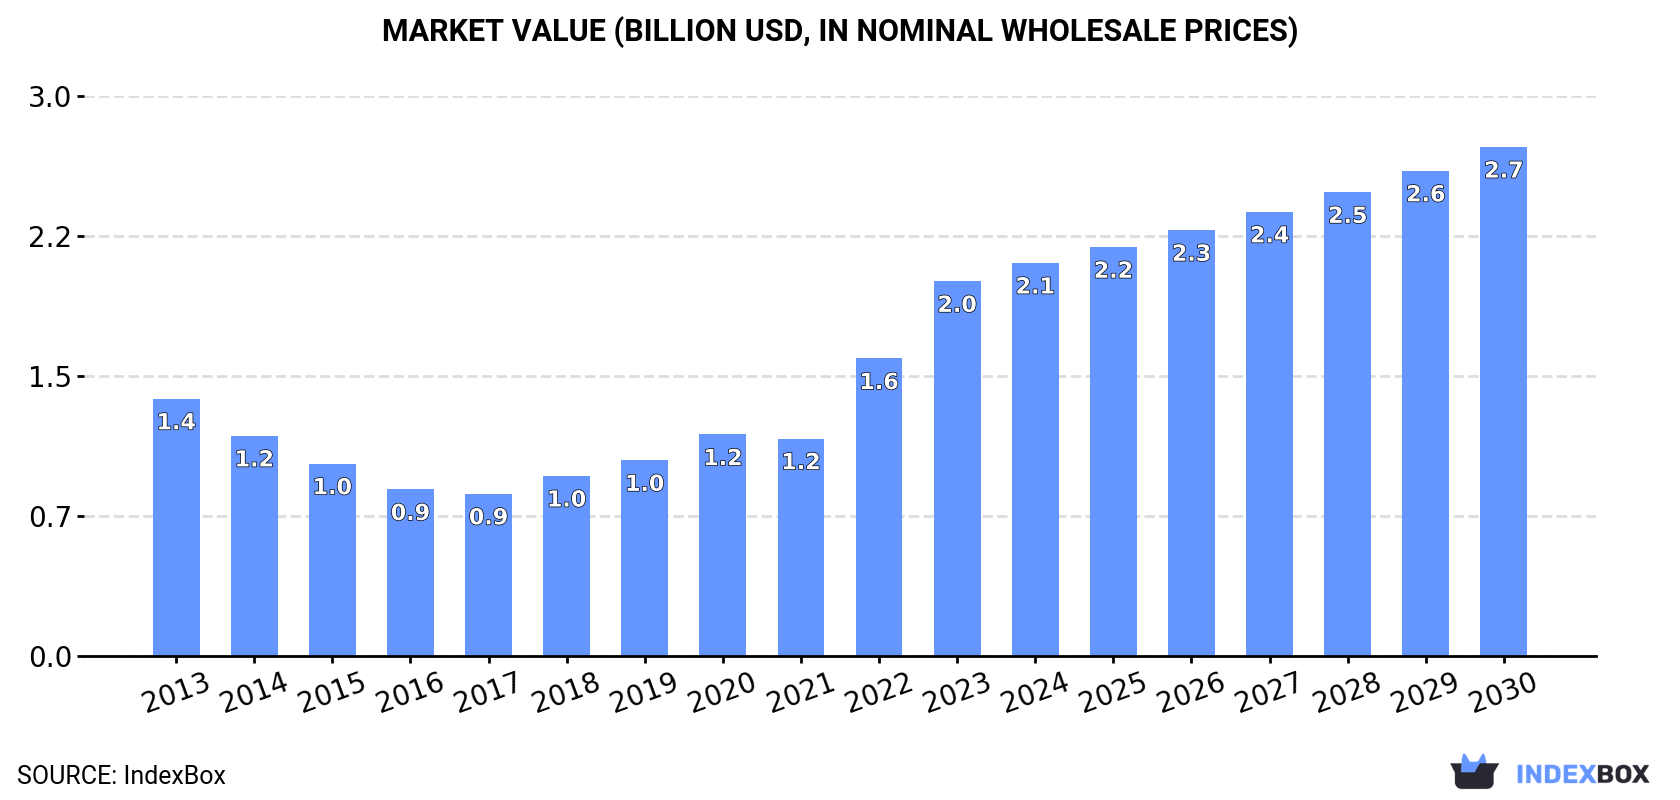
View PricingGlobal Iodine Market to Exhibit Steady Growth with CAGR of +2.2% until 2030, Reaching $2.7B in Value
IndexBox has just published a new report: World - Iodine - Market Analysis, Forecast, Size, Trends And Insights.
Driven by increasing worldwide demand, the iodine market is expected to experience a CAGR of +2.2% in volume and +4.5% in value from 2023 to 2030. This growth trend signifies a promising outlook for the iodine market in the coming years.
Market Forecast
Driven by increasing demand for iodine worldwide, the market is expected to continue an upward consumption trend over the next seven-year period. Market performance is forecast to accelerate, expanding with an anticipated CAGR of +2.2% for the period from 2023 to 2030, which is projected to bring the market volume to 45K tons by the end of 2030.
In value terms, the market is forecast to increase with an anticipated CAGR of +4.5% for the period from 2023 to 2030, which is projected to bring the market value to $2.7B (in nominal wholesale prices) by the end of 2030.
Consumption
World Consumption of Iodine
In 2023, global iodine consumption amounted to 39K tons, growing by 4.8% against the previous year's figure. The total consumption volume increased at an average annual rate of +1.1% from 2013 to 2023; the trend pattern remained consistent, with only minor fluctuations being observed throughout the analyzed period. The pace of growth appeared the most rapid in 2018 with an increase of 6.5%. Global consumption peaked in 2023 and is likely to see steady growth in the near future.
The global iodine market size surged to $2B in 2023, picking up by 26% against the previous year. This figure reflects the total revenues of producers and importers (excluding logistics costs, retail marketing costs, and retailers' margins, which will be included in the final consumer price). In general, consumption recorded measured growth. Global consumption peaked in 2023 and is likely to see gradual growth in the immediate term.
Consumption By Country
The countries with the highest volumes of consumption in 2023 were China (8K tons), Norway (5K tons) and Japan (4.1K tons), together accounting for 44% of global consumption.
From 2013 to 2023, the biggest increases were recorded for Norway (with a CAGR of +9.3%), while consumption for the other global leaders experienced more modest paces of growth.
In value terms, China ($447M), Norway ($264M) and the United States ($182M) were the countries with the highest levels of market value in 2023, together accounting for 44% of the global market.
Norway, with a CAGR of +11.5%, recorded the highest rates of growth with regard to market size among the main consuming countries over the period under review, while market for the other global leaders experienced more modest paces of growth.
In 2023, the highest levels of iodine per capita consumption was registered in Norway (899 kg per 1000 persons), followed by Chile (165 kg per 1000 persons), Turkmenistan (111 kg per 1000 persons) and Italy (50 kg per 1000 persons), while the world average per capita consumption of iodine was estimated at 4.9 kg per 1000 persons.
In Norway, iodine per capita consumption increased at an average annual rate of +8.4% over the period from 2013-2023. In the other countries, the average annual rates were as follows: Chile (-0.4% per year) and Turkmenistan (+1.8% per year).
Production
World Production of Iodine
In 2023, approx. 37K tons of iodine were produced worldwide; with an increase of 4.4% against the year before. Overall, production saw a relatively flat trend pattern. The pace of growth was the most pronounced in 2018 when the production volume increased by 4.7% against the previous year. Over the period under review, global production attained the peak volume in 2023 and is likely to continue growth in the near future.
In value terms, iodine production soared to $2B in 2023 estimated in export price. In general, production enjoyed notable growth. As a result, production attained the peak level and is likely to continue growth in the immediate term.
Production By Country
The country with the largest volume of iodine production was Chile (22K tons), accounting for 59% of total volume. Moreover, iodine production in Chile exceeded the figures recorded by the second-largest producer, Japan (8.9K tons), twofold. The United States (2.2K tons) ranked third in terms of total production with a 5.9% share.
In Chile, iodine production remained relatively stable over the period from 2013-2023. The remaining producing countries recorded the following average annual rates of production growth: Japan (-0.4% per year) and the United States (+0.1% per year).
Imports
World Imports of Iodine
In 2023, purchases abroad of iodine decreased by -2.2% to 36K tons for the first time since 2020, thus ending a two-year rising trend. The total import volume increased at an average annual rate of +1.5% from 2013 to 2023; the trend pattern remained relatively stable, with only minor fluctuations being observed throughout the analyzed period. The most prominent rate of growth was recorded in 2014 with an increase of 8.8%. Over the period under review, global imports hit record highs at 38K tons in 2018; however, from 2019 to 2023, imports failed to regain momentum.
In value terms, iodine imports surged to $2.3B in 2023. Overall, imports, however, showed a remarkable increase. The most prominent rate of growth was recorded in 2022 with an increase of 52% against the previous year. Over the period under review, global imports hit record highs in 2023 and are likely to continue growth in the near future.
Imports By Country
The countries with the highest levels of iodine imports in 2023 were China (7.4K tons), Belgium (6K tons) and Norway (5K tons), together recording 51% of total import. India (3.3K tons) held the next position in the ranking, followed by Italy (3K tons), the United States (2.9K tons) and Germany (1.6K tons). All these countries together held approx. 30% share of total imports.
From 2013 to 2023, the most notable rate of growth in terms of purchases, amongst the leading importing countries, was attained by Norway (with a CAGR of +9.3%), while imports for the other global leaders experienced more modest paces of growth.
In value terms, the largest iodine importing markets worldwide were China ($495M), Belgium ($405M) and Norway ($302M), with a combined 52% share of global imports.
Norway, with a CAGR of +13.0%, saw the highest rates of growth with regard to the value of imports, among the main importing countries over the period under review, while purchases for the other global leaders experienced more modest paces of growth.
Import Prices By Country
In 2023, the average iodine import price amounted to $63,816 per ton, surging by 31% against the previous year. Overall, the import price enjoyed measured growth. The pace of growth was the most pronounced in 2022 when the average import price increased by 48% against the previous year. Global import price peaked in 2023 and is likely to see steady growth in years to come.
Average prices varied noticeably amongst the major importing countries. In 2023, major importing countries recorded the following prices: in Italy ($72,292 per ton) and Belgium ($67,202 per ton), while Germany ($59,366 per ton) and Norway ($60,849 per ton) were amongst the lowest.
From 2013 to 2023, the most notable rate of growth in terms of prices was attained by Italy (+3.8%), while the other global leaders experienced more modest paces of growth.
Exports
World Exports of Iodine
In 2023, global exports of iodine declined to 35K tons, which is down by -3% on 2022 figures. The total export volume increased at an average annual rate of +1.3% from 2013 to 2023; the trend pattern remained consistent, with somewhat noticeable fluctuations being observed in certain years. The pace of growth appeared the most rapid in 2021 with an increase of 8.9%. As a result, the exports attained the peak of 36K tons. From 2022 to 2023, the growth of the global exports remained at a somewhat lower figure.
In value terms, iodine exports skyrocketed to $2.3B in 2023. Overall, exports, however, saw a buoyant expansion. The most prominent rate of growth was recorded in 2022 when exports increased by 52% against the previous year. The global exports peaked in 2023 and are likely to continue growth in the immediate term.
Exports By Country
Chile represented the main exporter of iodine in the world, with the volume of exports recording 19K tons, which was near 54% of total exports in 2023. It was distantly followed by Belgium (6.6K tons) and Japan (4.9K tons), together comprising a 33% share of total exports. The following exporters - the United States (1.5K tons) and the Netherlands (0.6K tons) - together made up 6.2% of total exports.
Chile experienced a relatively flat trend pattern with regard to volume of exports of iodine. At the same time, Belgium (+3.2%), Japan (+2.4%) and the Netherlands (+2.2%) displayed positive paces of growth. Moreover, Belgium emerged as the fastest-growing exporter exported in the world, with a CAGR of +3.2% from 2013-2023. By contrast, the United States (-1.9%) illustrated a downward trend over the same period. While the share of Belgium (+3.2 p.p.) increased significantly in terms of the global exports from 2013-2023, the share of the United States (-1.7 p.p.) and Chile (-3.8 p.p.) displayed negative dynamics. The shares of the other countries remained relatively stable throughout the analyzed period.
In value terms, Chile ($1.3B) remains the largest iodine supplier worldwide, comprising 59% of global exports. The second position in the ranking was taken by Belgium ($465M), with a 20% share of global exports. It was followed by Japan, with an 11% share.
In Chile, iodine exports increased at an average annual rate of +5.0% over the period from 2013-2023. In the other countries, the average annual rates were as follows: Belgium (+6.9% per year) and Japan (+6.1% per year).
Export Prices By Country
In 2023, the average iodine export price amounted to $65,927 per ton, rising by 30% against the previous year. Overall, the export price enjoyed moderate growth. The pace of growth was the most pronounced in 2022 when the average export price increased by 53%. The global export price peaked in 2023 and is likely to see gradual growth in years to come.
Average prices varied somewhat amongst the major exporting countries. In 2023, major exporting countries recorded the following prices: in the Netherlands ($75,703 per ton) and Chile ($70,953 per ton), while the United States ($51,464 per ton) and Japan ($52,499 per ton) were amongst the lowest.
From 2013 to 2023, the most notable rate of growth in terms of prices was attained by the United States (+8.0%), while the other global leaders experienced more modest paces of growth.
This report provides an in-depth analysis of the global iodine market. Within it, you will discover the latest data on market trends and opportunities by country, consumption, production and price developments, as well as the global trade (imports and exports). The forecast exhibits the market prospects through 2030.
Product coverage:
Country coverage:
Worldwide - the report contains statistical data for 200 countries and includes detailed profiles of the 50 largest consuming countries:
- USA
- China
- Japan
- Germany
- United Kingdom
- France
- Brazil
- Italy
- Russian Federation
- India
- Canada
- Australia
- Republic of Korea
- Spain
- Mexico
- Indonesia
- Netherlands
- Turkey
- Saudi Arabia
- Switzerland
- Sweden
- Nigeria
- Poland
- Belgium
- Argentina
- Norway
- Austria
- Thailand
- United Arab Emirates
- Colombia
- Denmark
- South Africa
- Malaysia
- Israel
- Singapore
- Egypt
- Philippines
- Finland
- Chile
- Ireland
- Pakistan
- Greece
- Portugal
- Kazakhstan
- Algeria
- Czech Republic
- Qatar
- Peru
- Romania
- Vietnam
+ the largest producing countries
Data coverage:
- Global market volume and value
- Per Capita consumption
- Forecast of the market dynamics in the medium term
- Global production, split by region and country
- Global trade (exports and imports)
- Export and import prices
- Market trends, drivers and restraints
- Key market players and their profiles
Company coverage:
Reasons to buy this report:
- Take advantage of the latest data
- Find deeper insights into current market developments
- Discover vital success factors affecting the market
This report is designed for manufacturers, distributors, importers, and wholesalers, as well as for investors, consultants and advisors.
In this report, you can find information that helps you to make informed decisions on the following issues:
- How to diversify your business and benefit from new market opportunities
- How to load your idle production capacity
- How to boost your sales on overseas markets
- How to increase your profit margins
- How to make your supply chain more sustainable
- How to reduce your production and supply chain costs
- How to outsource production to other countries
- How to prepare your business for global expansion
While doing this research, we combine the accumulated expertise of our analysts and the capabilities of artificial intelligence. The AI-based platform, developed by our data scientists, constitutes the key working tool for business analysts, empowering them to discover deep insights and ideas from the marketing data.
-
1. INTRODUCTION
Making Data-Driven Decisions to Grow Your Business
- REPORT DESCRIPTION
- RESEARCH METHODOLOGY AND AI PLATFORM
- DATA-DRIVEN DECISIONS FOR YOUR BUSINESS
- GLOSSARY AND SPECIFIC TERMS
-
2. EXECUTIVE SUMMARY
A Quick Overview of Market Performance
- KEY FINDINGS
- MARKET TRENDS This Chapter is Available Only for the Professional Edition PRO
-
3. MARKET OVERVIEW
Understanding the Current State of The Market and Its Prospects
- MARKET SIZE
- CONSUMPTION BY COUNTRY
- MARKET FORECAST TO 2030
-
4. MOST PROMISING PRODUCT
Finding New Products to Diversify Your Business
This Chapter is Available Only for the Professional Edition PRO- TOP PRODUCTS TO DIVERSIFY YOUR BUSINESS
- BEST-SELLING PRODUCTS
- MOST CONSUMED PRODUCT
- MOST TRADED PRODUCT
- MOST PROFITABLE PRODUCT FOR EXPORT
-
5. MOST PROMISING SUPPLYING COUNTRIES
Choosing the Best Countries to Establish Your Sustainable Supply Chain
This Chapter is Available Only for the Professional Edition PRO- TOP COUNTRIES TO SOURCE YOUR PRODUCT
- TOP PRODUCING COUNTRIES
- TOP EXPORTING COUNTRIES
- LOW-COST EXPORTING COUNTRIES
-
6. MOST PROMISING OVERSEAS MARKETS
Choosing the Best Countries to Boost Your Exports
This Chapter is Available Only for the Professional Edition PRO- TOP OVERSEAS MARKETS FOR EXPORTING YOUR PRODUCT
- TOP CONSUMING MARKETS
- UNSATURATED MARKETS
- TOP IMPORTING MARKETS
- MOST PROFITABLE MARKETS
7. GLOBAL PRODUCTION
The Latest Trends and Insights into The Industry
- PRODUCTION VOLUME AND VALUE
- PRODUCTION BY COUNTRY
8. GLOBAL IMPORTS
The Largest Importers on The Market and How They Succeed
- IMPORTS FROM 2012–2023
- IMPORTS BY COUNTRY
- IMPORT PRICES BY COUNTRY
9. GLOBAL EXPORTS
The Largest Exporters on The Market and How They Succeed
- EXPORTS FROM 2012–2023
- EXPORTS BY COUNTRY
- EXPORT PRICES BY COUNTRY
-
10. PROFILES OF MAJOR PRODUCERS
The Largest Producers on The Market and Their Profiles
This Chapter is Available Only for the Professional Edition PRO -
11. COUNTRY PROFILES
The Largest Markets And Their Profiles
This Chapter is Available Only for the Professional Edition PRO- United States
- China
- Japan
- Germany
- United Kingdom
- France
- Brazil
- Italy
- Russian Federation
- India
- Canada
- Australia
- Republic of Korea
- Spain
- Mexico
- Indonesia
- Netherlands
- Turkey
- Saudi Arabia
- Switzerland
- Sweden
- Nigeria
- Poland
- Belgium
- Argentina
- Norway
- Austria
- Thailand
- United Arab Emirates
- Colombia
- Denmark
- South Africa
- Malaysia
- Israel
- Singapore
- Egypt
- Philippines
- Finland
- Chile
- Ireland
- Pakistan
- Greece
- Portugal
- Kazakhstan
- Algeria
- Czech Republic
- Qatar
- Peru
- Romania
- Vietnam
-
LIST OF TABLES
- Key Findings In 2023
- Market Volume, In Physical Terms, 2012–2023
- Market Value, 2012–2023
- Per Capita Consumption, By Country, 2018–2023
- Production, In Physical Terms, By Country, 2012–2023
- Imports, In Physical Terms, By Country, 2012–2023
- Imports, In Value Terms, By Country, 2012–2023
- Import Prices, By Country Of Destination, 2012–2023
- Exports, In Physical Terms, By Country, 2012–2023
- Exports, In Value Terms, By Country, 2012–2023
- Export Prices, By Country Of Origin, 2012–2023
-
LIST OF FIGURES
- Market Volume, In Physical Terms, 2012–2023
- Market Value, 2012–2023
- Consumption, By Country, 2023
- Market Volume Forecast to 2030
- Market Value Forecast to 2030
- Products: Market Size And Growth, By Type
- Products: Average Per Capita Consumption, By Type
- Products: Exports And Growth, By Type
- Products: Export Prices And Growth, By Type
- Production Volume And Growth
- Exports And Growth
- Export Prices And Growth
- Market Size And Growth
- Per Capita Consumption
- Imports And Growth
- Import Prices
- Production, In Physical Terms, 2012–2023
- Production, In Value Terms, 2012–2023
- Production, By Country, 2023
- Production, In Physical Terms, By Country, 2012–2023
- Imports, In Physical Terms, 2012–2023
- Imports, In Value Terms, 2012–2023
- Imports, In Physical Terms, By Country, 2023
- Imports, In Physical Terms, By Country, 2012–2023
- Imports, In Value Terms, By Country, 2012–2023
- Import Prices, By Country, 2012–2023
- Exports, In Physical Terms, 2012–2023
- Exports, In Value Terms, 2012–2023
- Exports, In Physical Terms, By Country, 2023
- Exports, In Physical Terms, By Country, 2012–2023
- Exports, In Value Terms, By Country, 2012–2023
- Export Prices, 2012–2023


