World - Lifting, Handling, Loading Or Unloading Machinery - Market Analysis, Forecast, Size, Trends And Insights
Get instant access to more than 2 million reports, dashboards, and datasets on the IndexBox Platform.
View PricingGlobal Lifting Machinery Market to Grow at CAGR of +2.7% through 2030
IndexBox has just published a new report: World - Lifting, Handling, Loading Or Unloading Machinery - Market Analysis, Forecast, Size, Trends And Insights.
Driven by high demand for machinery worldwide, the market is forecast to see significant growth with a CAGR of +2.7% in volume and +4.0% in value from 2023 to 2030. This expansion is expected to lead to an increase in market volume to 23M units and market value to $80.9B by the end of 2030.
Market Forecast
Driven by increasing demand for lifting, handling, loading or unloading machinery worldwide, the market is expected to continue an upward consumption trend over the next seven years. Market performance is forecast to accelerate, expanding with an anticipated CAGR of +2.7% for the period from 2023 to 2030, which is projected to bring the market volume to 23M units by the end of 2030.
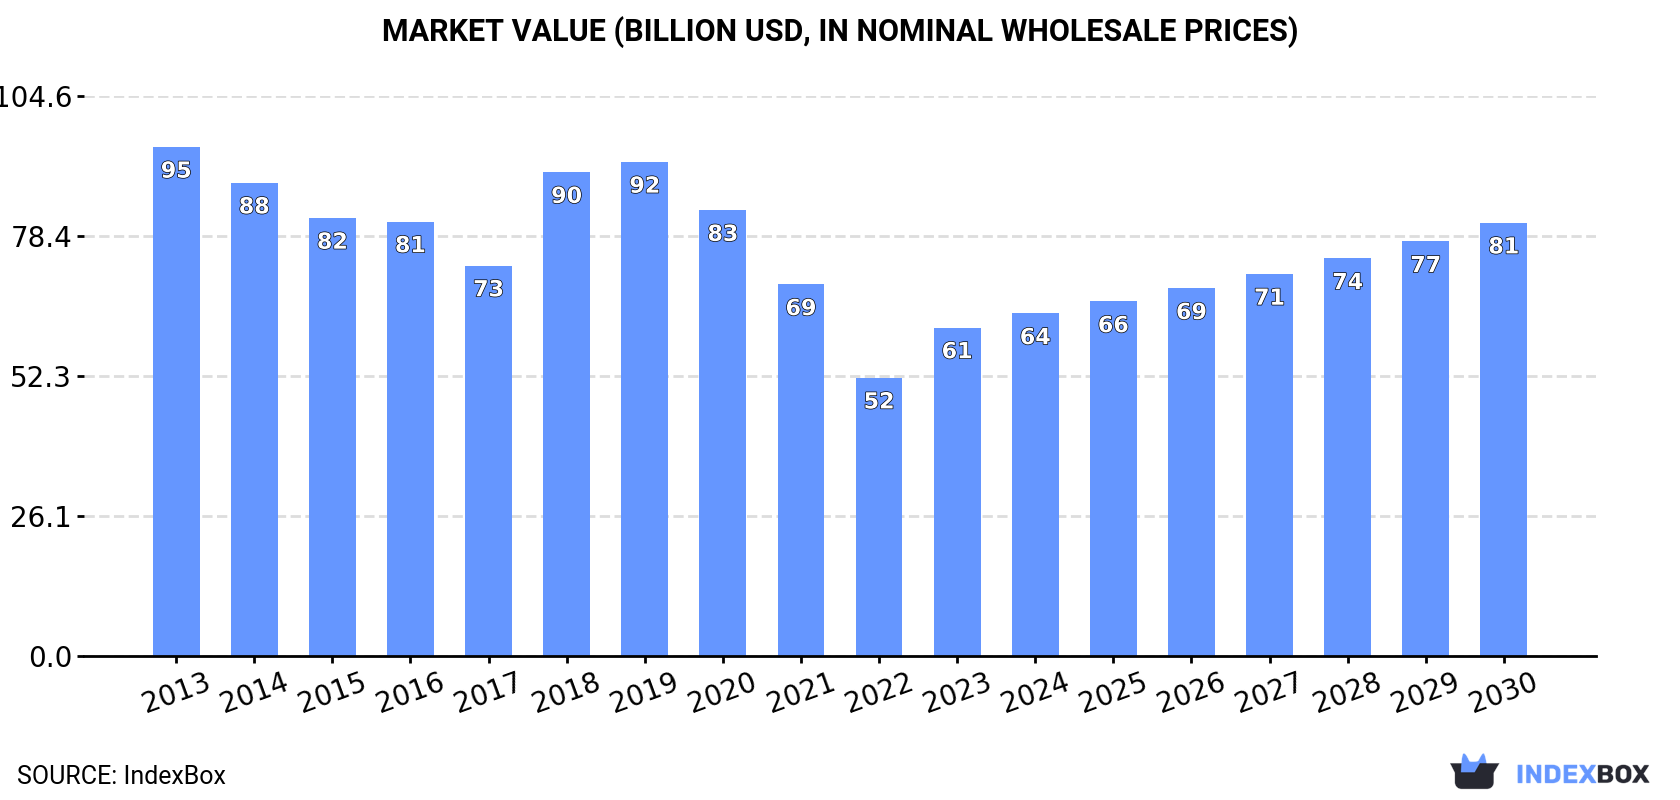
In value terms, the market is forecast to increase with an anticipated CAGR of +4.0% for the period from 2023 to 2030, which is projected to bring the market value to $80.9B (in nominal wholesale prices) by the end of 2030.
Consumption
World Consumption of Lifting, Handling, Loading Or Unloading Machinery
In 2023, global consumption of lifting, handling, loading or unloading machinery fell slightly to 19M units, with a decrease of -4.2% on 2022. The total consumption volume increased at an average annual rate of +1.7% over the period from 2013 to 2023; the trend pattern remained relatively stable, with somewhat noticeable fluctuations being observed throughout the analyzed period. As a result, consumption attained the peak volume of 20M units. From 2019 to 2023, the growth of the global consumption remained at a somewhat lower figure.
The global loading machinery market value soared to $61.3B in 2023, rising by 18% against the previous year. This figure reflects the total revenues of producers and importers (excluding logistics costs, retail marketing costs, and retailers' margins, which will be included in the final consumer price). Overall, consumption showed a perceptible descent. Global consumption peaked at $95.1B in 2013; however, from 2014 to 2023, consumption remained at a lower figure.
Consumption By Country
The United States (7.3M units) constituted the country with the largest volume of loading machinery consumption, accounting for 38% of total volume. Moreover, loading machinery consumption in the United States exceeded the figures recorded by the second-largest consumer, China (2.4M units), threefold. The third position in this ranking was held by India (1M units), with a 5.3% share.
In the United States, loading machinery consumption expanded at an average annual rate of +2.7% over the period from 2013-2023. In the other countries, the average annual rates were as follows: China (+3.9% per year) and India (+3.3% per year).
In value terms, the largest loading machinery markets worldwide were the UK ($9.6B), Japan ($6.8B) and Hungary ($4.9B), with a combined 35% share of the global market. Indonesia, the United States, India, Malaysia, Russia, China, Brazil, Canada, Mexico and Australia lagged somewhat behind, together comprising a further 24%.
Among the main consuming countries, Brazil, with a CAGR of +11.0%, saw the highest rates of growth with regard to market size over the period under review, while market for the other global leaders experienced more modest paces of growth.
In 2023, the highest levels of loading machinery per capita consumption was registered in Hungary (53 units per 1000 persons), followed by the United States (22 units per 1000 persons), Canada (14 units per 1000 persons) and Australia (14 units per 1000 persons), while the world average per capita consumption of loading machinery was estimated at 2.4 units per 1000 persons.
From 2013 to 2023, the average annual rate of growth in terms of the loading machinery per capita consumption in Hungary amounted to -8.1%. In the other countries, the average annual rates were as follows: the United States (+2.0% per year) and Canada (+6.7% per year).
Production
World Production of Lifting, Handling, Loading Or Unloading Machinery
Global loading machinery production fell to 12M units in 2023, remaining stable against the previous year's figure. The total output volume increased at an average annual rate of +1.2% from 2013 to 2023; however, the trend pattern indicated some noticeable fluctuations being recorded throughout the analyzed period. The pace of growth was the most pronounced in 2018 when the production volume increased by 27%. Over the period under review, global production reached the peak volume at 14M units in 2019; however, from 2020 to 2023, production stood at a somewhat lower figure.
In value terms, loading machinery production skyrocketed to $57.2B in 2023 estimated in export price. Over the period under review, production recorded a pronounced shrinkage. The pace of growth was the most pronounced in 2018 with an increase of 26% against the previous year. Over the period under review, global production attained the peak level at $94.4B in 2013; however, from 2014 to 2023, production remained at a lower figure.
Production By Country
China (5.7M units) constituted the country with the largest volume of loading machinery production, accounting for 47% of total volume. Moreover, loading machinery production in China exceeded the figures recorded by the second-largest producer, India (991K units), sixfold. Hungary (496K units) ranked third in terms of total production with a 4.1% share.
From 2013 to 2023, the average annual rate of growth in terms of volume in China totaled +4.6%. In the other countries, the average annual rates were as follows: India (+2.9% per year) and Hungary (-8.6% per year).
Imports
World Imports of Lifting, Handling, Loading Or Unloading Machinery
In 2023, after two years of growth, there was decline in supplies from abroad of lifting, handling, loading or unloading machinery, when their volume decreased by -3.8% to 14M units. In general, total imports indicated a resilient expansion from 2013 to 2023: its volume increased at an average annual rate of +5.0% over the last decade. The trend pattern, however, indicated some noticeable fluctuations being recorded throughout the analyzed period. Based on 2023 figures, imports increased by +30.4% against 2020 indices. The growth pace was the most rapid in 2021 with an increase of 20%. Over the period under review, global imports attained the maximum at 15M units in 2022, and then shrank modestly in the following year.
In value terms, loading machinery imports stood at $15.9B in 2023. The total import value increased at an average annual rate of +4.7% over the period from 2013 to 2023; however, the trend pattern indicated some noticeable fluctuations being recorded in certain years. The pace of growth appeared the most rapid in 2021 when imports increased by 20% against the previous year. Global imports peaked in 2023 and are likely to see steady growth in the immediate term.
Imports By Country
The United States prevails in imports structure, recording 8.3M units, which was approx. 58% of total imports in 2023. Canada (754K units) held the second position in the ranking, followed by Australia (706K units). All these countries together took near 10% share of total imports. Brazil (445K units), Mexico (315K units), Malaysia (310K units), Singapore (304K units), Thailand (269K units) and China (226K units) followed a long way behind the leaders.
Imports into the United States increased at an average annual rate of +3.9% from 2013 to 2023. At the same time, Malaysia (+46.1%), Singapore (+27.9%), Thailand (+12.5%), Brazil (+12.1%), Canada (+8.5%), Australia (+6.3%), Mexico (+5.8%) and China (+5.7%) displayed positive paces of growth. Moreover, Malaysia emerged as the fastest-growing importer imported in the world, with a CAGR of +46.1% from 2013-2023. Malaysia (+2.1 p.p.), Singapore (+1.8 p.p.) and Brazil (+1.5 p.p.) significantly strengthened its position in terms of the global imports, while the United States saw its share reduced by -6.9% from 2013 to 2023, respectively. The shares of the other countries remained relatively stable throughout the analyzed period.
In value terms, the United States ($3.8B) constitutes the largest market for imported lifting, handling, loading or unloading machinery worldwide, comprising 24% of global imports. The second position in the ranking was held by China ($941M), with a 5.9% share of global imports. It was followed by Australia, with a 4.7% share.
In the United States, loading machinery imports increased at an average annual rate of +6.7% over the period from 2013-2023. In the other countries, the average annual rates were as follows: China (-1.2% per year) and Australia (+5.7% per year).
Import Prices By Country
In 2023, the average loading machinery import price amounted to $1,116 per unit, picking up by 8.5% against the previous year. Over the period under review, the import price, however, recorded a relatively flat trend pattern. The pace of growth appeared the most rapid in 2018 an increase of 12% against the previous year. Global import price peaked at $1,184 per unit in 2019; however, from 2020 to 2023, import prices failed to regain momentum.
Prices varied noticeably by country of destination: amid the top importers, the country with the highest price was China ($4,173 per unit), while Singapore ($266 per unit) was amongst the lowest.
From 2013 to 2023, the most notable rate of growth in terms of prices was attained by the United States (+2.7%), while the other global leaders experienced a decline in the import price figures.
Exports
World Exports of Lifting, Handling, Loading Or Unloading Machinery
For the fourth consecutive year, the global market recorded growth in overseas shipments of lifting, handling, loading or unloading machinery, which increased by 2.8% to 7.5M units in 2023. In general, exports posted a remarkable increase. The most prominent rate of growth was recorded in 2017 when exports increased by 31% against the previous year. The global exports peaked in 2023 and are likely to continue growth in the immediate term.
In value terms, loading machinery exports rose sharply to $15.2B in 2023. Over the period under review, total exports indicated strong growth from 2013 to 2023: its value increased at an average annual rate of +5.4% over the last decade. The trend pattern, however, indicated some noticeable fluctuations being recorded throughout the analyzed period. Based on 2023 figures, exports increased by +36.9% against 2020 indices. The growth pace was the most rapid in 2021 when exports increased by 22%. The global exports peaked in 2023 and are likely to continue growth in the immediate term.
Exports By Country
In 2023, China (3.5M units) was the main exporter of lifting, handling, loading or unloading machinery, mixing up 46% of total exports. The United States (1,076K units) held a 14% share (based on physical terms) of total exports, which put it in second place, followed by Germany (5.2%). Australia (324K units), Canada (301K units), Taiwan (Chinese) (278K units), the Netherlands (189K units), India (184K units), Italy (143K units) and France (132K units) held a little share of total exports.
From 2013 to 2023, average annual rates of growth with regard to loading machinery exports from China stood at +5.1%. At the same time, Australia (+27.7%), the Netherlands (+26.1%), France (+25.8%), Italy (+24.4%), the United States (+21.0%), Germany (+20.4%), India (+18.3%) and Canada (+14.8%) displayed positive paces of growth. Moreover, Australia emerged as the fastest-growing exporter exported in the world, with a CAGR of +27.7% from 2013-2023. Taiwan (Chinese) experienced a relatively flat trend pattern. The United States (+9.8 p.p.), Australia (+3.5 p.p.), Germany (+3.5 p.p.), the Netherlands (+2 p.p.) and Canada (+1.8 p.p.) significantly strengthened its position in terms of the global exports, while Taiwan (Chinese) and China saw its share reduced by -3.7% and -14.3% from 2013 to 2023, respectively. The shares of the other countries remained relatively stable throughout the analyzed period.
In value terms, the largest loading machinery supplying countries worldwide were Germany ($3.4B), China ($1.9B) and the Netherlands ($1.2B), with a combined 42% share of global exports. Italy, the United States, France, Canada, Taiwan (Chinese), India and Australia lagged somewhat behind, together accounting for a further 22%.
India, with a CAGR of +17.8%, saw the highest rates of growth with regard to the value of exports, in terms of the main exporting countries over the period under review, while shipments for the other global leaders experienced more modest paces of growth.
Export Prices By Country
The average loading machinery export price stood at $2,036 per unit in 2023, rising by 6.2% against the previous year. Over the period under review, the export price, however, recorded a noticeable slump. Over the period under review, the average export prices reached the peak figure at $2,639 per unit in 2014; however, from 2015 to 2023, the export prices stood at a somewhat lower figure.
There were significant differences in the average prices amongst the major exporting countries. In 2023, amid the top suppliers, the country with the highest price was Germany ($8,616 per unit), while Australia ($152 per unit) was amongst the lowest.
From 2013 to 2023, the most notable rate of growth in terms of prices was attained by China (+3.7%), while the other global leaders experienced mixed trends in the export price figures.
This report provides an in-depth analysis of the global loading machinery market. Within it, you will discover the latest data on market trends and opportunities by country, consumption, production and price developments, as well as the global trade (imports and exports). The forecast exhibits the market prospects through 2030.
Product coverage:
- Prodcom 28221840 - Lifting, handling, loading or unloading machinery, n.e.s.
- Prodcom 28221850 - Loading machinery specially designed for agricultural use
Country coverage:
Worldwide - the report contains statistical data for 200 countries and includes detailed profiles of the 50 largest consuming countries:
- USA
- China
- Japan
- Germany
- United Kingdom
- France
- Brazil
- Italy
- Russian Federation
- India
- Canada
- Australia
- Republic of Korea
- Spain
- Mexico
- Indonesia
- Netherlands
- Turkey
- Saudi Arabia
- Switzerland
- Sweden
- Nigeria
- Poland
- Belgium
- Argentina
- Norway
- Austria
- Thailand
- United Arab Emirates
- Colombia
- Denmark
- South Africa
- Malaysia
- Israel
- Singapore
- Egypt
- Philippines
- Finland
- Chile
- Ireland
- Pakistan
- Greece
- Portugal
- Kazakhstan
- Algeria
- Czech Republic
- Qatar
- Peru
- Romania
- Vietnam
+ the largest producing countries
Data coverage:
- Global market volume and value
- Per Capita consumption
- Forecast of the market dynamics in the medium term
- Global production, split by region and country
- Global trade (exports and imports)
- Export and import prices
- Market trends, drivers and restraints
- Key market players and their profiles
Reasons to buy this report:
- Take advantage of the latest data
- Find deeper insights into current market developments
- Discover vital success factors affecting the market
This report is designed for manufacturers, distributors, importers, and wholesalers, as well as for investors, consultants and advisors.
In this report, you can find information that helps you to make informed decisions on the following issues:
- How to diversify your business and benefit from new market opportunities
- How to load your idle production capacity
- How to boost your sales on overseas markets
- How to increase your profit margins
- How to make your supply chain more sustainable
- How to reduce your production and supply chain costs
- How to outsource production to other countries
- How to prepare your business for global expansion
While doing this research, we combine the accumulated expertise of our analysts and the capabilities of artificial intelligence. The AI-based platform, developed by our data scientists, constitutes the key working tool for business analysts, empowering them to discover deep insights and ideas from the marketing data.
-
1. INTRODUCTION
Making Data-Driven Decisions to Grow Your Business
- REPORT DESCRIPTION
- RESEARCH METHODOLOGY AND AI PLATFORM
- DATA-DRIVEN DECISIONS FOR YOUR BUSINESS
- GLOSSARY AND SPECIFIC TERMS
-
2. EXECUTIVE SUMMARY
A Quick Overview of Market Performance
- KEY FINDINGS
- MARKET TRENDS This Chapter is Available Only for the Professional Edition PRO
-
3. MARKET OVERVIEW
Understanding the Current State of The Market and Its Prospects
- MARKET SIZE
- CONSUMPTION BY COUNTRY
- MARKET FORECAST TO 2030
-
4. MOST PROMISING PRODUCT
Finding New Products to Diversify Your Business
This Chapter is Available Only for the Professional Edition PRO- TOP PRODUCTS TO DIVERSIFY YOUR BUSINESS
- BEST-SELLING PRODUCTS
- MOST CONSUMED PRODUCT
- MOST TRADED PRODUCT
- MOST PROFITABLE PRODUCT FOR EXPORT
-
5. MOST PROMISING SUPPLYING COUNTRIES
Choosing the Best Countries to Establish Your Sustainable Supply Chain
This Chapter is Available Only for the Professional Edition PRO- TOP COUNTRIES TO SOURCE YOUR PRODUCT
- TOP PRODUCING COUNTRIES
- TOP EXPORTING COUNTRIES
- LOW-COST EXPORTING COUNTRIES
-
6. MOST PROMISING OVERSEAS MARKETS
Choosing the Best Countries to Boost Your Exports
This Chapter is Available Only for the Professional Edition PRO- TOP OVERSEAS MARKETS FOR EXPORTING YOUR PRODUCT
- TOP CONSUMING MARKETS
- UNSATURATED MARKETS
- TOP IMPORTING MARKETS
- MOST PROFITABLE MARKETS
7. GLOBAL PRODUCTION
The Latest Trends and Insights into The Industry
- PRODUCTION VOLUME AND VALUE
- PRODUCTION BY COUNTRY
8. GLOBAL IMPORTS
The Largest Importers on The Market and How They Succeed
- IMPORTS FROM 2012–2023
- IMPORTS BY COUNTRY
- IMPORT PRICES BY COUNTRY
9. GLOBAL EXPORTS
The Largest Exporters on The Market and How They Succeed
- EXPORTS FROM 2012–2023
- EXPORTS BY COUNTRY
- EXPORT PRICES BY COUNTRY
-
10. PROFILES OF MAJOR PRODUCERS
The Largest Producers on The Market and Their Profiles
This Chapter is Available Only for the Professional Edition PRO -
11. COUNTRY PROFILES
The Largest Markets And Their Profiles
This Chapter is Available Only for the Professional Edition PRO- United States
- China
- Japan
- Germany
- United Kingdom
- France
- Brazil
- Italy
- Russian Federation
- India
- Canada
- Australia
- Republic of Korea
- Spain
- Mexico
- Indonesia
- Netherlands
- Turkey
- Saudi Arabia
- Switzerland
- Sweden
- Nigeria
- Poland
- Belgium
- Argentina
- Norway
- Austria
- Thailand
- United Arab Emirates
- Colombia
- Denmark
- South Africa
- Malaysia
- Israel
- Singapore
- Egypt
- Philippines
- Finland
- Chile
- Ireland
- Pakistan
- Greece
- Portugal
- Kazakhstan
- Algeria
- Czech Republic
- Qatar
- Peru
- Romania
- Vietnam
-
LIST OF TABLES
- Key Findings In 2023
- Market Volume, In Physical Terms, 2012–2023
- Market Value, 2012–2023
- Per Capita Consumption, By Country, 2018–2023
- Production, In Physical Terms, By Country, 2012–2023
- Imports, In Physical Terms, By Country, 2012–2023
- Imports, In Value Terms, By Country, 2012–2023
- Import Prices, By Country Of Destination, 2012–2023
- Exports, In Physical Terms, By Country, 2012–2023
- Exports, In Value Terms, By Country, 2012–2023
- Export Prices, By Country Of Origin, 2012–2023
-
LIST OF FIGURES
- Market Volume, In Physical Terms, 2012–2023
- Market Value, 2012–2023
- Consumption, By Country, 2023
- Market Volume Forecast to 2030
- Market Value Forecast to 2030
- Products: Market Size And Growth, By Type
- Products: Average Per Capita Consumption, By Type
- Products: Exports And Growth, By Type
- Products: Export Prices And Growth, By Type
- Production Volume And Growth
- Exports And Growth
- Export Prices And Growth
- Market Size And Growth
- Per Capita Consumption
- Imports And Growth
- Import Prices
- Production, In Physical Terms, 2012–2023
- Production, In Value Terms, 2012–2023
- Production, By Country, 2023
- Production, In Physical Terms, By Country, 2012–2023
- Imports, In Physical Terms, 2012–2023
- Imports, In Value Terms, 2012–2023
- Imports, In Physical Terms, By Country, 2023
- Imports, In Physical Terms, By Country, 2012–2023
- Imports, In Value Terms, By Country, 2012–2023
- Import Prices, By Country, 2012–2023
- Exports, In Physical Terms, 2012–2023
- Exports, In Value Terms, 2012–2023
- Exports, In Physical Terms, By Country, 2023
- Exports, In Physical Terms, By Country, 2012–2023
- Exports, In Value Terms, By Country, 2012–2023
- Export Prices, 2012–2023


