
World - Dextrins And Other Modified Starches - Market Analysis, Forecast, Size, Trends And Insights
Get instant access to more than 2 million reports, dashboards, and datasets on the IndexBox Platform.
View PricingGlobal Modified Starch Market to Witness Steady Growth with a CAGR of +1.6% by 2030
IndexBox has just published a new report: World - Dextrins And Other Modified Starches - Market Analysis, Forecast, Size, Trends And Insights.
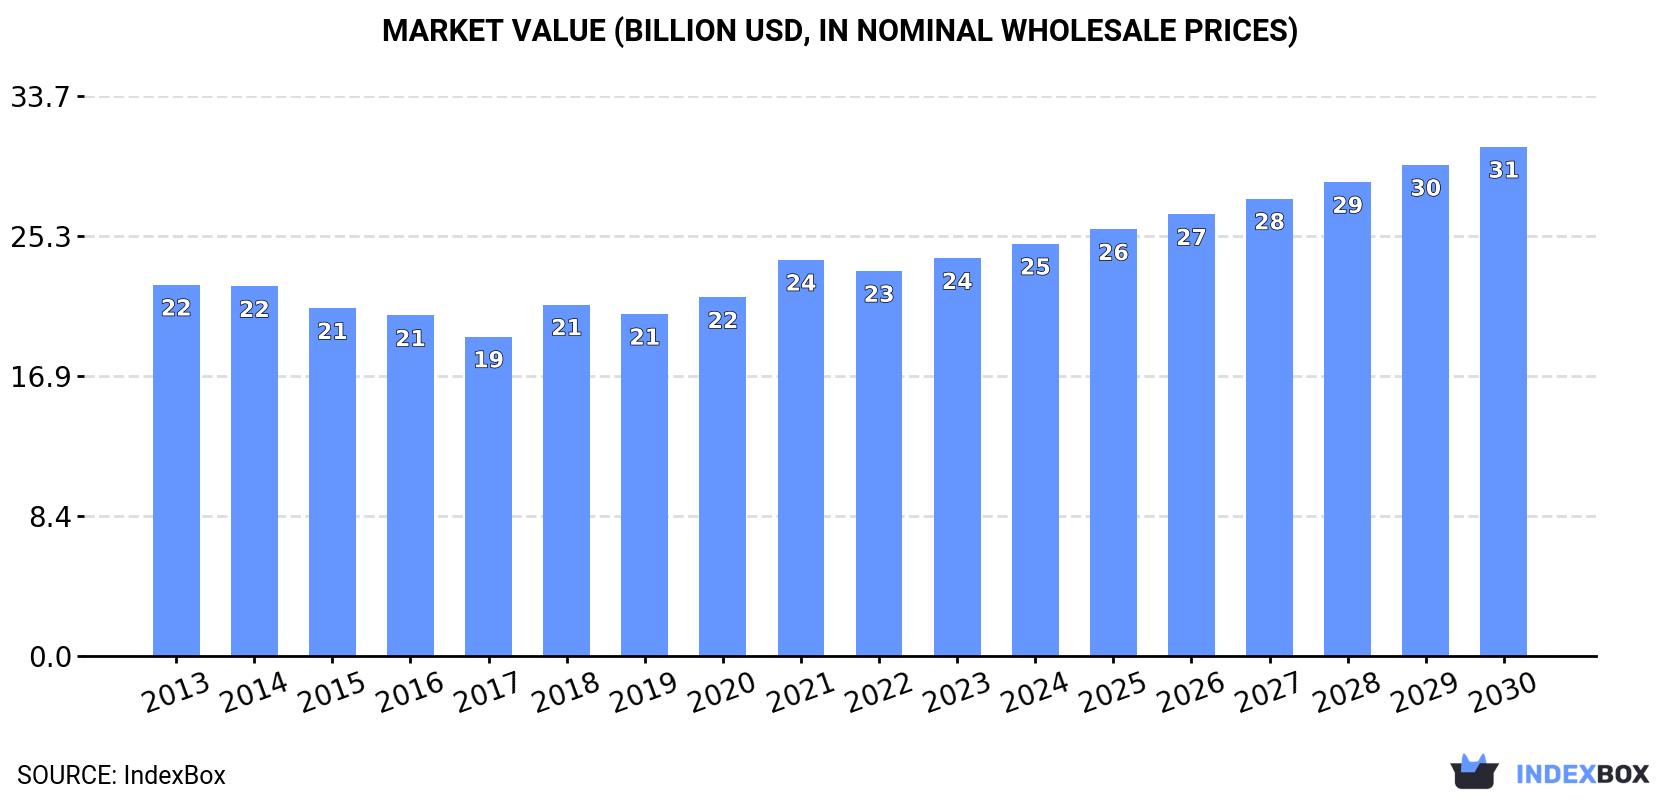
Driven by rising demand, the global modified starch market is expected to see a slight increase in performance over the next seven years. With a projected CAGR of +1.6% in volume and +3.6% in value, the market is anticipated to reach 20M tons and $30.7B by the end of 2030, respectively.
Market Forecast
Driven by rising demand for modified starches worldwide, the market is expected to start an upward consumption trend over the next seven years. The performance of the market is forecast to increase slightly, with an anticipated CAGR of +1.6% for the period from 2023 to 2030, which is projected to bring the market volume to 20M tons by the end of 2030.
In value terms, the market is forecast to increase with an anticipated CAGR of +3.6% for the period from 2023 to 2030, which is projected to bring the market value to $30.7B (in nominal wholesale prices) by the end of 2030.
Consumption
World Consumption of Dextrins And Other Modified Starches
Global modified starches consumption totaled 18M tons in 2023, approximately mirroring 2022 figures. In general, consumption, however, showed a relatively flat trend pattern. The growth pace was the most rapid in 2018 when the consumption volume increased by 6.5%. Over the period under review, global consumption reached the maximum volume at 19M tons in 2013; however, from 2014 to 2023, consumption stood at a somewhat lower figure.
The global modified starches market value was estimated at $24B in 2023, increasing by 3.3% against the previous year. This figure reflects the total revenues of producers and importers (excluding logistics costs, retail marketing costs, and retailers' margins, which will be included in the final consumer price). Over the period under review, consumption continues to indicate a relatively flat trend pattern. Over the period under review, the global market attained the peak level in 2023 and is expected to retain growth in the immediate term.
Consumption By Country
China (3.1M tons) constituted the country with the largest volume of modified starches consumption, accounting for 17% of total volume. Moreover, modified starches consumption in China exceeded the figures recorded by the second-largest consumer, the United States (1.4M tons), twofold. The third position in this ranking was held by India (1.2M tons), with a 6.8% share.
In China, modified starches consumption expanded at an average annual rate of +2.1% over the period from 2013-2023. The remaining consuming countries recorded the following average annual rates of consumption growth: the United States (-1.5% per year) and India (+1.4% per year).
In value terms, China ($4.1B) led the market, alone. The second position in the ranking was taken by the United States ($1.8B). It was followed by Pakistan.
From 2013 to 2023, the average annual rate of growth in terms of value in China stood at +6.0%. In the other countries, the average annual rates were as follows: the United States (+0.9% per year) and Pakistan (-2.2% per year).
In 2023, the highest levels of modified starches per capita consumption was registered in the Netherlands (23 kg per person), followed by Thailand (4.4 kg per person), the United States (4.3 kg per person) and Japan (3.8 kg per person), while the world average per capita consumption of modified starches was estimated at 2.3 kg per person.
From 2013 to 2023, the average annual rate of growth in terms of the modified starches per capita consumption in the Netherlands was relatively modest. The remaining consuming countries recorded the following average annual rates of per capita consumption growth: Thailand (+4.0% per year) and the United States (-2.1% per year).
Production
World Production of Dextrins And Other Modified Starches
In 2023, global modified starches production was estimated at 18M tons, standing approx. at the year before. Over the period under review, production, however, saw a relatively flat trend pattern. The pace of growth appeared the most rapid in 2018 when the production volume increased by 4.9% against the previous year. Global production peaked at 19M tons in 2013; however, from 2014 to 2023, production stood at a somewhat lower figure.
In value terms, modified starches production rose to $22.9B in 2023 estimated in export price. In general, production showed a relatively flat trend pattern. The pace of growth appeared the most rapid in 2021 when the production volume increased by 11%. As a result, production attained the peak level of $23.3B. From 2022 to 2023, global production growth failed to regain momentum.
Production By Country
The countries with the highest volumes of production in 2023 were China (2.8M tons), the United States (1.6M tons) and Thailand (1.3M tons), with a combined 31% share of global production. India, the Netherlands, Pakistan, Brazil, Nigeria, Russia, France, Mexico, Bangladesh and Indonesia lagged somewhat behind, together accounting for a further 29%.
From 2013 to 2023, the most notable rate of growth in terms of production, amongst the key producing countries, was attained by Nigeria (with a CAGR of +9.3%), while production for the other global leaders experienced more modest paces of growth.
Imports
World Imports of Dextrins And Other Modified Starches
After three years of growth, supplies from abroad of dextrins and other modified starches decreased by -11.9% to 3.7M tons in 2023. In general, imports, however, saw a relatively flat trend pattern. The most prominent rate of growth was recorded in 2021 when imports increased by 8%. Over the period under review, global imports hit record highs at 4.2M tons in 2022, and then declined in the following year.
In value terms, modified starches imports amounted to $5.2B in 2023. Over the period under review, total imports indicated a noticeable expansion from 2013 to 2023: its value increased at an average annual rate of +3.3% over the last decade. The trend pattern, however, indicated some noticeable fluctuations being recorded throughout the analyzed period. Based on 2023 figures, imports increased by +40.7% against 2020 indices. The pace of growth was the most pronounced in 2022 with an increase of 19% against the previous year. Global imports peaked in 2023 and are likely to see steady growth in the immediate term.
Imports By Country
The purchases of the three major importers of dextrins and other modified starches, namely China, Japan and Germany, represented more than fourth of total import. It was distantly followed by Indonesia (184K tons), achieving a 5% share of total imports. The United States (143K tons), South Korea (138K tons), the Netherlands (109K tons), France (101K tons), Canada (99K tons), the UK (98K tons), Russia (81K tons), Poland (74K tons) and Sweden (73K tons) followed a long way behind the leaders.
From 2013 to 2023, the most notable rate of growth in terms of purchases, amongst the leading importing countries, was attained by the United States (with a CAGR of +5.4%), while imports for the other global leaders experienced more modest paces of growth.
In value terms, the largest modified starches importing markets worldwide were China ($554M), Germany ($493M) and Japan ($423M), together comprising 28% of global imports. The United States, France, the UK, the Netherlands, Indonesia, Canada, South Korea, Poland, Russia and Sweden lagged somewhat behind, together comprising a further 32%.
In terms of the main importing countries, the United States, with a CAGR of +6.7%, recorded the highest growth rate of the value of imports, over the period under review, while purchases for the other global leaders experienced more modest paces of growth.
Import Prices By Country
In 2023, the average modified starches import price amounted to $1,419 per ton, increasing by 18% against the previous year. Over the period from 2013 to 2023, it increased at an average annual rate of +2.9%. As a result, import price attained the peak level and is likely to continue growth in the immediate term.
Prices varied noticeably by country of destination: amid the top importers, the country with the highest price was France ($2,089 per ton), while Indonesia ($897 per ton) was amongst the lowest.
From 2013 to 2023, the most notable rate of growth in terms of prices was attained by the UK (+5.8%), while the other global leaders experienced more modest paces of growth.
Exports
World Exports of Dextrins And Other Modified Starches
In 2023, shipments abroad of dextrins and other modified starches decreased by -10.2% to 3.4M tons for the first time since 2019, thus ending a three-year rising trend. Overall, exports, however, showed a relatively flat trend pattern. The most prominent rate of growth was recorded in 2021 with an increase of 9.9%. The global exports peaked at 3.8M tons in 2022, and then declined in the following year.
In value terms, modified starches exports rose remarkably to $4.8B in 2023. In general, total exports indicated tangible growth from 2013 to 2023: its value increased at an average annual rate of +3.9% over the last decade. The trend pattern, however, indicated some noticeable fluctuations being recorded throughout the analyzed period. Based on 2023 figures, exports increased by +49.0% against 2018 indices. The most prominent rate of growth was recorded in 2021 when exports increased by 15%. Over the period under review, the global exports attained the peak figure in 2023 and are expected to retain growth in years to come.
Exports By Country
Thailand represented the key exporting country with an export of about 1M tons, which resulted at 30% of total exports. It was distantly followed by the Netherlands (447K tons), the United States (279K tons), Germany (254K tons), France (233K tons), Vietnam (203K tons) and China (157K tons), together comprising a 46% share of total exports. Belgium (130K tons), Italy (85K tons), India (79K tons), Sweden (59K tons) and Lithuania (51K tons) followed a long way behind the leaders.
From 2013 to 2023, average annual rates of growth with regard to modified starches exports from Thailand stood at +1.2%. At the same time, Belgium (+25.6%), Lithuania (+13.7%), Vietnam (+11.2%), India (+5.7%), Sweden (+3.1%) and China (+2.6%) displayed positive paces of growth. Moreover, Belgium emerged as the fastest-growing exporter exported in the world, with a CAGR of +25.6% from 2013-2023. The Netherlands experienced a relatively flat trend pattern. By contrast, Germany (-1.1%), Italy (-3.4%), the United States (-4.4%) and France (-5.6%) illustrated a downward trend over the same period. From 2013 to 2023, the share of Vietnam, Belgium and Thailand increased by +3.9, +3.4 and +2.5 percentage points, respectively. The shares of the other countries remained relatively stable throughout the analyzed period.
In value terms, Thailand ($934M), the Netherlands ($850M) and Germany ($550M) appeared to be the countries with the highest levels of exports in 2023, together accounting for 49% of global exports. The United States, France, China, Belgium, Vietnam, Italy, Sweden, India and Lithuania lagged somewhat behind, together comprising a further 38%.
Among the main exporting countries, Belgium, with a CAGR of +35.5%, recorded the highest rates of growth with regard to the value of exports, over the period under review, while shipments for the other global leaders experienced more modest paces of growth.
Export Prices By Country
The average modified starches export price stood at $1,409 per ton in 2023, rising by 25% against the previous year. In general, export price indicated noticeable growth from 2013 to 2023: its price increased at an average annual rate of +3.6% over the last decade. The trend pattern, however, indicated some noticeable fluctuations being recorded throughout the analyzed period. Based on 2023 figures, modified starches export price increased by +50.9% against 2020 indices. As a result, the export price reached the peak level and is likely to continue growth in the immediate term.
There were significant differences in the average prices amongst the major exporting countries. In 2023, amid the top suppliers, the country with the highest price was Germany ($2,166 per ton), while Vietnam ($673 per ton) was amongst the lowest.
From 2013 to 2023, the most notable rate of growth in terms of prices was attained by Belgium (+7.8%), while the other global leaders experienced more modest paces of growth.
This report provides an in-depth analysis of the global modified starches market. Within it, you will discover the latest data on market trends and opportunities by country, consumption, production and price developments, as well as the global trade (imports and exports). The forecast exhibits the market prospects through 2030.
Product coverage:
- Prodcom 10621170 - Dextrins and other modified starches (including esterified or etherified, soluble starch, pregelatinised or swelling starch, d ialdehyde starch, starch treated with formaldehyde or epichlorohydrin)
Country coverage:
Worldwide - the report contains statistical data for 200 countries and includes detailed profiles of the 50 largest consuming countries:
- USA
- China
- Japan
- Germany
- United Kingdom
- France
- Brazil
- Italy
- Russian Federation
- India
- Canada
- Australia
- Republic of Korea
- Spain
- Mexico
- Indonesia
- Netherlands
- Turkey
- Saudi Arabia
- Switzerland
- Sweden
- Nigeria
- Poland
- Belgium
- Argentina
- Norway
- Austria
- Thailand
- United Arab Emirates
- Colombia
- Denmark
- South Africa
- Malaysia
- Israel
- Singapore
- Egypt
- Philippines
- Finland
- Chile
- Ireland
- Pakistan
- Greece
- Portugal
- Kazakhstan
- Algeria
- Czech Republic
- Qatar
- Peru
- Romania
- Vietnam
+ the largest producing countries
Data coverage:
- Global market volume and value
- Per Capita consumption
- Forecast of the market dynamics in the medium term
- Global production, split by region and country
- Global trade (exports and imports)
- Export and import prices
- Market trends, drivers and restraints
- Key market players and their profiles
Reasons to buy this report:
- Take advantage of the latest data
- Find deeper insights into current market developments
- Discover vital success factors affecting the market
This report is designed for manufacturers, distributors, importers, and wholesalers, as well as for investors, consultants and advisors.
In this report, you can find information that helps you to make informed decisions on the following issues:
- How to diversify your business and benefit from new market opportunities
- How to load your idle production capacity
- How to boost your sales on overseas markets
- How to increase your profit margins
- How to make your supply chain more sustainable
- How to reduce your production and supply chain costs
- How to outsource production to other countries
- How to prepare your business for global expansion
While doing this research, we combine the accumulated expertise of our analysts and the capabilities of artificial intelligence. The AI-based platform, developed by our data scientists, constitutes the key working tool for business analysts, empowering them to discover deep insights and ideas from the marketing data.
-
1. INTRODUCTION
Making Data-Driven Decisions to Grow Your Business
- REPORT DESCRIPTION
- RESEARCH METHODOLOGY AND AI PLATFORM
- DATA-DRIVEN DECISIONS FOR YOUR BUSINESS
- GLOSSARY AND SPECIFIC TERMS
-
2. EXECUTIVE SUMMARY
A Quick Overview of Market Performance
- KEY FINDINGS
- MARKET TRENDS This Chapter is Available Only for the Professional Edition PRO
-
3. MARKET OVERVIEW
Understanding the Current State of The Market and Its Prospects
- MARKET SIZE
- CONSUMPTION BY COUNTRY
- MARKET FORECAST TO 2030
-
4. MOST PROMISING PRODUCT
Finding New Products to Diversify Your Business
This Chapter is Available Only for the Professional Edition PRO- TOP PRODUCTS TO DIVERSIFY YOUR BUSINESS
- BEST-SELLING PRODUCTS
- MOST CONSUMED PRODUCT
- MOST TRADED PRODUCT
- MOST PROFITABLE PRODUCT FOR EXPORT
-
5. MOST PROMISING SUPPLYING COUNTRIES
Choosing the Best Countries to Establish Your Sustainable Supply Chain
This Chapter is Available Only for the Professional Edition PRO- TOP COUNTRIES TO SOURCE YOUR PRODUCT
- TOP PRODUCING COUNTRIES
- TOP EXPORTING COUNTRIES
- LOW-COST EXPORTING COUNTRIES
-
6. MOST PROMISING OVERSEAS MARKETS
Choosing the Best Countries to Boost Your Exports
This Chapter is Available Only for the Professional Edition PRO- TOP OVERSEAS MARKETS FOR EXPORTING YOUR PRODUCT
- TOP CONSUMING MARKETS
- UNSATURATED MARKETS
- TOP IMPORTING MARKETS
- MOST PROFITABLE MARKETS
7. GLOBAL PRODUCTION
The Latest Trends and Insights into The Industry
- PRODUCTION VOLUME AND VALUE
- PRODUCTION BY COUNTRY
8. GLOBAL IMPORTS
The Largest Importers on The Market and How They Succeed
- IMPORTS FROM 2012–2023
- IMPORTS BY COUNTRY
- IMPORT PRICES BY COUNTRY
9. GLOBAL EXPORTS
The Largest Exporters on The Market and How They Succeed
- EXPORTS FROM 2012–2023
- EXPORTS BY COUNTRY
- EXPORT PRICES BY COUNTRY
-
10. PROFILES OF MAJOR PRODUCERS
The Largest Producers on The Market and Their Profiles
This Chapter is Available Only for the Professional Edition PRO -
11. COUNTRY PROFILES
The Largest Markets And Their Profiles
This Chapter is Available Only for the Professional Edition PRO- United States
- China
- Japan
- Germany
- United Kingdom
- France
- Brazil
- Italy
- Russian Federation
- India
- Canada
- Australia
- Republic of Korea
- Spain
- Mexico
- Indonesia
- Netherlands
- Turkey
- Saudi Arabia
- Switzerland
- Sweden
- Nigeria
- Poland
- Belgium
- Argentina
- Norway
- Austria
- Thailand
- United Arab Emirates
- Colombia
- Denmark
- South Africa
- Malaysia
- Israel
- Singapore
- Egypt
- Philippines
- Finland
- Chile
- Ireland
- Pakistan
- Greece
- Portugal
- Kazakhstan
- Algeria
- Czech Republic
- Qatar
- Peru
- Romania
- Vietnam
-
LIST OF TABLES
- Key Findings In 2023
- Market Volume, In Physical Terms, 2012–2023
- Market Value, 2012–2023
- Per Capita Consumption, By Country, 2018–2023
- Production, In Physical Terms, By Country, 2012–2023
- Imports, In Physical Terms, By Country, 2012–2023
- Imports, In Value Terms, By Country, 2012–2023
- Import Prices, By Country Of Destination, 2012–2023
- Exports, In Physical Terms, By Country, 2012–2023
- Exports, In Value Terms, By Country, 2012–2023
- Export Prices, By Country Of Origin, 2012–2023
-
LIST OF FIGURES
- Market Volume, In Physical Terms, 2012–2023
- Market Value, 2012–2023
- Consumption, By Country, 2023
- Market Volume Forecast to 2030
- Market Value Forecast to 2030
- Products: Market Size And Growth, By Type
- Products: Average Per Capita Consumption, By Type
- Products: Exports And Growth, By Type
- Products: Export Prices And Growth, By Type
- Production Volume And Growth
- Exports And Growth
- Export Prices And Growth
- Market Size And Growth
- Per Capita Consumption
- Imports And Growth
- Import Prices
- Production, In Physical Terms, 2012–2023
- Production, In Value Terms, 2012–2023
- Production, By Country, 2023
- Production, In Physical Terms, By Country, 2012–2023
- Imports, In Physical Terms, 2012–2023
- Imports, In Value Terms, 2012–2023
- Imports, In Physical Terms, By Country, 2023
- Imports, In Physical Terms, By Country, 2012–2023
- Imports, In Value Terms, By Country, 2012–2023
- Import Prices, By Country, 2012–2023
- Exports, In Physical Terms, 2012–2023
- Exports, In Value Terms, 2012–2023
- Exports, In Physical Terms, By Country, 2023
- Exports, In Physical Terms, By Country, 2012–2023
- Exports, In Value Terms, By Country, 2012–2023
- Export Prices, 2012–2023


