
Spain - Cheese and Curd - Market Analysis, Forecast, Size, Trends And Insights
Get instant access to more than 2 million reports, dashboards, and datasets on the IndexBox Platform.
View PricingSpain's Cheese and Curd Imports Surge by 7%, Reaching a Record $2 Billion in 2023
Spain Cheese and Curd Imports
In 2023, supplies from abroad of cheese and curd decreased by -5.6% to 363K tons for the first time since 2020, thus ending a two-year rising trend. The total import volume increased at an average annual rate of +3.1% over the period from 2013 to 2023; however, the trend pattern indicated some noticeable fluctuations being recorded in certain years. The pace of growth was the most pronounced in 2022 when imports increased by 20%. As a result, imports attained the peak of 385K tons, and then shrank in the following year.
In value terms, cheese and curd imports expanded markedly to $2B (IndexBox estimates) in 2023. In general, total imports indicated strong growth from 2013 to 2023: its value increased at an average annual rate of +5.1% over the last decade. The trend pattern, however, indicated some noticeable fluctuations being recorded throughout the analyzed period. Based on 2023 figures, imports increased by +67.7% against 2020 indices. The growth pace was the most rapid in 2022 with an increase of 39%. Imports peaked in 2023 and are likely to continue growth in years to come.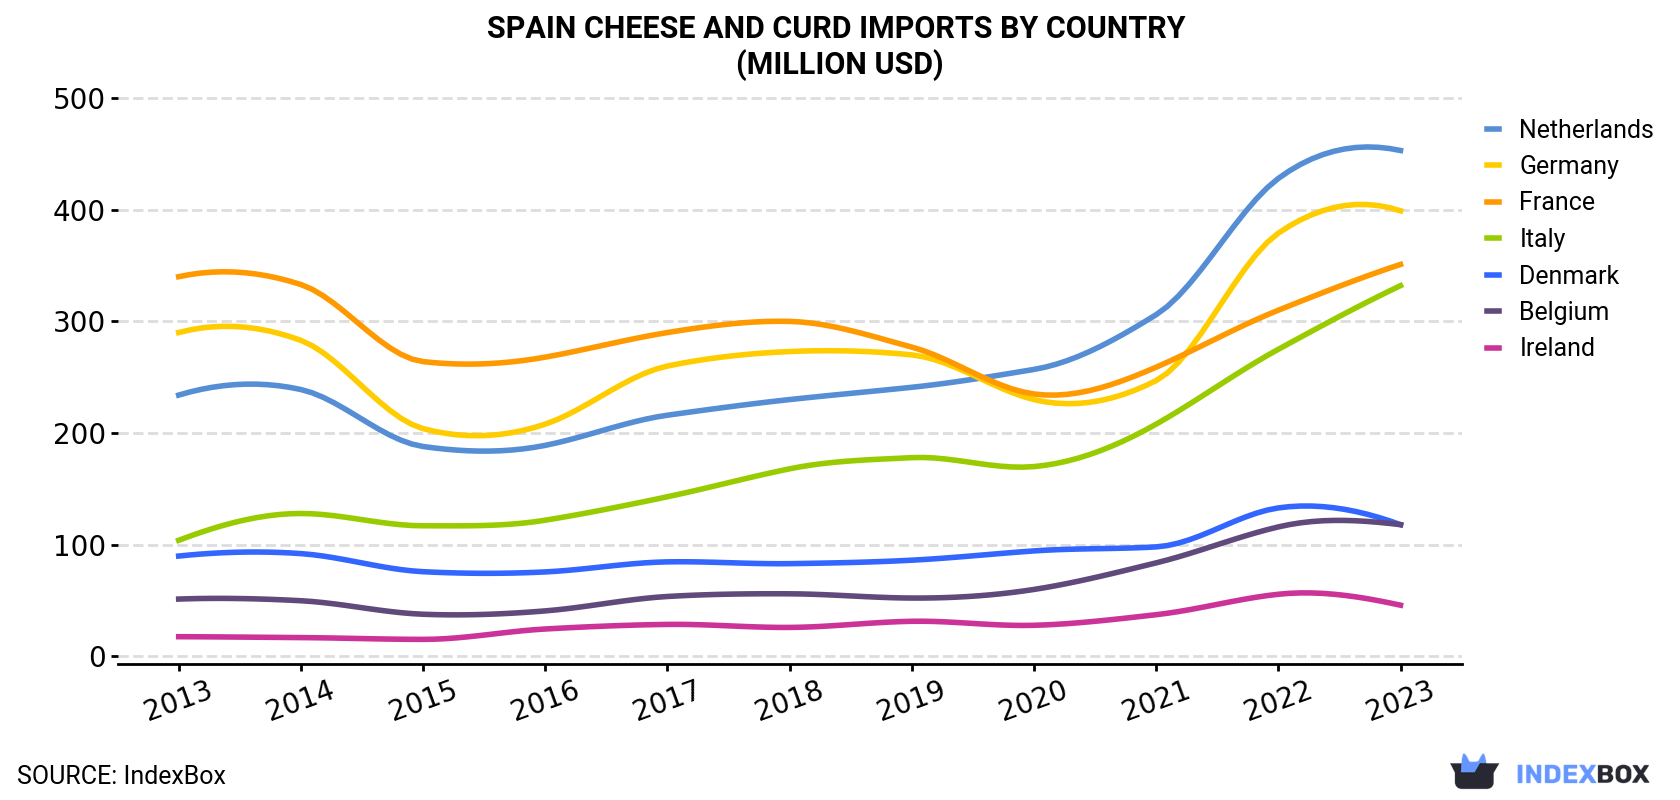
| COUNTRY | Import Value of Cheese and Curd in Spain (million USD) | ||||||||||
|---|---|---|---|---|---|---|---|---|---|---|---|
| 2013 | 2014 | 2015 | 2016 | 2017 | 2018 | 2019 | 2020 | 2021 | 2022 | 2023 | |
| Netherlands | 234 | 239 | 188 | 189 | 216 | 230 | 241 | 257 | 306 | 428 | 453 |
| Germany | 290 | 283 | 204 | 208 | 260 | 273 | 270 | 230 | 247 | 379 | 399 |
| France | 340 | 333 | 264 | 268 | 290 | 300 | 277 | 235 | 259 | 310 | 351 |
| Italy | 104 | 128 | 117 | 122 | 143 | 168 | 178 | 170 | 208 | 275 | 332 |
| Denmark | 89.9 | 92.1 | 75.9 | 75.7 | 84.7 | 83.1 | 86.2 | 94.5 | 98.1 | 133 | 118 |
| Belgium | 51.4 | 49.9 | 37.8 | 40.8 | 53.7 | 56.1 | 52.3 | 60.0 | 83.8 | 116 | 118 |
| Ireland | 17.7 | 16.9 | 15.3 | 24.6 | 28.7 | 26.0 | 31.5 | 27.9 | 37.4 | 55.7 | 45.9 |
| Others | 69.5 | 78.7 | 71.1 | 72.7 | 87.2 | 101 | 109 | 102 | 81.2 | 141 | 155 |
| Total | 1,196 | 1,221 | 974 | 1,002 | 1,164 | 1,237 | 1,245 | 1,176 | 1,321 | 1,839 | 1,973 |
Imports by Country
the Netherlands (92K tons), Germany (79K tons) and France (61K tons) were the main suppliers of cheese and curd imports to Spain, with a combined 64% share of total imports. Italy, Belgium, Denmark and Ireland lagged somewhat behind, together comprising a further 28%.
From 2013 to 2023, the most notable rate of growth in terms of purchases, amongst the main suppliers, was attained by Ireland (with a CAGR of +8.6%), while imports for the other leaders experienced more modest paces of growth.
In value terms, the Netherlands ($453M), Germany ($399M) and France ($351M) were the largest cheese and curd suppliers to Spain, with a combined 61% share of total imports. Italy, Belgium, Denmark and Ireland lagged somewhat behind, together comprising a further 31%.
In terms of the main suppliers, Italy, with a CAGR of +12.3%, saw the highest growth rate of the value of imports, over the period under review, while purchases for the other leaders experienced more modest paces of growth.
Imports by Type
Cheese, other than blue-veined, grated, powdered or processed (192K tons), unripened or uncured cheese (128K tons) and cheese of all kinds, grated or powdered (24K tons) were the main products of cheese and curd imports to Spain, together accounting for 95% of total imports.
From 2013 to 2023, the biggest increases were recorded for unripened or uncured cheese (with a CAGR of +5.8%), while purchases for the other products experienced more modest paces of growth.
In value terms, cheese, other than blue-veined, grated, powdered or processed ($1.1B) constituted the largest type of cheese and curd supplied to Spain, comprising 57% of total imports. The second position in the ranking was taken by unripened or uncured cheese ($553M), with a 28% share of total imports. It was followed by cheese of all kinds, grated or powdered, with an 8% share.
Import Prices by Country
In 2023, the cheese and curd price amounted to $5,434 per ton (CIF, Spain), growing by 14% against the previous year. Over the last decade, it increased at an average annual rate of +2.0%. The most prominent rate of growth was recorded in 2022 when the average import price increased by 16% against the previous year. The import price peaked in 2023 and is likely to see gradual growth in the near future.
Prices varied noticeably by country of origin: amid the top importers, the country with the highest price was Italy ($8,088 per ton), while the price for Belgium ($4,288 per ton) was amongst the lowest.
From 2013 to 2023, the most notable rate of growth in terms of prices was attained by Italy (+3.5%), while the prices for the other major suppliers experienced more modest paces of growth.
This report provides an in-depth analysis of the cheese and curd market in Spain. Within it, you will discover the latest data on market trends and opportunities by country, consumption, production and price developments, as well as the global trade (imports and exports). The forecast exhibits the market prospects through 2030.
Product coverage:
- FCL 901 - Cheese from Whole Cow Milk
- FCL 904 - Cheese from Skimmed Cow Milk
- FCL 905 - Whey Cheese
- FCL 907 - Processed Cheese
- FCL 955 - Cheese of Buffalo Milk
- FCL 984 - Cheese of Sheep Milk
- FCL 1021 - Cheese of Goat Milk
Country coverage:
- Spain
Data coverage:
- Market volume and value
- Per Capita consumption
- Forecast of the market dynamics in the medium term
- Trade (exports and imports) in Spain
- Export and import prices
- Market trends, drivers and restraints
- Key market players and their profiles
Reasons to buy this report:
- Take advantage of the latest data
- Find deeper insights into current market developments
- Discover vital success factors affecting the market
This report is designed for manufacturers, distributors, importers, and wholesalers, as well as for investors, consultants and advisors.
In this report, you can find information that helps you to make informed decisions on the following issues:
- How to diversify your business and benefit from new market opportunities
- How to load your idle production capacity
- How to boost your sales on overseas markets
- How to increase your profit margins
- How to make your supply chain more sustainable
- How to reduce your production and supply chain costs
- How to outsource production to other countries
- How to prepare your business for global expansion
While doing this research, we combine the accumulated expertise of our analysts and the capabilities of artificial intelligence. The AI-based platform, developed by our data scientists, constitutes the key working tool for business analysts, empowering them to discover deep insights and ideas from the marketing data.
-
1. INTRODUCTION
Making Data-Driven Decisions to Grow Your Business
- REPORT DESCRIPTION
- RESEARCH METHODOLOGY AND AI PLATFORM
- DATA-DRIVEN DECISIONS FOR YOUR BUSINESS
- GLOSSARY AND SPECIFIC TERMS
-
2. EXECUTIVE SUMMARY
A Quick Overview of Market Performance
- KEY FINDINGS
- MARKET TRENDS This Chapter is Available Only for the Professional Edition PRO
-
3. MARKET OVERVIEW
Understanding the Current State of The Market and Its Prospects
- MARKET SIZE
- MARKET STRUCTURE
- TRADE BALANCE
- PER CAPITA CONSUMPTION
- MARKET FORECAST TO 2030
-
4. MOST PROMISING PRODUCT
Finding New Products to Diversify Your Business
This Chapter is Available Only for the Professional Edition PRO- TOP PRODUCTS TO DIVERSIFY YOUR BUSINESS
- BEST-SELLING PRODUCTS
- MOST CONSUMED PRODUCT
- MOST TRADED PRODUCT
- MOST PROFITABLE PRODUCT FOR EXPORT
-
5. MOST PROMISING SUPPLYING COUNTRIES
Choosing the Best Countries to Establish Your Sustainable Supply Chain
This Chapter is Available Only for the Professional Edition PRO- TOP COUNTRIES TO SOURCE YOUR PRODUCT
- TOP PRODUCING COUNTRIES
- TOP EXPORTING COUNTRIES
- LOW-COST EXPORTING COUNTRIES
-
6. MOST PROMISING OVERSEAS MARKETS
Choosing the Best Countries to Boost Your Exports
This Chapter is Available Only for the Professional Edition PRO- TOP OVERSEAS MARKETS FOR EXPORTING YOUR PRODUCT
- TOP CONSUMING MARKETS
- UNSATURATED MARKETS
- TOP IMPORTING MARKETS
- MOST PROFITABLE MARKETS
7. PRODUCTION
The Latest Trends and Insights into The Industry
- PRODUCTION VOLUME AND VALUE
8. IMPORTS
The Largest Import Supplying Countries
- IMPORTS FROM 2012–2023
- IMPORTS BY COUNTRY
- IMPORT PRICES BY COUNTRY
9. EXPORTS
The Largest Destinations for Exports
- EXPORTS FROM 2012–2023
- EXPORTS BY COUNTRY
- EXPORT PRICES BY COUNTRY
-
10. PROFILES OF MAJOR PRODUCERS
The Largest Producers on The Market and Their Profiles
This Chapter is Available Only for the Professional Edition PRO -
LIST OF TABLES
- Key Findings In 2023
- Market Volume, In Physical Terms, 2012–2023
- Market Value, 2012–2023
- Per Capita Consumption In 2012-2023
- Imports, In Physical Terms, By Country, 2012–2023
- Imports, In Value Terms, By Country, 2012–2023
- Import Prices, By Country Of Origin, 2012–2023
- Exports, In Physical Terms, By Country, 2012–2023
- Exports, In Value Terms, By Country, 2012–2023
- Export Prices, By Country Of Destination, 2012–2023
-
LIST OF FIGURES
- Market Volume, In Physical Terms, 2012–2023
- Market Value, 2012–2023
- Market Structure – Domestic Supply vs. Imports, In Physical Terms, 2012-2023
- Market Structure – Domestic Supply vs. Imports, In Value Terms, 2012-2023
- Trade Balance, In Physical Terms, 2012-2023
- Trade Balance, In Value Terms, 2012-2023
- Per Capita Consumption, 2012-2023
- Market Volume Forecast to 2030
- Market Value Forecast to 2030
- Products: Market Size And Growth, By Type
- Products: Average Per Capita Consumption, By Type
- Products: Exports And Growth, By Type
- Products: Export Prices And Growth, By Type
- Production Volume And Growth
- Exports And Growth
- Export Prices And Growth
- Market Size And Growth
- Per Capita Consumption
- Imports And Growth
- Import Prices
- Production, In Physical Terms, 2012–2023
- Production, In Value Terms, 2012–2023
- Imports, In Physical Terms, 2012–2023
- Imports, In Value Terms, 2012–2023
- Imports, In Physical Terms, By Country, 2023
- Imports, In Physical Terms, By Country, 2012–2023
- Imports, In Value Terms, By Country, 2012–2023
- Import Prices, By Country Of Origin, 2012–2023
- Exports, In Physical Terms, 2012–2023
- Exports, In Value Terms, 2012–2023
- Exports, In Physical Terms, By Country, 2023
- Exports, In Physical Terms, By Country, 2012–2023
- Exports, In Value Terms, By Country, 2012–2023
- Export Prices, By Country Of Destination, 2012–2023


