World - Syringes, With or Without Needles - Market Analysis, Forecast, Size, Trends and Insights
Get instant access to more than 2 million reports, dashboards, and datasets on the IndexBox Platform.
View PricingGlobal Syringes Market: Projected to Reach 112B Units by 2030, Valued at $28.8B
IndexBox has just published a new report: World - Syringes, With or Without Needles - Market Analysis, Forecast, Size, Trends and Insights.
The global syringes market is poised for significant growth over the next seven years, with an expected increase in both volume and value. Market performance is forecasted to accelerate, with a projected CAGR of +2.2% in volume, reaching 112B units, and +5.3% in value, reaching $28.8B by the end of 2030. The rising demand for syringes worldwide is driving this upward consumption trend.
Market Forecast
Driven by increasing demand for syringes, with or without needles worldwide, the market is expected to continue an upward consumption trend over the next seven-year period. Market performance is forecast to accelerate, expanding with an anticipated CAGR of +2.2% for the period from 2023 to 2030, which is projected to bring the market volume to 112B units by the end of 2030.
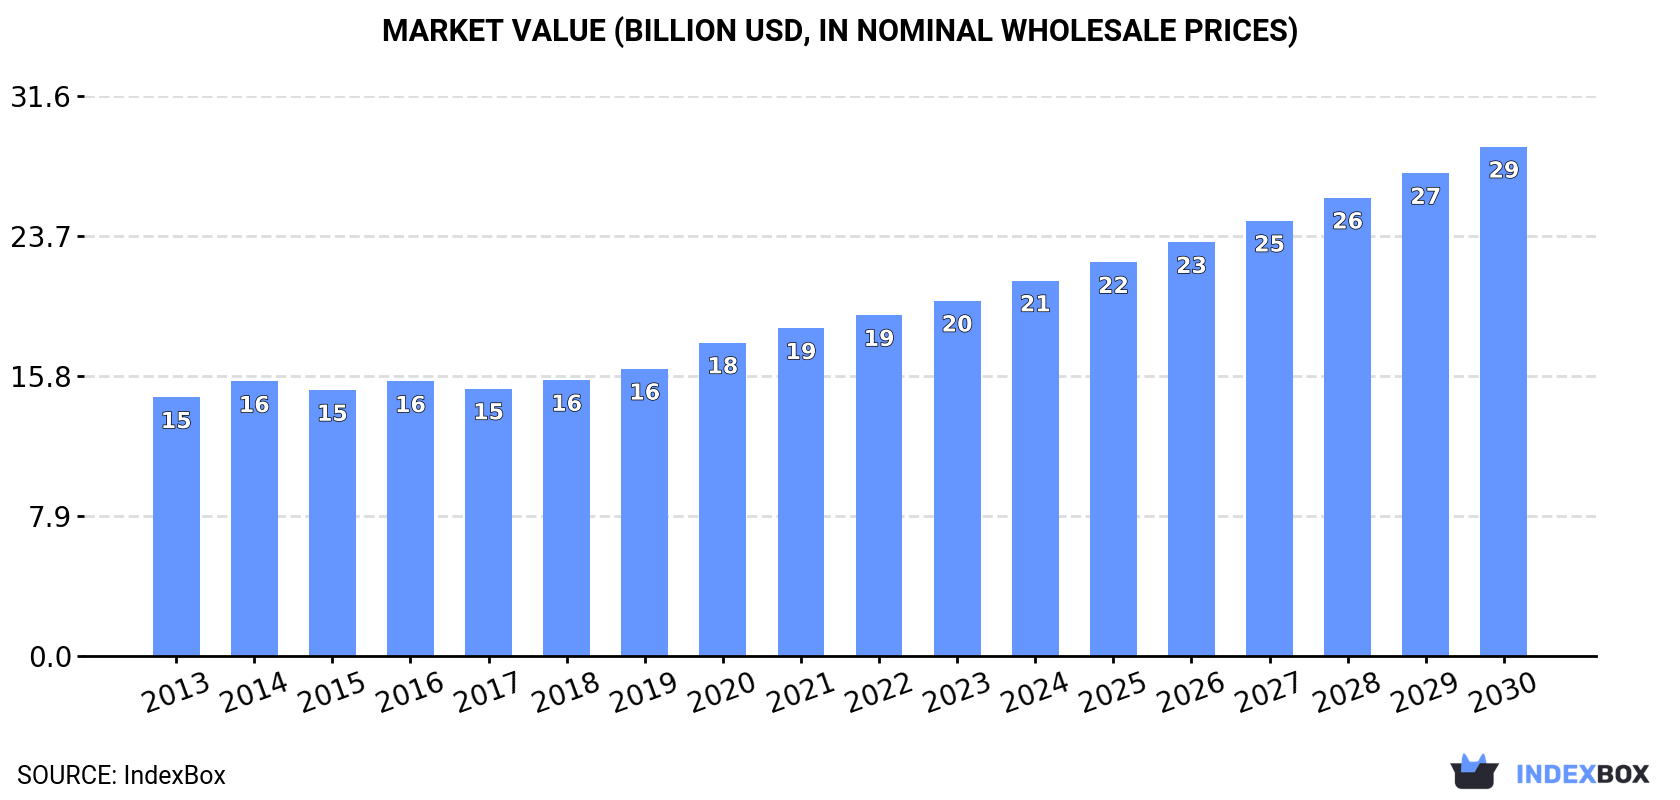
In value terms, the market is forecast to increase with an anticipated CAGR of +5.3% for the period from 2023 to 2030, which is projected to bring the market value to $28.8B (in nominal wholesale prices) by the end of 2030.
Consumption
World Consumption of Syringes, With Or Without Needles
In 2023, the amount of syringes, with or without needles consumed worldwide declined to 96B units, waning by -2.4% compared with 2022. The total consumption volume increased at an average annual rate of +1.3% over the period from 2013 to 2023; the trend pattern remained relatively stable, with only minor fluctuations being observed in certain years. As a result, consumption reached the peak volume of 99B units. From 2021 to 2023, the growth of the global consumption remained at a lower figure.
The global syringe market value expanded to $20.1B in 2023, picking up by 4.2% against the previous year. This figure reflects the total revenues of producers and importers (excluding logistics costs, retail marketing costs, and retailers' margins, which will be included in the final consumer price). The market value increased at an average annual rate of +3.2% from 2013 to 2023; the trend pattern indicated some noticeable fluctuations being recorded throughout the analyzed period. The pace of growth was the most pronounced in 2020 with an increase of 9.2% against the previous year. Global consumption peaked in 2023 and is likely to see steady growth in the immediate term.
Consumption By Country
China (19B units) constituted the country with the largest volume of syringe consumption, comprising approx. 19% of total volume. Moreover, syringe consumption in China exceeded the figures recorded by the second-largest consumer, the United States (7.4B units), threefold. The third position in this ranking was held by India (7.2B units), with a 7.5% share.
From 2013 to 2023, the average annual rate of growth in terms of volume in China was relatively modest. The remaining consuming countries recorded the following average annual rates of consumption growth: the United States (-2.8% per year) and India (+2.7% per year).
In value terms, Nigeria ($9.6B) led the market, alone. The second position in the ranking was held by the United States ($2B). It was followed by Germany.
From 2013 to 2023, the average annual rate of growth in terms of value in Nigeria stood at +3.4%. The remaining consuming countries recorded the following average annual rates of market growth: the United States (+4.8% per year) and Germany (+4.3% per year).
In 2023, the highest levels of syringe per capita consumption was registered in Switzerland (241 units per person), followed by the UK (64 units per person), Spain (56 units per person) and Germany (53 units per person), while the world average per capita consumption of syringe was estimated at 12 units per person.
In Switzerland, syringe per capita consumption expanded at an average annual rate of +28.2% over the period from 2013-2023. The remaining consuming countries recorded the following average annual rates of per capita consumption growth: the UK (+7.7% per year) and Spain (+6.4% per year).
Production
World Production of Syringes, With Or Without Needles
In 2023, the amount of syringes, with or without needles produced worldwide dropped modestly to 96B units, therefore, remained relatively stable against 2022 figures. The total output volume increased at an average annual rate of +1.4% over the period from 2013 to 2023; the trend pattern remained consistent, with only minor fluctuations being observed throughout the analyzed period. The pace of growth appeared the most rapid in 2020 when the production volume increased by 11%. As a result, production reached the peak volume of 99B units. From 2021 to 2023, global production growth failed to regain momentum.
In value terms, syringe production stood at $18.6B in 2023 estimated in export price. The total output value increased at an average annual rate of +3.3% from 2013 to 2023; the trend pattern indicated some noticeable fluctuations being recorded in certain years. The growth pace was the most rapid in 2014 when the production volume increased by 13%. Global production peaked in 2023 and is likely to continue growth in years to come.
Production By Country
The country with the largest volume of syringe production was China (34B units), comprising approx. 35% of total volume. Moreover, syringe production in China exceeded the figures recorded by the second-largest producer, the United States (8.8B units), fourfold. India (7.9B units) ranked third in terms of total production with an 8.2% share.
From 2013 to 2023, the average annual growth rate of volume in China stood at +2.3%. In the other countries, the average annual rates were as follows: the United States (-1.0% per year) and India (+3.0% per year).
Imports
World Imports of Syringes, With Or Without Needles
In 2023, supplies from abroad of syringes, with or without needles decreased by -19.5% to 46B units, falling for the second year in a row after nine years of growth. Over the period under review, imports, however, showed a relatively flat trend pattern. The growth pace was the most rapid in 2021 with an increase of 8.9%. As a result, imports attained the peak of 58B units. From 2022 to 2023, the growth of global imports remained at a somewhat lower figure.
In value terms, syringe imports amounted to $8B in 2023. In general, total imports indicated measured growth from 2013 to 2023: its value increased at an average annual rate of +4.8% over the last decade. The trend pattern, however, indicated some noticeable fluctuations being recorded throughout the analyzed period. Based on 2023 figures, imports increased by +73.4% against 2015 indices. The most prominent rate of growth was recorded in 2021 with an increase of 22%. Global imports peaked in 2023 and are likely to see steady growth in years to come.
Imports By Country
Switzerland (4.1B units), Belgium (3.2B units), the United States (3.2B units), the UK (2.8B units), France (2.6B units), Germany (2.5B units), Russia (1.9B units), Brazil (1.7B units), China (1.5B units) and Italy (1.4B units) represented roughly 54% of total imports in 2023. The following importers - Canada (849M units), Spain (803M units) and the Netherlands (703M units) - each amounted to a 5.1% share of total imports.
From 2013 to 2023, the biggest increases were recorded for Switzerland (with a CAGR of +12.9%), while purchases for the other global leaders experienced more modest paces of growth.
In value terms, the largest syringe importing markets worldwide were the United States ($1.1B), Germany ($961M) and France ($856M), with a combined 37% share of global imports. Belgium, the Netherlands, Italy, Switzerland, Spain, China, the UK, Canada, Russia and Brazil lagged somewhat behind, together comprising a further 35%.
Spain, with a CAGR of +11.2%, saw the highest growth rate of the value of imports, among the main importing countries over the period under review, while purchases for the other global leaders experienced more modest paces of growth.
Import Prices By Country
In 2023, the average syringe import price amounted to $0.2 per unit, rising by 29% against the previous year. Overall, import price indicated notable growth from 2013 to 2023: its price increased at an average annual rate of +4.3% over the last decade. The trend pattern, however, indicated some noticeable fluctuations being recorded throughout the analyzed period. Based on 2023 figures, syringe import price increased by +59.3% against 2018 indices. As a result, import price attained the peak level and is likely to continue growth in the immediate term.
There were significant differences in the average prices amongst the major importing countries. In 2023, amid the top importers, the country with the highest price was the Netherlands ($0.7 per unit), while Brazil (less than $0.1 per unit) was amongst the lowest.
From 2013 to 2023, the most notable rate of growth in terms of prices was attained by Spain (+15.1%), while the other global leaders experienced more modest paces of growth.
Exports
World Exports of Syringes, With Or Without Needles
In 2023, overseas shipments of syringes, with or without needles decreased by -17.1% to 46B units, falling for the second consecutive year after five years of growth. In general, exports, however, recorded a relatively flat trend pattern. The growth pace was the most rapid in 2021 with an increase of 9.2%. As a result, the exports reached the peak of 57B units. From 2022 to 2023, the growth of the global exports remained at a somewhat lower figure.
In value terms, syringe exports rose to $7.1B in 2023. Over the period under review, total exports indicated a moderate increase from 2013 to 2023: its value increased at an average annual rate of +4.9% over the last decade. The trend pattern, however, indicated some noticeable fluctuations being recorded throughout the analyzed period. Based on 2023 figures, exports increased by +61.2% against 2013 indices. The most prominent rate of growth was recorded in 2021 when exports increased by 19%. The global exports peaked in 2023 and are expected to retain growth in years to come.
Exports By Country
China was the main exporter of syringes, with or without needles in the world, with the volume of exports reaching 17B units, which was approx. 37% of total exports in 2023. The United States (4.7B units) held a 10% share (based on physical terms) of total exports, which put it in second place, followed by Germany (7.8%), Belgium (5.3%), Mexico (5.1%) and Switzerland (4.9%). India (1,328M units), France (1,142M units), Spain (1,011M units), Ireland (790M units), Indonesia (726M units) and the UK (700M units) held a minor share of total exports.
Exports from China increased at an average annual rate of +5.1% from 2013 to 2023. At the same time, Indonesia (+18.7%), Switzerland (+6.4%), India (+4.9%), Belgium (+3.3%), the United States (+2.1%) and the UK (+1.5%) displayed positive paces of growth. Moreover, Indonesia emerged as the fastest-growing exporter exported in the world, with a CAGR of +18.7% from 2013-2023. Mexico experienced a relatively flat trend pattern. By contrast, Ireland (-2.5%), France (-3.9%), Germany (-8.4%) and Spain (-10.5%) illustrated a downward trend over the same period. From 2013 to 2023, the share of China and Switzerland increased by +13 and +2.1 percentage points, respectively. The shares of the other countries remained relatively stable throughout the analyzed period.
In value terms, the largest syringe supplying countries worldwide were the United States ($1.1B), France ($965M) and China ($742M), together comprising 39% of global exports. Switzerland, Germany, Belgium, Mexico, Ireland, Spain, the UK, India and Indonesia lagged somewhat behind, together accounting for a further 33%.
Indonesia, with a CAGR of +18.3%, saw the highest growth rate of the value of exports, in terms of the main exporting countries over the period under review, while shipments for the other global leaders experienced more modest paces of growth.
Export Prices By Country
In 2023, the average syringe export price amounted to $0.2 per unit, increasing by 25% against the previous year. Over the last decade, it increased at an average annual rate of +4.3%. As a result, the export price attained the peak level and is likely to continue growth in the immediate term.
Prices varied noticeably by country of origin: amid the top suppliers, the country with the highest price was France ($0.8 per unit), while Indonesia (less than $0.1 per unit) was amongst the lowest.
From 2013 to 2023, the most notable rate of growth in terms of prices was attained by Germany (+14.6%), while the other global leaders experienced more modest paces of growth.
This report provides an in-depth analysis of the global syringe market. Within it, you will discover the latest data on market trends and opportunities by country, consumption, production and price developments, as well as the global trade (imports and exports). The forecast exhibits the market prospects through 2030.
Product coverage:
- Prodcom 32501311 - Syringes, with or without needles, used in medical, surgical, d ental or veterinary sciences
Country coverage:
Worldwide - the report contains statistical data for 200 countries and includes detailed profiles of the 50 largest consuming countries:
- USA
- China
- Japan
- Germany
- United Kingdom
- France
- Brazil
- Italy
- Russian Federation
- India
- Canada
- Australia
- Republic of Korea
- Spain
- Mexico
- Indonesia
- Netherlands
- Turkey
- Saudi Arabia
- Switzerland
- Sweden
- Nigeria
- Poland
- Belgium
- Argentina
- Norway
- Austria
- Thailand
- United Arab Emirates
- Colombia
- Denmark
- South Africa
- Malaysia
- Israel
- Singapore
- Egypt
- Philippines
- Finland
- Chile
- Ireland
- Pakistan
- Greece
- Portugal
- Kazakhstan
- Algeria
- Czech Republic
- Qatar
- Peru
- Romania
- Vietnam
+ the largest producing countries
Data coverage:
- Global market volume and value
- Per Capita consumption
- Forecast of the market dynamics in the medium term
- Global production, split by region and country
- Global trade (exports and imports)
- Export and import prices
- Market trends, drivers and restraints
- Key market players and their profiles
Company coverage:
Reasons to buy this report:
- Take advantage of the latest data
- Find deeper insights into current market developments
- Discover vital success factors affecting the market
This report is designed for manufacturers, distributors, importers, and wholesalers, as well as for investors, consultants and advisors.
In this report, you can find information that helps you to make informed decisions on the following issues:
- How to diversify your business and benefit from new market opportunities
- How to load your idle production capacity
- How to boost your sales on overseas markets
- How to increase your profit margins
- How to make your supply chain more sustainable
- How to reduce your production and supply chain costs
- How to outsource production to other countries
- How to prepare your business for global expansion
While doing this research, we combine the accumulated expertise of our analysts and the capabilities of artificial intelligence. The AI-based platform, developed by our data scientists, constitutes the key working tool for business analysts, empowering them to discover deep insights and ideas from the marketing data.
-
1. INTRODUCTION
Making Data-Driven Decisions to Grow Your Business
- REPORT DESCRIPTION
- RESEARCH METHODOLOGY AND AI PLATFORM
- DATA-DRIVEN DECISIONS FOR YOUR BUSINESS
- GLOSSARY AND SPECIFIC TERMS
-
2. EXECUTIVE SUMMARY
A Quick Overview of Market Performance
- KEY FINDINGS
- MARKET TRENDS This Chapter is Available Only for the Professional Edition PRO
-
3. MARKET OVERVIEW
Understanding the Current State of The Market and Its Prospects
- MARKET SIZE
- CONSUMPTION BY COUNTRY
- MARKET FORECAST TO 2030
-
4. MOST PROMISING PRODUCT
Finding New Products to Diversify Your Business
This Chapter is Available Only for the Professional Edition PRO- TOP PRODUCTS TO DIVERSIFY YOUR BUSINESS
- BEST-SELLING PRODUCTS
- MOST CONSUMED PRODUCT
- MOST TRADED PRODUCT
- MOST PROFITABLE PRODUCT FOR EXPORT
-
5. MOST PROMISING SUPPLYING COUNTRIES
Choosing the Best Countries to Establish Your Sustainable Supply Chain
This Chapter is Available Only for the Professional Edition PRO- TOP COUNTRIES TO SOURCE YOUR PRODUCT
- TOP PRODUCING COUNTRIES
- TOP EXPORTING COUNTRIES
- LOW-COST EXPORTING COUNTRIES
-
6. MOST PROMISING OVERSEAS MARKETS
Choosing the Best Countries to Boost Your Exports
This Chapter is Available Only for the Professional Edition PRO- TOP OVERSEAS MARKETS FOR EXPORTING YOUR PRODUCT
- TOP CONSUMING MARKETS
- UNSATURATED MARKETS
- TOP IMPORTING MARKETS
- MOST PROFITABLE MARKETS
7. GLOBAL PRODUCTION
The Latest Trends and Insights into The Industry
- PRODUCTION VOLUME AND VALUE
- PRODUCTION BY COUNTRY
8. GLOBAL IMPORTS
The Largest Importers on The Market and How They Succeed
- IMPORTS FROM 2012–2023
- IMPORTS BY COUNTRY
- IMPORT PRICES BY COUNTRY
9. GLOBAL EXPORTS
The Largest Exporters on The Market and How They Succeed
- EXPORTS FROM 2012–2023
- EXPORTS BY COUNTRY
- EXPORT PRICES BY COUNTRY
-
10. PROFILES OF MAJOR PRODUCERS
The Largest Producers on The Market and Their Profiles
This Chapter is Available Only for the Professional Edition PRO -
11. COUNTRY PROFILES
The Largest Markets And Their Profiles
This Chapter is Available Only for the Professional Edition PRO- United States
- China
- Japan
- Germany
- United Kingdom
- France
- Brazil
- Italy
- Russian Federation
- India
- Canada
- Australia
- Republic of Korea
- Spain
- Mexico
- Indonesia
- Netherlands
- Turkey
- Saudi Arabia
- Switzerland
- Sweden
- Nigeria
- Poland
- Belgium
- Argentina
- Norway
- Austria
- Thailand
- United Arab Emirates
- Colombia
- Denmark
- South Africa
- Malaysia
- Israel
- Singapore
- Egypt
- Philippines
- Finland
- Chile
- Ireland
- Pakistan
- Greece
- Portugal
- Kazakhstan
- Algeria
- Czech Republic
- Qatar
- Peru
- Romania
- Vietnam
-
LIST OF TABLES
- Key Findings In 2023
- Market Volume, In Physical Terms, 2012–2023
- Market Value, 2012–2023
- Per Capita Consumption, By Country, 2018–2023
- Production, In Physical Terms, By Country, 2012–2023
- Imports, In Physical Terms, By Country, 2012–2023
- Imports, In Value Terms, By Country, 2012–2023
- Import Prices, By Country Of Destination, 2012–2023
- Exports, In Physical Terms, By Country, 2012–2023
- Exports, In Value Terms, By Country, 2012–2023
- Export Prices, By Country Of Origin, 2012–2023
-
LIST OF FIGURES
- Market Volume, In Physical Terms, 2012–2023
- Market Value, 2012–2023
- Consumption, By Country, 2023
- Market Volume Forecast to 2030
- Market Value Forecast to 2030
- Products: Market Size And Growth, By Type
- Products: Average Per Capita Consumption, By Type
- Products: Exports And Growth, By Type
- Products: Export Prices And Growth, By Type
- Production Volume And Growth
- Exports And Growth
- Export Prices And Growth
- Market Size And Growth
- Per Capita Consumption
- Imports And Growth
- Import Prices
- Production, In Physical Terms, 2012–2023
- Production, In Value Terms, 2012–2023
- Production, By Country, 2023
- Production, In Physical Terms, By Country, 2012–2023
- Imports, In Physical Terms, 2012–2023
- Imports, In Value Terms, 2012–2023
- Imports, In Physical Terms, By Country, 2023
- Imports, In Physical Terms, By Country, 2012–2023
- Imports, In Value Terms, By Country, 2012–2023
- Import Prices, By Country, 2012–2023
- Exports, In Physical Terms, 2012–2023
- Exports, In Value Terms, 2012–2023
- Exports, In Physical Terms, By Country, 2023
- Exports, In Physical Terms, By Country, 2012–2023
- Exports, In Value Terms, By Country, 2012–2023
- Export Prices, 2012–2023


