
Turkey - Narrow Woven Fabrics - Market Analysis, Forecast, Size, Trends and Insights
Get instant access to more than 2 million reports, dashboards, and datasets on the IndexBox Platform.
View PricingTurkey Sees Significant Drop in Narrow Woven Fabric Imports, Falling to $98M in 2023
Turkey Narrow Woven Fabric Imports
In 2023, supplies from abroad of narrow woven fabrics decreased by -9.3% to 9.7K tons for the first time since 2020, thus ending a two-year rising trend. The total import volume increased at an average annual rate of +1.7% from 2013 to 2023; the trend pattern remained consistent, with somewhat noticeable fluctuations being observed throughout the analyzed period. The pace of growth was the most pronounced in 2022 with an increase of 18%. As a result, imports reached the peak of 11K tons, and then dropped in the following year.
In value terms, narrow woven fabric imports contracted to $98M (IndexBox estimates) in 2023. In general, imports, however, recorded a mild increase. The most prominent rate of growth was recorded in 2022 when imports increased by 23% against the previous year. As a result, imports reached the peak of $114M, and then reduced in the following year.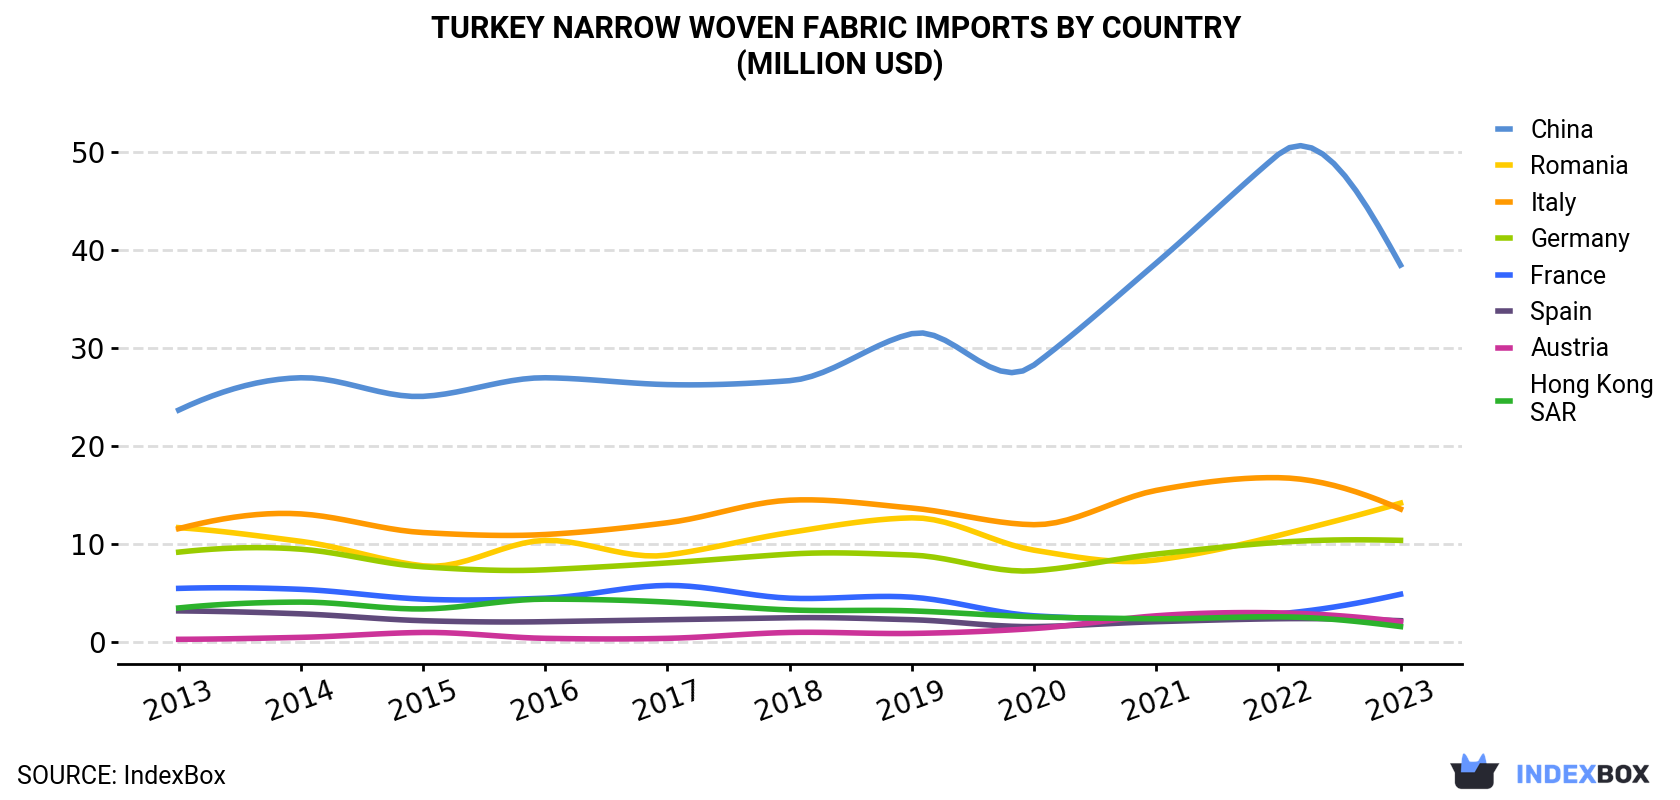
| COUNTRY | Import Value of Narrow Woven Fabric in Turkey (million USD) | ||||||||||
|---|---|---|---|---|---|---|---|---|---|---|---|
| 2013 | 2014 | 2015 | 2016 | 2017 | 2018 | 2019 | 2020 | 2021 | 2022 | 2023 | |
| China | 23.7 | 27.0 | 25.1 | 27.0 | 26.3 | 26.7 | 31.5 | 28.3 | 38.7 | 49.8 | 38.5 |
| Romania | 11.7 | 10.3 | 7.8 | 10.4 | 8.9 | 11.2 | 12.7 | 9.4 | 8.4 | 10.9 | 14.2 |
| Italy | 11.6 | 13.1 | 11.2 | 11.0 | 12.2 | 14.5 | 13.7 | 12.0 | 15.5 | 16.8 | 13.6 |
| Germany | 9.2 | 9.5 | 7.7 | 7.4 | 8.1 | 9.0 | 8.9 | 7.3 | 9.0 | 10.2 | 10.4 |
| France | 5.5 | 5.4 | 4.4 | 4.5 | 5.8 | 4.5 | 4.6 | 2.7 | 2.4 | 2.9 | 4.9 |
| Spain | 3.2 | 2.9 | 2.2 | 2.1 | 2.3 | 2.5 | 2.3 | 1.6 | 2.1 | 2.4 | 2.2 |
| Austria | 0.3 | 0.5 | 1.0 | 0.4 | 0.4 | 1.0 | 0.9 | 1.4 | 2.7 | 3.0 | 2.1 |
| Hong Kong | 3.5 | 4.1 | 3.4 | 4.4 | 4.1 | 3.3 | 3.2 | 2.6 | 2.4 | 2.6 | 1.6 |
| Others | 20.9 | 21.9 | 20.6 | 17.1 | 22.0 | 16.4 | 12.9 | 11.4 | 11.5 | 15.2 | 11.1 |
| Total | 89.6 | 94.8 | 83.5 | 84.3 | 90.0 | 89.0 | 90.8 | 76.6 | 92.7 | 114 | 98.5 |
Imports by Country
China (4.4K tons), Romania (3.1K tons) and Germany (601 tons) were the main suppliers of narrow woven fabric imports to Turkey, with a combined 84% share of total imports. Italy, Austria, France, Spain and Hong Kong lagged somewhat behind, together comprising a further 9.3%.
From 2013 to 2023, the most notable rate of growth in terms of purchases, amongst the main suppliers, was attained by Austria (with a CAGR of +21.9%), while imports for the other leaders experienced more modest paces of growth.
In value terms, China ($38M) constituted the largest supplier of narrow woven fabrics to Turkey, comprising 39% of total imports. The second position in the ranking was taken by Romania ($14M), with a 14% share of total imports. It was followed by Italy, with a 14% share.
From 2013 to 2023, the average annual rate of growth in terms of value from China amounted to +5.0%. The remaining supplying countries recorded the following average annual rates of imports growth: Romania (+1.9% per year) and Italy (+1.6% per year).
Imports by Type
In 2023, fabrics; narrow woven, other than goods of heading no. 5807; narrow fabrics consisting of warp without weft assembled by means of an adhesive (bolducs) (8.8K tons) was the main type of narrow woven fabrics supplied to Turkey, with a 91% share of total imports. Moreover, fabrics; narrow woven, other than goods of heading no. 5807; narrow fabrics consisting of warp without weft assembled by means of an adhesive (bolducs) exceeded the figures recorded for the second-largest type, braids in the piece; ornamental trimmings in the piece, without embroidery, other than knitted or crocheted; tassels, pompons and similar articles (686 tons), more than tenfold.
From 2013 to 2023, the average annual growth rate of the volume of fabrics; narrow woven, other than goods of heading no. 5807; narrow fabrics consisting of warp without weft assembled by means of an adhesive (bolducs) imports totaled +3.3%. With regard to the other supplied products, the following average annual rates of growth were recorded: braids in the piece; ornamental trimmings in the piece, without embroidery, other than knitted or crocheted; tassels, pompons and similar articles (-7.3% per year) and labels, badges and similar articles; of textile materials, in the piece, in strips or cut to shape or size, not embroidered (-3.4% per year).
In value terms, fabrics; narrow woven, other than goods of heading no. 5807; narrow fabrics consisting of warp without weft assembled by means of an adhesive (bolducs) ($70M) constituted the largest type of narrow woven fabrics supplied to Turkey, comprising 71% of total imports. The second position in the ranking was held by labels, badges and similar articles; of textile materials, in the piece, in strips or cut to shape or size, not embroidered ($21M), with a 21% share of total imports.
Import Prices by Country
In 2023, the narrow woven fabric price amounted to $10,181 per ton (CIF, Turkey), reducing by -4.5% against the previous year. In general, the import price recorded a relatively flat trend pattern. The most prominent rate of growth was recorded in 2019 when the average import price increased by 13% against the previous year. The import price peaked at $11,200 per ton in 2014; however, from 2015 to 2023, import prices failed to regain momentum.
There were significant differences in the average prices amongst the major supplying countries. In 2023, amid the top importers, the country with the highest price was Italy ($24,298 per ton), while the price for North Macedonia ($3,072 per ton) was amongst the lowest.
From 2013 to 2023, the most notable rate of growth in terms of prices was attained by India (+8.1%), while the prices for the other major suppliers experienced more modest paces of growth.
This report provides an in-depth analysis of the narrow woven fabric market in Turkey. Within it, you will discover the latest data on market trends and opportunities by country, consumption, production and price developments, as well as the global trade (imports and exports). The forecast exhibits the market prospects through 2030.
Product coverage:
- Prodcom 13961730 - Narrow woven fabrics other than labels, badges and other similar articles
- Prodcom 13961750 - Labels, badges and similar articles in textile materials (excluding embroidered)
- Prodcom 13961770 - Braids in the piece, tassels and pompons, ornamental trimmings (excluding knitted or crocheted)
Country coverage:
- Turkey
Data coverage:
- Market volume and value
- Per Capita consumption
- Forecast of the market dynamics in the medium term
- Trade (exports and imports) in Turkey
- Export and import prices
- Market trends, drivers and restraints
- Key market players and their profiles
Reasons to buy this report:
- Take advantage of the latest data
- Find deeper insights into current market developments
- Discover vital success factors affecting the market
This report is designed for manufacturers, distributors, importers, and wholesalers, as well as for investors, consultants and advisors.
In this report, you can find information that helps you to make informed decisions on the following issues:
- How to diversify your business and benefit from new market opportunities
- How to load your idle production capacity
- How to boost your sales on overseas markets
- How to increase your profit margins
- How to make your supply chain more sustainable
- How to reduce your production and supply chain costs
- How to outsource production to other countries
- How to prepare your business for global expansion
While doing this research, we combine the accumulated expertise of our analysts and the capabilities of artificial intelligence. The AI-based platform, developed by our data scientists, constitutes the key working tool for business analysts, empowering them to discover deep insights and ideas from the marketing data.
-
1. INTRODUCTION
Making Data-Driven Decisions to Grow Your Business
- REPORT DESCRIPTION
- RESEARCH METHODOLOGY AND AI PLATFORM
- DATA-DRIVEN DECISIONS FOR YOUR BUSINESS
- GLOSSARY AND SPECIFIC TERMS
-
2. EXECUTIVE SUMMARY
A Quick Overview of Market Performance
- KEY FINDINGS
- MARKET TRENDS This Chapter is Available Only for the Professional Edition PRO
-
3. MARKET OVERVIEW
Understanding the Current State of The Market and Its Prospects
- MARKET SIZE
- MARKET STRUCTURE
- TRADE BALANCE
- PER CAPITA CONSUMPTION
- MARKET FORECAST TO 2030
-
4. MOST PROMISING PRODUCT
Finding New Products to Diversify Your Business
This Chapter is Available Only for the Professional Edition PRO- TOP PRODUCTS TO DIVERSIFY YOUR BUSINESS
- BEST-SELLING PRODUCTS
- MOST CONSUMED PRODUCT
- MOST TRADED PRODUCT
- MOST PROFITABLE PRODUCT FOR EXPORT
-
5. MOST PROMISING SUPPLYING COUNTRIES
Choosing the Best Countries to Establish Your Sustainable Supply Chain
This Chapter is Available Only for the Professional Edition PRO- TOP COUNTRIES TO SOURCE YOUR PRODUCT
- TOP PRODUCING COUNTRIES
- TOP EXPORTING COUNTRIES
- LOW-COST EXPORTING COUNTRIES
-
6. MOST PROMISING OVERSEAS MARKETS
Choosing the Best Countries to Boost Your Exports
This Chapter is Available Only for the Professional Edition PRO- TOP OVERSEAS MARKETS FOR EXPORTING YOUR PRODUCT
- TOP CONSUMING MARKETS
- UNSATURATED MARKETS
- TOP IMPORTING MARKETS
- MOST PROFITABLE MARKETS
7. PRODUCTION
The Latest Trends and Insights into The Industry
- PRODUCTION VOLUME AND VALUE
8. IMPORTS
The Largest Import Supplying Countries
- IMPORTS FROM 2012–2023
- IMPORTS BY COUNTRY
- IMPORT PRICES BY COUNTRY
9. EXPORTS
The Largest Destinations for Exports
- EXPORTS FROM 2012–2023
- EXPORTS BY COUNTRY
- EXPORT PRICES BY COUNTRY
-
10. PROFILES OF MAJOR PRODUCERS
The Largest Producers on The Market and Their Profiles
This Chapter is Available Only for the Professional Edition PRO -
LIST OF TABLES
- Key Findings In 2023
- Market Volume, In Physical Terms, 2012–2023
- Market Value, 2012–2023
- Per Capita Consumption In 2012-2023
- Imports, In Physical Terms, By Country, 2012–2023
- Imports, In Value Terms, By Country, 2012–2023
- Import Prices, By Country Of Origin, 2012–2023
- Exports, In Physical Terms, By Country, 2012–2023
- Exports, In Value Terms, By Country, 2012–2023
- Export Prices, By Country Of Destination, 2012–2023
-
LIST OF FIGURES
- Market Volume, In Physical Terms, 2012–2023
- Market Value, 2012–2023
- Market Structure – Domestic Supply vs. Imports, In Physical Terms, 2012-2023
- Market Structure – Domestic Supply vs. Imports, In Value Terms, 2012-2023
- Trade Balance, In Physical Terms, 2012-2023
- Trade Balance, In Value Terms, 2012-2023
- Per Capita Consumption, 2012-2023
- Market Volume Forecast to 2030
- Market Value Forecast to 2030
- Products: Market Size And Growth, By Type
- Products: Average Per Capita Consumption, By Type
- Products: Exports And Growth, By Type
- Products: Export Prices And Growth, By Type
- Production Volume And Growth
- Exports And Growth
- Export Prices And Growth
- Market Size And Growth
- Per Capita Consumption
- Imports And Growth
- Import Prices
- Production, In Physical Terms, 2012–2023
- Production, In Value Terms, 2012–2023
- Imports, In Physical Terms, 2012–2023
- Imports, In Value Terms, 2012–2023
- Imports, In Physical Terms, By Country, 2023
- Imports, In Physical Terms, By Country, 2012–2023
- Imports, In Value Terms, By Country, 2012–2023
- Import Prices, By Country Of Origin, 2012–2023
- Exports, In Physical Terms, 2012–2023
- Exports, In Value Terms, 2012–2023
- Exports, In Physical Terms, By Country, 2023
- Exports, In Physical Terms, By Country, 2012–2023
- Exports, In Value Terms, By Country, 2012–2023
- Export Prices, By Country Of Destination, 2012–2023


