
United Kingdom - Knives, Scissors And Blades - Market Analysis, Forecast, Size, Trends and Insights
Get instant access to more than 2 million reports, dashboards, and datasets on the IndexBox Platform.
View PricingImport of Knives and Scissors in UK Decreases to $110M in 2023
United Kingdom Knife And Scissors Imports
In 2023, overseas purchases of knives, scissors and blades decreased by -7.1% to 39M units, falling for the second year in a row after two years of growth. Overall, imports showed a relatively flat trend pattern. The pace of growth was the most pronounced in 2014 when imports increased by 28% against the previous year. As a result, imports attained the peak of 55M units. From 2015 to 2023, the growth of imports failed to regain momentum.
In value terms, knife and scissors imports reduced to $110M (IndexBox estimates) in 2023. The total import value increased at an average annual rate of +1.0% from 2013 to 2023; however, the trend pattern remained relatively stable, with only minor fluctuations being observed in certain years. The growth pace was the most rapid in 2014 with an increase of 22%. As a result, imports attained the peak of $122M. From 2015 to 2023, the growth of imports remained at a somewhat lower figure.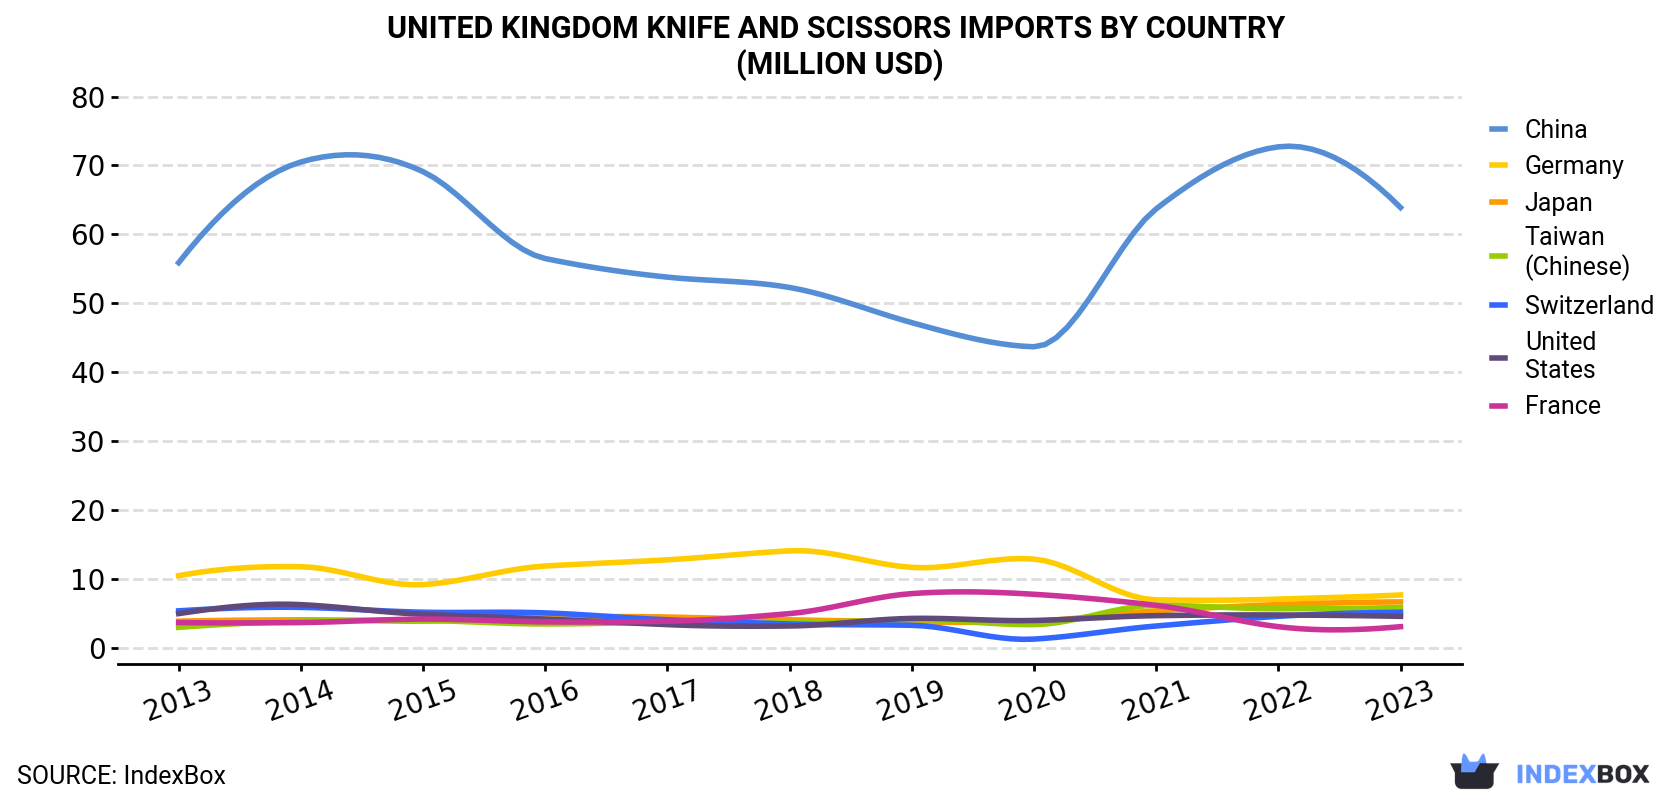
| COUNTRY | Import Value of Knife And Scissors in United Kingdom (million USD) | ||||||||||
|---|---|---|---|---|---|---|---|---|---|---|---|
| 2013 | 2014 | 2015 | 2016 | 2017 | 2018 | 2019 | 2020 | 2021 | 2022 | 2023 | |
| China | 55.9 | 70.5 | 69.1 | 56.5 | 53.8 | 52.3 | 47.2 | 43.7 | 63.7 | 72.7 | 63.9 |
| Germany | 10.5 | 11.8 | 9.2 | 11.9 | 12.8 | 14.1 | 11.7 | 12.9 | 7.0 | 7.1 | 7.7 |
| Japan | 3.9 | 4.1 | 3.9 | 4.5 | 4.5 | 4.1 | 3.8 | 3.9 | 5.4 | 6.3 | 6.7 |
| Taiwan (Chinese) | 3.0 | 3.9 | 4.0 | 3.5 | 3.7 | 3.7 | 4.1 | 3.4 | 6.2 | 5.7 | 5.9 |
| Switzerland | 5.4 | 5.9 | 5.2 | 5.1 | 4.1 | 3.5 | 3.3 | 1.3 | 3.2 | 4.6 | 5.2 |
| United States | 5.0 | 6.3 | 4.9 | 4.2 | 3.4 | 3.2 | 4.3 | 4.0 | 4.7 | 4.8 | 4.6 |
| France | 3.7 | 3.7 | 4.2 | 3.8 | 3.9 | 5.0 | 7.9 | 7.8 | 6.2 | 3.1 | 3.1 |
| Others | 12.4 | 15.7 | 16.9 | 14.2 | 18.8 | 21.6 | 18.6 | 23.9 | 20.6 | 15.5 | 13.2 |
| Total | 99.7 | 122 | 117 | 104 | 105 | 108 | 101 | 101 | 117 | 120 | 110 |
Imports by Country
In 2023, China (30M units) constituted the largest supplier of knife and scissors to the UK, with a 76% share of total imports. Moreover, knife and scissors imports from China exceeded the figures recorded by the second-largest supplier, Taiwan (Chinese) (1.4M units), more than tenfold. the United States (718K units) ranked third in terms of total imports with a 1.8% share.
From 2013 to 2023, the average annual growth rate of volume from China was relatively modest. The remaining supplying countries recorded the following average annual rates of imports growth: Taiwan (Chinese) (+6.4% per year) and the United States (-9.6% per year).
In value terms, China ($64M) constituted the largest supplier of knives, scissors and blades to the UK, comprising 58% of total imports. The second position in the ranking was held by Germany ($7.7M), with a 7% share of total imports. It was followed by Japan, with a 6.1% share.
From 2013 to 2023, the average annual growth rate of value from China stood at +1.3%. The remaining supplying countries recorded the following average annual rates of imports growth: Germany (-3.1% per year) and Japan (+5.6% per year).
Imports by Type
Scissors and tailor shears (15M units), knives having fixed cutting blades (8M units) and table knives (5.2M units) were the main products of knife and scissors imports to the UK, with a combined 71% share of total imports. Knives; with handles of base metal, clasp knives, knives with cutting blades, serrated or not (including pruning knives) and blades; cutting, serrated or not, excluding those of heading no. 8208 lagged somewhat behind, together accounting for a further 29%.
From 2013 to 2023, the most notable rate of growth in terms of purchases, amongst the major product types, was attained by knives; with handles of base metal (with a CAGR of +7.0%), while imports for the other products experienced a decline.
In value terms, knives having fixed cutting blades ($29M), scissors and tailor shears ($22M) and knives with cutting blades, serrated or not (including pruning knives) ($21M) were the most imported types of knives, scissors and blades in the UK, together comprising 66% of total imports. Clasp knives, table knives, knives; with handles of base metal and blades; cutting, serrated or not, excluding those of heading no. 8208 lagged somewhat behind, together accounting for a further 34%.
Import Prices by Country
In 2023, the knife and scissors price stood at $2.8 per unit (CIF, United Kingdom), remaining relatively unchanged against the previous year. Over the last decade, it increased at an average annual rate of +2.0%. The pace of growth appeared the most rapid in 2017 an increase of 13%. The import price peaked at $2.8 per unit in 2022, and then contracted modestly in the following year.
Prices varied noticeably by country of origin: amid the top importers, the country with the highest price was France ($12 per unit), while the price for Turkey ($0.9 per unit) was amongst the lowest.
From 2013 to 2023, the most notable rate of growth in terms of prices was attained by France (+16.5%), while the prices for the other major suppliers experienced more modest paces of growth.
This report provides an in-depth analysis of the knife and scissors market in the UK. Within it, you will discover the latest data on market trends and opportunities by country, consumption, production and price developments, as well as the global trade (imports and exports). The forecast exhibits the market prospects through 2030.
Product coverage:
- Prodcom 25711115 -
- Prodcom 25711130 -
- Prodcom 25711145 - Knives with fixed blades of base metal including pruning knives (excluding fish, butter/ table knives with fixed blades, k nives and cutting blades for machines/mechanical appliances)
- Prodcom 25711160 - Clasp knives
- Prodcom 25711175 - Blades and handles of base metal for table knives, pocket knives, including pruning knives (excluding fish and butter knives, knives/cutting blades for machines or mechanical appliances)
- Prodcom 25711190 - Scissors, tailors
Country coverage:
- United Kingdom
Data coverage:
- Market volume and value
- Per Capita consumption
- Forecast of the market dynamics in the medium term
- Trade (exports and imports) in the UK
- Export and import prices
- Market trends, drivers and restraints
- Key market players and their profiles
Reasons to buy this report:
- Take advantage of the latest data
- Find deeper insights into current market developments
- Discover vital success factors affecting the market
This report is designed for manufacturers, distributors, importers, and wholesalers, as well as for investors, consultants and advisors.
In this report, you can find information that helps you to make informed decisions on the following issues:
- How to diversify your business and benefit from new market opportunities
- How to load your idle production capacity
- How to boost your sales on overseas markets
- How to increase your profit margins
- How to make your supply chain more sustainable
- How to reduce your production and supply chain costs
- How to outsource production to other countries
- How to prepare your business for global expansion
While doing this research, we combine the accumulated expertise of our analysts and the capabilities of artificial intelligence. The AI-based platform, developed by our data scientists, constitutes the key working tool for business analysts, empowering them to discover deep insights and ideas from the marketing data.
-
1. INTRODUCTION
Making Data-Driven Decisions to Grow Your Business
- REPORT DESCRIPTION
- RESEARCH METHODOLOGY AND AI PLATFORM
- DATA-DRIVEN DECISIONS FOR YOUR BUSINESS
- GLOSSARY AND SPECIFIC TERMS
-
2. EXECUTIVE SUMMARY
A Quick Overview of Market Performance
- KEY FINDINGS
- MARKET TRENDS This Chapter is Available Only for the Professional Edition PRO
-
3. MARKET OVERVIEW
Understanding the Current State of The Market and Its Prospects
- MARKET SIZE
- MARKET STRUCTURE
- TRADE BALANCE
- PER CAPITA CONSUMPTION
- MARKET FORECAST TO 2030
-
4. MOST PROMISING PRODUCT
Finding New Products to Diversify Your Business
This Chapter is Available Only for the Professional Edition PRO- TOP PRODUCTS TO DIVERSIFY YOUR BUSINESS
- BEST-SELLING PRODUCTS
- MOST CONSUMED PRODUCT
- MOST TRADED PRODUCT
- MOST PROFITABLE PRODUCT FOR EXPORT
-
5. MOST PROMISING SUPPLYING COUNTRIES
Choosing the Best Countries to Establish Your Sustainable Supply Chain
This Chapter is Available Only for the Professional Edition PRO- TOP COUNTRIES TO SOURCE YOUR PRODUCT
- TOP PRODUCING COUNTRIES
- TOP EXPORTING COUNTRIES
- LOW-COST EXPORTING COUNTRIES
-
6. MOST PROMISING OVERSEAS MARKETS
Choosing the Best Countries to Boost Your Exports
This Chapter is Available Only for the Professional Edition PRO- TOP OVERSEAS MARKETS FOR EXPORTING YOUR PRODUCT
- TOP CONSUMING MARKETS
- UNSATURATED MARKETS
- TOP IMPORTING MARKETS
- MOST PROFITABLE MARKETS
7. PRODUCTION
The Latest Trends and Insights into The Industry
- PRODUCTION VOLUME AND VALUE
8. IMPORTS
The Largest Import Supplying Countries
- IMPORTS FROM 2012–2023
- IMPORTS BY COUNTRY
- IMPORT PRICES BY COUNTRY
9. EXPORTS
The Largest Destinations for Exports
- EXPORTS FROM 2012–2023
- EXPORTS BY COUNTRY
- EXPORT PRICES BY COUNTRY
-
10. PROFILES OF MAJOR PRODUCERS
The Largest Producers on The Market and Their Profiles
This Chapter is Available Only for the Professional Edition PRO -
LIST OF TABLES
- Key Findings In 2023
- Market Volume, In Physical Terms, 2012–2023
- Market Value, 2012–2023
- Per Capita Consumption In 2012-2023
- Imports, In Physical Terms, By Country, 2012–2023
- Imports, In Value Terms, By Country, 2012–2023
- Import Prices, By Country Of Origin, 2012–2023
- Exports, In Physical Terms, By Country, 2012–2023
- Exports, In Value Terms, By Country, 2012–2023
- Export Prices, By Country Of Destination, 2012–2023
-
LIST OF FIGURES
- Market Volume, In Physical Terms, 2012–2023
- Market Value, 2012–2023
- Market Structure – Domestic Supply vs. Imports, In Physical Terms, 2012-2023
- Market Structure – Domestic Supply vs. Imports, In Value Terms, 2012-2023
- Trade Balance, In Physical Terms, 2012-2023
- Trade Balance, In Value Terms, 2012-2023
- Per Capita Consumption, 2012-2023
- Market Volume Forecast to 2030
- Market Value Forecast to 2030
- Products: Market Size And Growth, By Type
- Products: Average Per Capita Consumption, By Type
- Products: Exports And Growth, By Type
- Products: Export Prices And Growth, By Type
- Production Volume And Growth
- Exports And Growth
- Export Prices And Growth
- Market Size And Growth
- Per Capita Consumption
- Imports And Growth
- Import Prices
- Production, In Physical Terms, 2012–2023
- Production, In Value Terms, 2012–2023
- Imports, In Physical Terms, 2012–2023
- Imports, In Value Terms, 2012–2023
- Imports, In Physical Terms, By Country, 2023
- Imports, In Physical Terms, By Country, 2012–2023
- Imports, In Value Terms, By Country, 2012–2023
- Import Prices, By Country Of Origin, 2012–2023
- Exports, In Physical Terms, 2012–2023
- Exports, In Value Terms, 2012–2023
- Exports, In Physical Terms, By Country, 2023
- Exports, In Physical Terms, By Country, 2012–2023
- Exports, In Value Terms, By Country, 2012–2023
- Export Prices, By Country Of Destination, 2012–2023


