
United Kingdom - Sheet Piling Of Steel - Market Analysis, Forecast, Size, Trends And Insights
Get instant access to more than 2 million reports, dashboards, and datasets on the IndexBox Platform.
View PricingUK Imports of Steel Sheet Piling Plunge to $167 Million in 2023
United Kingdom Steel Sheet Piling Imports
In 2023, the amount of sheet piling of steel imported into the UK reduced rapidly to 56K tons, dropping by -32.1% on the previous year's figure. Overall, imports saw a deep slump. The pace of growth appeared the most rapid in 2019 with an increase of 95%. Imports peaked at 199K tons in 2014; however, from 2015 to 2023, imports failed to regain momentum.
In value terms, steel sheet piling imports dropped sharply to $167M (IndexBox estimates) in 2023. In general, total imports indicated a modest increase from 2013 to 2023: its value increased at an average annual rate of +1.2% over the last decade. The trend pattern, however, indicated some noticeable fluctuations being recorded throughout the analyzed period. Based on 2023 figures, imports increased by +20.9% against 2019 indices. The growth pace was the most rapid in 2014 when imports increased by 65%. As a result, imports attained the peak of $246M. From 2015 to 2023, the growth of imports failed to regain momentum.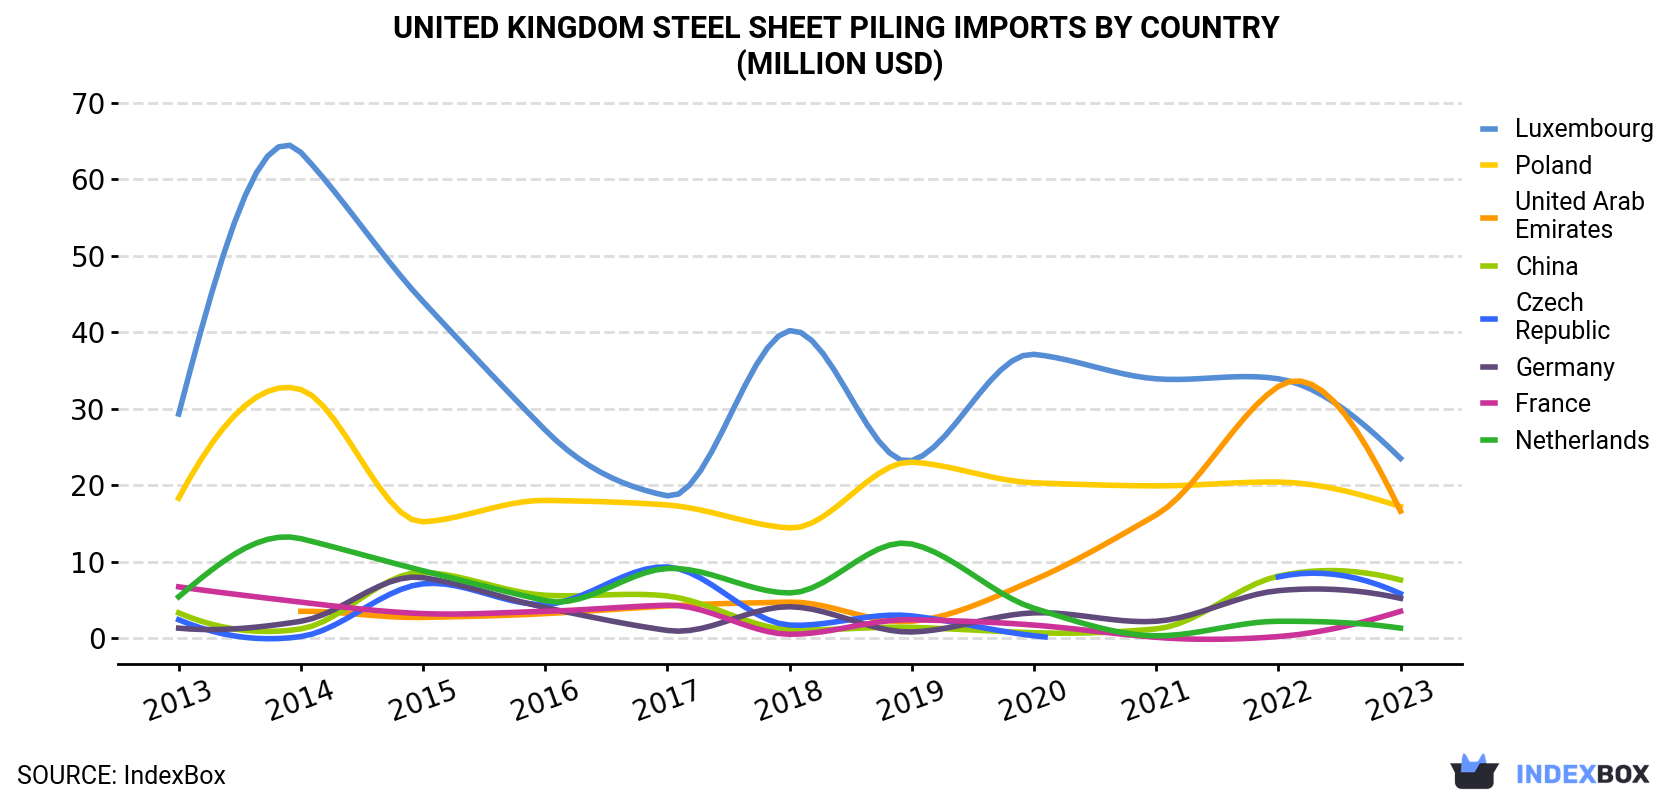
| COUNTRY | Import Value of Steel Sheet Piling in United Kingdom (million USD) | ||||||||||
|---|---|---|---|---|---|---|---|---|---|---|---|
| 2013 | 2014 | 2015 | 2016 | 2017 | 2018 | 2019 | 2020 | 2021 | 2022 | 2023 | |
| Luxembourg | 29.3 | 63.5 | 44.0 | 27.2 | 18.6 | 40.2 | 23.2 | 37.1 | 33.9 | 33.9 | 23.5 |
| Poland | 18.3 | 32.5 | 15.2 | 18.0 | 17.4 | 14.4 | 23.0 | 20.3 | 19.9 | 20.4 | 17.2 |
| United Arab Emirates | N/A | 3.5 | 2.7 | 3.2 | 4.2 | 4.7 | 2.2 | 7.6 | 16.1 | 32.9 | 16.6 |
| China | 3.3 | 1.2 | 8.6 | 5.6 | 5.5 | 1.1 | 1.4 | 0.7 | 1.2 | 8.1 | 7.6 |
| Czech Republic | 2.4 | 0.2 | 7.1 | 4.4 | 9.3 | 1.7 | 2.9 | 0.3 | N/A | 8.0 | 5.8 |
| Germany | 1.3 | 2.2 | 7.9 | 4.0 | 1.0 | 4.1 | 0.8 | 3.3 | 2.2 | 6.2 | 5.2 |
| France | 6.7 | 4.7 | 3.2 | 3.5 | 4.3 | 0.5 | 2.4 | 1.7 | 0.1 | 0.2 | 3.5 |
| Netherlands | 5.4 | 13.0 | 8.8 | 4.9 | 9.1 | 5.9 | 12.3 | 3.9 | 0.3 | 2.2 | 1.3 |
| Others | 82.0 | 125 | 100 | 75.7 | 71.5 | 75.1 | 70.2 | 78.5 | 78.0 | 124 | 86.6 |
| Total | 149 | 246 | 198 | 146 | 141 | 148 | 138 | 153 | 152 | 236 | 167 |
Imports by Country
Luxembourg (15K tons), the United Arab Emirates (13K tons) and Poland (12K tons) were the main suppliers of steel sheet piling imports to the UK, together accounting for 73% of total imports. China, Germany, the Czech Republic, France and the Netherlands lagged somewhat behind, together comprising a further 26%.
From 2013 to 2023, the most notable rate of growth in terms of purchases, amongst the main suppliers, was attained by Germany (with a CAGR of +18.3%), while imports for the other leaders experienced more modest paces of growth.
In value terms, the largest steel sheet piling suppliers to the UK were Luxembourg ($24M), Poland ($17M) and the United Arab Emirates ($17M), together accounting for 34% of total imports.
In terms of the main suppliers, the United Arab Emirates, with a CAGR of +18.9%, recorded the highest rates of growth with regard to the value of imports, over the period under review, while purchases for the other leaders experienced more modest paces of growth.
Import Prices by Country
In 2023, the steel sheet piling price stood at $2,995 per ton (CIF, United Kingdom), surging by 4.4% against the previous year. In general, the import price posted a buoyant increase. The pace of growth appeared the most rapid in 2020 when the average import price increased by 103% against the previous year. The import price peaked in 2023 and is likely to continue growth in the near future.
Average prices varied somewhat amongst the major supplying countries. In 2023, amid the top importers, the highest price was recorded for prices from France ($1,848 per ton) and China ($1,834 per ton), while the price for the United Arab Emirates ($1,256 per ton) and Germany ($1,387 per ton) were amongst the lowest.
From 2013 to 2023, the most notable rate of growth in terms of prices was attained by France (+4.7%), while the prices for the other major suppliers experienced more modest paces of growth.
This report provides an in-depth analysis of the steel sheet piling market in the UK. Within it, you will discover the latest data on market trends and opportunities by country, consumption, production and price developments, as well as the global trade (imports and exports). The forecast exhibits the market prospects through 2030.
Product coverage:
- Prodcom 24107410 - Sheet piling (of steel)
- Prodcom 2410T251 - Sheet piling
Country coverage:
- United Kingdom
Data coverage:
- Market volume and value
- Per Capita consumption
- Forecast of the market dynamics in the medium term
- Trade (exports and imports) in the UK
- Export and import prices
- Market trends, drivers and restraints
- Key market players and their profiles
Reasons to buy this report:
- Take advantage of the latest data
- Find deeper insights into current market developments
- Discover vital success factors affecting the market
This report is designed for manufacturers, distributors, importers, and wholesalers, as well as for investors, consultants and advisors.
In this report, you can find information that helps you to make informed decisions on the following issues:
- How to diversify your business and benefit from new market opportunities
- How to load your idle production capacity
- How to boost your sales on overseas markets
- How to increase your profit margins
- How to make your supply chain more sustainable
- How to reduce your production and supply chain costs
- How to outsource production to other countries
- How to prepare your business for global expansion
While doing this research, we combine the accumulated expertise of our analysts and the capabilities of artificial intelligence. The AI-based platform, developed by our data scientists, constitutes the key working tool for business analysts, empowering them to discover deep insights and ideas from the marketing data.
-
1. INTRODUCTION
Making Data-Driven Decisions to Grow Your Business
- REPORT DESCRIPTION
- RESEARCH METHODOLOGY AND AI PLATFORM
- DATA-DRIVEN DECISIONS FOR YOUR BUSINESS
- GLOSSARY AND SPECIFIC TERMS
-
2. EXECUTIVE SUMMARY
A Quick Overview of Market Performance
- KEY FINDINGS
- MARKET TRENDS This Chapter is Available Only for the Professional Edition PRO
-
3. MARKET OVERVIEW
Understanding the Current State of The Market and Its Prospects
- MARKET SIZE
- MARKET STRUCTURE
- TRADE BALANCE
- PER CAPITA CONSUMPTION
- MARKET FORECAST TO 2030
-
4. MOST PROMISING PRODUCT
Finding New Products to Diversify Your Business
This Chapter is Available Only for the Professional Edition PRO- TOP PRODUCTS TO DIVERSIFY YOUR BUSINESS
- BEST-SELLING PRODUCTS
- MOST CONSUMED PRODUCT
- MOST TRADED PRODUCT
- MOST PROFITABLE PRODUCT FOR EXPORT
-
5. MOST PROMISING SUPPLYING COUNTRIES
Choosing the Best Countries to Establish Your Sustainable Supply Chain
This Chapter is Available Only for the Professional Edition PRO- TOP COUNTRIES TO SOURCE YOUR PRODUCT
- TOP PRODUCING COUNTRIES
- TOP EXPORTING COUNTRIES
- LOW-COST EXPORTING COUNTRIES
-
6. MOST PROMISING OVERSEAS MARKETS
Choosing the Best Countries to Boost Your Exports
This Chapter is Available Only for the Professional Edition PRO- TOP OVERSEAS MARKETS FOR EXPORTING YOUR PRODUCT
- TOP CONSUMING MARKETS
- UNSATURATED MARKETS
- TOP IMPORTING MARKETS
- MOST PROFITABLE MARKETS
7. PRODUCTION
The Latest Trends and Insights into The Industry
- PRODUCTION VOLUME AND VALUE
8. IMPORTS
The Largest Import Supplying Countries
- IMPORTS FROM 2012–2023
- IMPORTS BY COUNTRY
- IMPORT PRICES BY COUNTRY
9. EXPORTS
The Largest Destinations for Exports
- EXPORTS FROM 2012–2023
- EXPORTS BY COUNTRY
- EXPORT PRICES BY COUNTRY
-
10. PROFILES OF MAJOR PRODUCERS
The Largest Producers on The Market and Their Profiles
This Chapter is Available Only for the Professional Edition PRO -
LIST OF TABLES
- Key Findings In 2023
- Market Volume, In Physical Terms, 2012–2023
- Market Value, 2012–2023
- Per Capita Consumption In 2012-2023
- Imports, In Physical Terms, By Country, 2012–2023
- Imports, In Value Terms, By Country, 2012–2023
- Import Prices, By Country Of Origin, 2012–2023
- Exports, In Physical Terms, By Country, 2012–2023
- Exports, In Value Terms, By Country, 2012–2023
- Export Prices, By Country Of Destination, 2012–2023
-
LIST OF FIGURES
- Market Volume, In Physical Terms, 2012–2023
- Market Value, 2012–2023
- Market Structure – Domestic Supply vs. Imports, In Physical Terms, 2012-2023
- Market Structure – Domestic Supply vs. Imports, In Value Terms, 2012-2023
- Trade Balance, In Physical Terms, 2012-2023
- Trade Balance, In Value Terms, 2012-2023
- Per Capita Consumption, 2012-2023
- Market Volume Forecast to 2030
- Market Value Forecast to 2030
- Products: Market Size And Growth, By Type
- Products: Average Per Capita Consumption, By Type
- Products: Exports And Growth, By Type
- Products: Export Prices And Growth, By Type
- Production Volume And Growth
- Exports And Growth
- Export Prices And Growth
- Market Size And Growth
- Per Capita Consumption
- Imports And Growth
- Import Prices
- Production, In Physical Terms, 2012–2023
- Production, In Value Terms, 2012–2023
- Imports, In Physical Terms, 2012–2023
- Imports, In Value Terms, 2012–2023
- Imports, In Physical Terms, By Country, 2023
- Imports, In Physical Terms, By Country, 2012–2023
- Imports, In Value Terms, By Country, 2012–2023
- Import Prices, By Country Of Origin, 2012–2023
- Exports, In Physical Terms, 2012–2023
- Exports, In Value Terms, 2012–2023
- Exports, In Physical Terms, By Country, 2023
- Exports, In Physical Terms, By Country, 2012–2023
- Exports, In Value Terms, By Country, 2012–2023
- Export Prices, By Country Of Destination, 2012–2023


