
Thailand - Fruits, Nuts And Peel (Sugar Preserved) - Market Analysis, Forecast, Size, Trends and Insights
Get instant access to more than 2 million reports, dashboards, and datasets on the IndexBox Platform.
View PricingThailand's Candied Fruit Exports Decline to $212M in 2023
Thailand Candied Fruit Exports
In 2023, approx. 57K tons of candied fruits were exported from Thailand; which is down by -7.8% compared with 2022 figures. Over the period under review, exports showed a deep slump. The most prominent rate of growth was recorded in 2017 when exports increased by 128%. The exports peaked at 158K tons in 2013; however, from 2014 to 2023, the exports remained at a lower figure.
In value terms, candied fruit exports dropped to $212M (IndexBox estimates) in 2023. Overall, exports saw a abrupt slump. The most prominent rate of growth was recorded in 2021 with an increase of 8.3%. The exports peaked at $507M in 2017; however, from 2018 to 2023, the exports stood at a somewhat lower figure.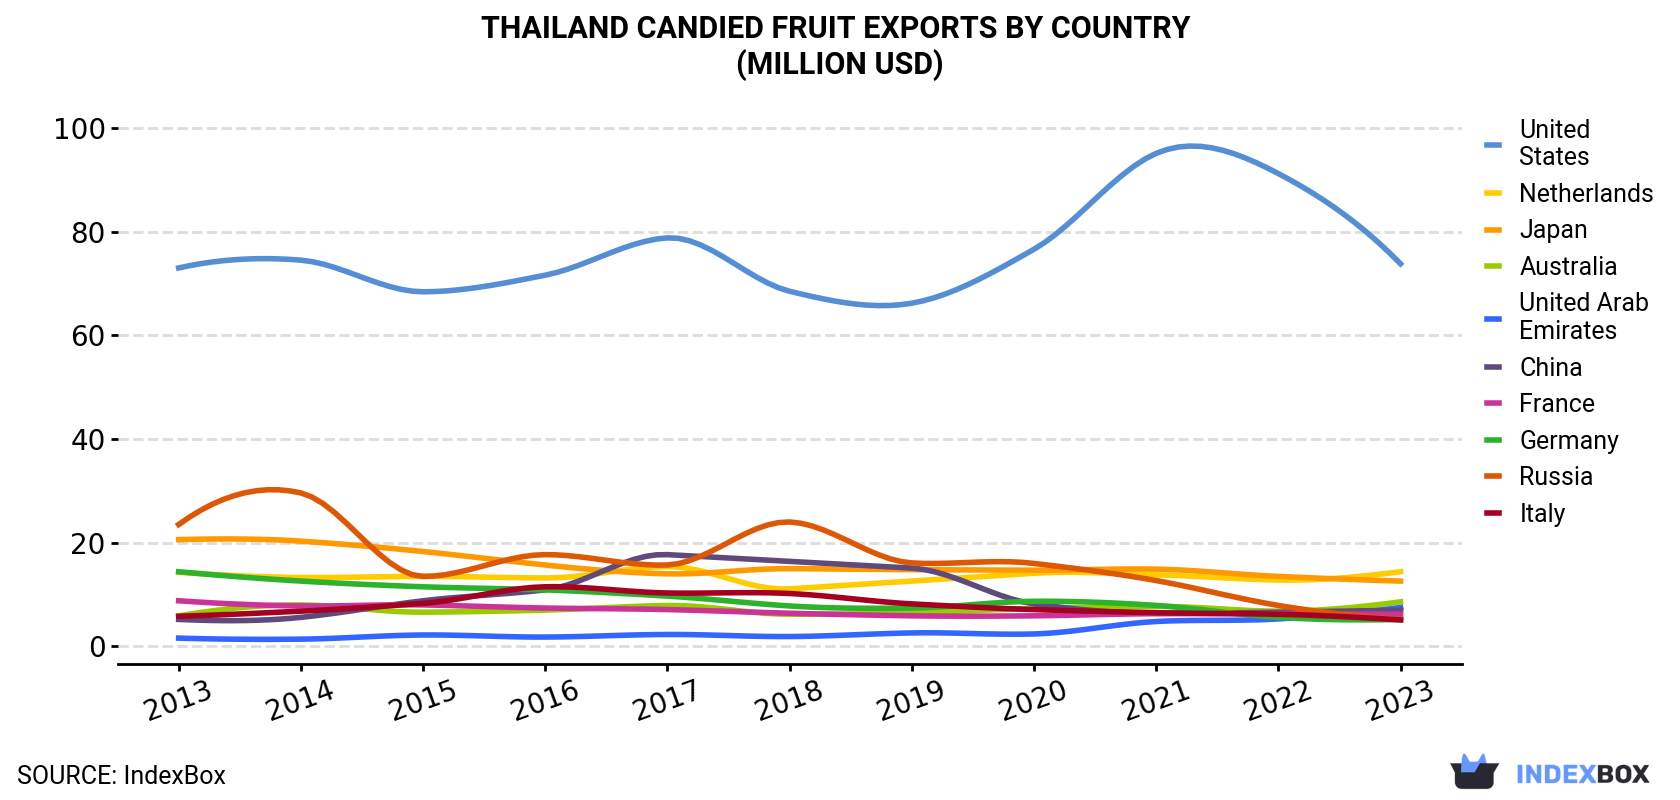
| COUNTRY | Export Value of Candied Fruit in Thailand (million USD) | ||||||||||
|---|---|---|---|---|---|---|---|---|---|---|---|
| 2013 | 2014 | 2015 | 2016 | 2017 | 2018 | 2019 | 2020 | 2021 | 2022 | 2023 | |
| United States | 73.0 | 74.5 | 68.4 | 71.6 | 78.8 | 68.5 | 66.2 | 76.6 | 95.1 | 91.2 | 73.8 |
| Netherlands | 14.3 | 13.3 | 13.5 | 13.2 | 15.4 | 11.1 | 12.6 | 14.1 | 13.8 | 12.8 | 14.4 |
| Japan | 20.6 | 20.3 | 18.3 | 15.7 | 14.0 | 15.0 | 14.8 | 14.7 | 14.9 | 13.5 | 12.6 |
| Australia | 5.9 | 8.0 | 6.6 | 7.0 | 7.9 | 6.2 | 6.5 | 7.3 | 7.7 | 6.8 | 8.6 |
| United Arab Emirates | 1.6 | 1.4 | 2.2 | 1.8 | 2.3 | 1.9 | 2.6 | 2.4 | 4.8 | 5.3 | 7.5 |
| China | 5.2 | 5.6 | 8.8 | 10.9 | 17.7 | 16.4 | 15.1 | 8.2 | 6.4 | 6.6 | 7.0 |
| France | 8.8 | 7.8 | 8.0 | 7.4 | 7.1 | 6.4 | 5.9 | 5.9 | 6.3 | 6.3 | 6.2 |
| Germany | 14.4 | 12.6 | 11.5 | 10.9 | 9.7 | 7.8 | 7.4 | 8.7 | 7.9 | 5.6 | 5.2 |
| Russia | 23.5 | 29.6 | 13.5 | 17.7 | 15.7 | 24.0 | 16.1 | 16.0 | 12.7 | 7.9 | 5.2 |
| Italy | 5.8 | 6.8 | 8.3 | 11.5 | 10.3 | 10.2 | 8.2 | 7.1 | 6.5 | 6.2 | 5.1 |
| Others | 299 | 317 | 299 | 302 | 328 | 305 | 290 | 68.3 | 72.2 | 63.2 | 66.7 |
| Total | 472 | 497 | 459 | 469 | 507 | 472 | 446 | 229 | 248 | 225 | 212 |
Exports by Country
the United States (19K tons) was the main destination for candied fruit exports from Thailand, accounting for a 33% share of total exports. Moreover, candied fruit exports to the United States exceeded the volume sent to the second major destination, the Netherlands (3.9K tons), fivefold. China (2.9K tons) ranked third in terms of total exports with a 5.2% share.
From 2013 to 2023, the average annual rate of growth in terms of volume to the United States amounted to -1.7%. Exports to the other major destinations recorded the following average annual rates of exports growth: the Netherlands (-0.6% per year) and China (+1.7% per year).
In value terms, the United States ($74M) remains the key foreign market for candied fruits exports from Thailand, comprising 35% of total exports. The second position in the ranking was taken by the Netherlands ($14M), with a 6.8% share of total exports. It was followed by Japan, with a 5.9% share.
From 2013 to 2023, the average annual rate of growth in terms of value to the United States was relatively modest. Exports to the other major destinations recorded the following average annual rates of exports growth: the Netherlands (+0.1% per year) and Japan (-4.8% per year).
Export Prices by Country
In 2023, the candied fruit price stood at $3,756 per ton (FOB, Thailand), growing by 2.2% against the previous year. In general, the export price posted a perceptible expansion. The growth pace was the most rapid in 2016 an increase of 101%. As a result, the export price reached the peak level of $6,889 per ton. From 2017 to 2023, the average export prices failed to regain momentum.
Prices varied noticeably by country of destination: amid the top suppliers, the country with the highest price was Japan ($5,586 per ton), while the average price for exports to China ($2,399 per ton) was amongst the lowest.
From 2013 to 2023, the most notable rate of growth in terms of prices was recorded for supplies to Taiwan (Chinese) (+11.1%), while the prices for the other major destinations experienced more modest paces of growth.
This report provides an in-depth analysis of the candied fruit market in Thailand. Within it, you will discover the latest data on market trends and opportunities by country, consumption, production and price developments, as well as the global trade (imports and exports). The forecast exhibits the market prospects through 2030.
Product coverage:
- FCL 625 - Fruit, Nuts, Peel, Sugar Preserved
Country coverage:
- Thailand
Data coverage:
- Market volume and value
- Per Capita consumption
- Forecast of the market dynamics in the medium term
- Trade (exports and imports) in Thailand
- Export and import prices
- Market trends, drivers and restraints
- Key market players and their profiles
Reasons to buy this report:
- Take advantage of the latest data
- Find deeper insights into current market developments
- Discover vital success factors affecting the market
This report is designed for manufacturers, distributors, importers, and wholesalers, as well as for investors, consultants and advisors.
In this report, you can find information that helps you to make informed decisions on the following issues:
- How to diversify your business and benefit from new market opportunities
- How to load your idle production capacity
- How to boost your sales on overseas markets
- How to increase your profit margins
- How to make your supply chain more sustainable
- How to reduce your production and supply chain costs
- How to outsource production to other countries
- How to prepare your business for global expansion
While doing this research, we combine the accumulated expertise of our analysts and the capabilities of artificial intelligence. The AI-based platform, developed by our data scientists, constitutes the key working tool for business analysts, empowering them to discover deep insights and ideas from the marketing data.
-
1. INTRODUCTION
Making Data-Driven Decisions to Grow Your Business
- REPORT DESCRIPTION
- RESEARCH METHODOLOGY AND AI PLATFORM
- DATA-DRIVEN DECISIONS FOR YOUR BUSINESS
- GLOSSARY AND SPECIFIC TERMS
-
2. EXECUTIVE SUMMARY
A Quick Overview of Market Performance
- KEY FINDINGS
- MARKET TRENDS This Chapter is Available Only for the Professional Edition PRO
-
3. MARKET OVERVIEW
Understanding the Current State of The Market and Its Prospects
- MARKET SIZE
- MARKET STRUCTURE
- TRADE BALANCE
- PER CAPITA CONSUMPTION
- MARKET FORECAST TO 2030
-
4. MOST PROMISING PRODUCT
Finding New Products to Diversify Your Business
This Chapter is Available Only for the Professional Edition PRO- TOP PRODUCTS TO DIVERSIFY YOUR BUSINESS
- BEST-SELLING PRODUCTS
- MOST CONSUMED PRODUCT
- MOST TRADED PRODUCT
- MOST PROFITABLE PRODUCT FOR EXPORT
-
5. MOST PROMISING SUPPLYING COUNTRIES
Choosing the Best Countries to Establish Your Sustainable Supply Chain
This Chapter is Available Only for the Professional Edition PRO- TOP COUNTRIES TO SOURCE YOUR PRODUCT
- TOP PRODUCING COUNTRIES
- COUNTRIES WITH TOP YIELDS
- TOP EXPORTING COUNTRIES
- LOW-COST EXPORTING COUNTRIES
-
6. MOST PROMISING OVERSEAS MARKETS
Choosing the Best Countries to Boost Your Exports
This Chapter is Available Only for the Professional Edition PRO- TOP OVERSEAS MARKETS FOR EXPORTING YOUR PRODUCT
- TOP CONSUMING MARKETS
- UNSATURATED MARKETS
- TOP IMPORTING MARKETS
- MOST PROFITABLE MARKETS
7. PRODUCTION
The Latest Trends and Insights into The Industry
- PRODUCTION, HARVESTED AREA AND YIELD
8. IMPORTS
The Largest Import Supplying Countries
- IMPORTS FROM 2012–2023
- IMPORTS BY COUNTRY
- IMPORT PRICES BY COUNTRY
9. EXPORTS
The Largest Destinations for Exports
- EXPORTS FROM 2012–2023
- EXPORTS BY COUNTRY
- EXPORT PRICES BY COUNTRY
-
10. PROFILES OF MAJOR PRODUCERS
The Largest Producers on The Market and Their Profiles
This Chapter is Available Only for the Professional Edition PRO -
LIST OF TABLES
- Key Findings In 2023
- Market Volume, In Physical Terms, 2012–2023
- Market Value, 2012–2023
- Per Capita Consumption In 2012-2023
- Imports, In Physical Terms, By Country, 2012–2023
- Imports, In Value Terms, By Country, 2012–2023
- Import Prices, By Country Of Origin, 2012–2023
- Exports, In Physical Terms, By Country, 2012–2023
- Exports, In Value Terms, By Country, 2012–2023
- Export Prices, By Country Of Destination, 2012–2023
-
LIST OF FIGURES
- Market Volume, In Physical Terms, 2012–2023
- Market Value, 2012–2023
- Market Structure – Domestic Supply vs. Imports, In Physical Terms, 2012-2023
- Market Structure – Domestic Supply vs. Imports, In Value Terms, 2012-2023
- Trade Balance, In Physical Terms, 2012-2023
- Trade Balance, In Value Terms, 2012-2023
- Per Capita Consumption, 2012-2023
- Market Volume Forecast to 2030
- Market Value Forecast to 2030
- Products: Market Size And Growth, By Type
- Products: Average Per Capita Consumption, By Type
- Products: Exports And Growth, By Type
- Products: Export Prices And Growth, By Type
- Production Volume And Growth
- Yield And Growth
- Exports And Growth
- Export Prices And Growth
- Market Size And Growth
- Per Capita Consumption
- Imports And Growth
- Import Prices
- Production, In Physical Terms, 2012–2023
- Production, In Value Terms, 2012–2023
- Area Harvested, 2012–2023
- Yield, 2012–2023
- Imports, In Physical Terms, 2012–2023
- Imports, In Value Terms, 2012–2023
- Imports, In Physical Terms, By Country, 2023
- Imports, In Physical Terms, By Country, 2012–2023
- Imports, In Value Terms, By Country, 2012–2023
- Import Prices, By Country Of Origin, 2012–2023
- Exports, In Physical Terms, 2012–2023
- Exports, In Value Terms, 2012–2023
- Exports, In Physical Terms, By Country, 2023
- Exports, In Physical Terms, By Country, 2012–2023
- Exports, In Value Terms, By Country, 2012–2023
- Export Prices, By Country Of Destination, 2012–2023


